ISSN 0104-6632 Printed in Brazil
www.abeq.org.br/bjche
Vol. 25, No. 01, pp. 51 - 58, January - March, 2008
Brazilian Journal
of Chemical
Engineering
EXPERIMENTAL STUDY OF FLUIDIZED BED
AGGLOMERATION OF ACEROLA POWDER
G. C. Dacanal and F. C. Menegalli *
Laboratory of Process Engineering, LEP, School of Food Engineering, State University of Campinas, UNICAMP, Phone: +(55) (19) 3521-4039; Fax: +(55) (19) 3521-4027
Cx. P. 6121, CEP: 13083-862, Campinas - São Paulo, Brazil. E-mail: [email protected], E-mail: [email protected]
(Receveid: March 09, 2006 ; Accepted. November 07, 2007
Abstract - The aim of this work was to study the main effects of acerola powder on fluidized bed agglomeration. A 24-1 fractional factoring design was used to evaluate the main operating conditions (fluidizing air temperature, fluidizing air velocity, atomizing air flow and height of nozzle in the bed). The mechanical and physicochemical product changes were determined by analysis of particle diameter, moisture content, wetting time and bed porosity. The particle enlargement by agglomeration occurred when the relative humidity in the bed increased and, thus, the moisture of the product increased. However, the excessive increase in relative humidity resulted in a decrease in yield, caused by caking and product incrustation. The consolidation of small granules resulted in an increase in the instant properties, decreasing the wetting time and increasing the solubility in a short period of agitation.
Keywords: Agglomeration; Granulation; Fluid bed; Acerola; Powder.
INTRODUCTION
Food powder agglomeration is commonly used to improve the instant properties of spray-dried products. However, this process can also be used when it is desirable to improve the flowability or change the visual properties of the powder by enlargement of the particles (Schubert, 1987).
The main properties of agglomerates, such as size, porosity, solubility, wettability, shape and density, depend on the type of agglomeration process and on the operating conditions during agglomeration. Fluidized bed agglomeration is one of the processes suitable for producing agglomerates with high porosity and good mechanical resistance for handling and packaging (Turchiuli et al., 2005).
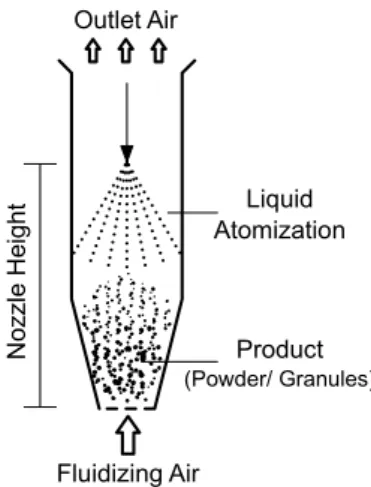
The principles of operation of fluidized bed agglomeration consist of fluidization of particles by
a hot air flow and surface particle wetting by liquid binder atomization. Collisions between wet particles on the fluid bed form liquid bridges and particle coalescence. On drying these particles, the bridges solidify resulting in a consolidation of the agglomerates (Iveson et al., 2001).
MATERIAL AND METHODS
The Acerola Powder
Equipment
The equipment used was a batch-fluidized bed with 0.5 kg of powder in each run. The fluid bed chamber had a conical base with a diameter of 75 mm and a height of 150 mm and a cylindrical body with a diameter of 150 mm and a height of 600 mm (Figure 1). An on/off electrical heater controlled the fluidizing air temperature. The fluidizing air flow was monitored by a rotameter. The elutriated particles were collected by a cyclone. The amount of acerola powder used in each batch was 0.5 kg. The liquid binder used was water at 27 °C with a flow rate of 2 ml/min. The atomizing air flow at 1 bar of pressure was measured by a rotameter. The nozzle height in the bed was also measured.
Methods
The agglomerated products and raw acerola powder were evaluated by the following physical properties: mean particle size and distribution, moisture content, wetting time and bulk porosity.
a) Particle Size Distribution and Mean Particle Diameter (DPM)
Particle size distribution and mean particle diameter were measured by sieving. The mesh apertures were between 38 µm and 1180 µm.
Equation 1 evaluates the mean particle diameter based on the mass fraction of the samples retained on the several mesh apertures.
i i
DPM= Σ x dp (1)
where
dp
i is the mesh aperture i andx
i is the mass fraction of the sample.b) Moisture (MST)
Product moisture was determined by drying at 70 °C in vacuum (pressure ≤ 100 mmHg) samples containing 3 to 4 g of acerola powder.
c) Wetting time (WET)
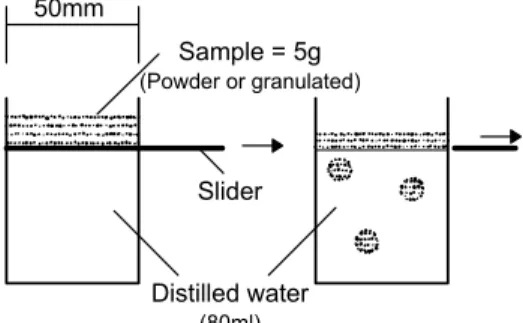
The time necessary to complete wetting and immersion of a powder sample on a liquid surface is called the wetting time. Wetting time is commonly used to evaluate the instant properties of food powders. The wetting time device is shown in the scheme in Figure 2.
Measurement of wetting time started when the powder sample (5 g of powder or agglomerated product) and the testing liquid (80 ml of water at 27 °C) were brought into contact by quickly pulling the slider that separate the powder and liquid sections.
Outlet Air
Product
(Powder/ Granules)
Liquid Atomization
Fluidizing Air
Sample = 5g
(Powder or granulated)
Slider
Distilled water
(80ml)
50mm
Figure 2: Wetting time device scheme (Hogekamp and Schubert, 2003).
d) Bulk Porosity (POR)
Bulk porosity (
ε
) was calculated by the ratio of the solid to bulk densities (Equation 2). The bulk density (ρ
b) was determined with a texture analyzer (model: TATXT2i, Stable Micro Systems, Surrey, England). About 20 g of sample was placed on a cylindrical container with an inner diameter of 40 mm and a surface contact sensor was used to determine the bulk sample height and volume. The ratio between the mass and the volume of the sample is the bulk density. The solid densities (ρ
s) were measured by the toluene picnometric method. About 5 g of sample was placed in a 25 ml bottle. The residual volume was filled with toluene. Solid density is the ratio between the mass and the free void sample volume.b
s
1 ρ
ε = −
ρ (2)
e) Caking (CAK) and product incrustation (INC)
The presence (+) or absence (-) of caking and product incrustation was evaluated for each experimental run. The presence of one or both factors indicates an unstable relation between the amount of atomized liquid and the drying capacity.
For agglomeration kinetics, where there was (+) incrustation, the process yield was also measured.
Experimental Design
A 24-1 fractional factorial design with four central points was used to evaluate the main variables of the fluidized bed granulation. The process time or period of liquid atomization was fixed at 5 minutes. The independent variables studied in the experimental design were
Fluidizing air temperature (TAR); Fluidizing air velocity (VAR); Atomizing air flow (ATM); Height of the nozzle (NOZ).
Table 1 shows the –1, 0 and +1 levels and their relative values.
The agglomerated and raw powder properties were statistically evaluated by the following tests: Mean particle diameter (DPM);
Moisture content (MST); Wetting time (WET); Bulk porosity (POR).
The software STATISTICA v5.5 was used to calculate the effects responses.
The most suitable operational conditions were selected based on the effects responses and their statistical significance. Under these selected conditions, agglomeration kinetics evaluates particle growth and product transformations over time.
Table1: Independent variables and levels in the study.
Variable -1 0 +1
TAR (°C) 75 82.5 90
VAR (m/s) 0.25 0.35 0.45
ATM (l/h) 0.50 0.60 0.70
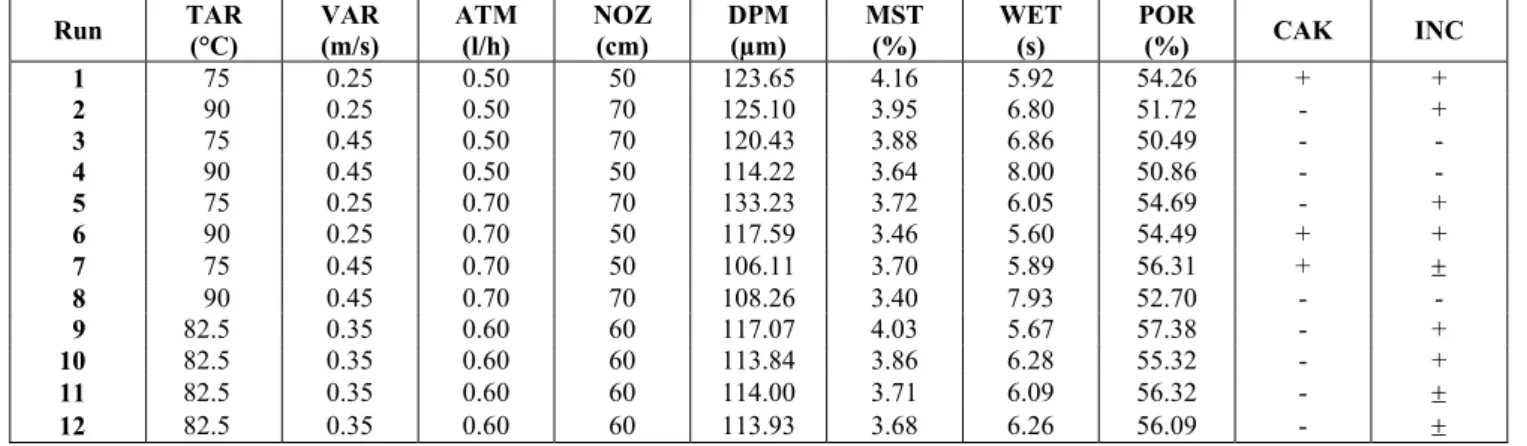
Table 2: Operational conditions of the process and average results obtained with the experimental design.
Run TAR (°C)
VAR (m/s)
ATM (l/h)
NOZ (cm)
DPM (µm)
MST (%)
WET (s)
POR
(%) CAK INC
1 75 0.25 0.50 50 123.65 4.16 5.92 54.26 + +
2 90 0.25 0.50 70 125.10 3.95 6.80 51.72 - +
3 75 0.45 0.50 70 120.43 3.88 6.86 50.49 - -
4 90 0.45 0.50 50 114.22 3.64 8.00 50.86 - -
5 75 0.25 0.70 70 133.23 3.72 6.05 54.69 - +
6 90 0.25 0.70 50 117.59 3.46 5.60 54.49 + +
7 75 0.45 0.70 50 106.11 3.70 5.89 56.31 + ±
8 90 0.45 0.70 70 108.26 3.40 7.93 52.70 - -
9 82.5 0.35 0.60 60 117.07 4.03 5.67 57.38 - +
10 82.5 0.35 0.60 60 113.84 3.86 6.28 55.32 - +
11 82.5 0.35 0.60 60 114.00 3.71 6.09 56.32 - ±
12 82.5 0.35 0.60 60 113.93 3.68 6.26 56.09 - ±
Agglomeration Kinetic
The duration of the agglomeration kinetics was ten minutes and the following operational conditions were used:
TAR = 75 °C; VAR = 0.45 m/s; ATM = 0.70 l/h; NOZ = 70 cm;
m
liq= 2 ml/min.The agglomeration kinetics was evaluated for ten different batches, totaling ten runs for the ten minutes of granulation.
RESULTS AND DISCUSSION
Experimental Design
The results obtained from the 24-1 experimental design runs and respective operational conditions are shown in Table 2. The statistical analysis evaluates the data at a confidence level of 95%. Figures 3, 4, 5 and 6 show the results for raw and agglomerated acerola powder and the significant statistical effects at five minutes of granulation.
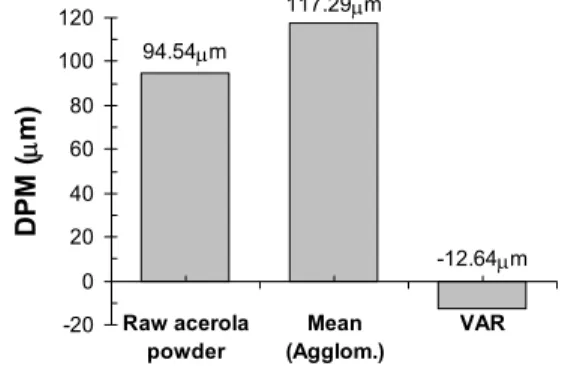
a) Mean Particle Diameter
Only the variable VAR had a significant effect on the mean particle diameter (DPM) (Figure 3). The DPM decreased about 12.64 µm when the fluidizing air velocity increased from 0.25 m/s to 0.45 m/s. However, the particles of the agglomerated product were still 24% larger than those of the raw acerola powder.
The increase in fluidizing air velocity (VAR) with the liquid flow fixed at 2 ml/min resulted in a
dilution of the inner air humidity due to the decrease in the ratio between atomized liquid flow and fluidizing air flow, so the inner relative air humidity decreased too, causing a decrease in particle growth rate.
The inlet air temperature (TAR) should also affect particle growth, but at the levels of the present study, this variable was not statistically significant.
b) Moisture
The variables TAR and ATM had statistically significant effects on the moisture response (Figure 4). The results show that when TAR increased from 75 °C to 90 °C, the agglomerated powder moisture decreased by about 0.25%. The relative air humidity at the bed bottom decreased when TAR increased, and consequently, the agglomerated product became drier.
Product moisture also decreased by about 0.37% when the atomizing air flow increased from 0.50 l/h to 0.70 l/h. The average moisture of the agglomerated product was 70% higher than that of the raw acerola powder. The higher atomizing air flow produced small drops that were easily elutriated; consequently, the agglomerated powder moisture became lower than that for the larger drops (lower atomizing air flow).
c) Wetting Time
d) Bulk Porosity
None of the variables had a statistically significant effect on the bulk porosity response. However, the average bulk porosity of the agglomerates was 5.5% higher than that of the raw acerola powder (Figure 6).
e) Caking
The caking was qualitatively evaluated. The variable CAK in Table 2 indicates the presence (+) or absence (-) of large agglomerates after 5 minutes of granulation. The caking occurred when the nozzle height (NOZ) was at the lowest position (50 cm).
f) Product Incrustation
Product incrustation was also qualitatively evaluated by the presence (+), absence (-) or partial incrustation (±) of the product on the inner wall of the chamber. Product incrustation was intensified when the fluidizing air velocity (VAR) was at the
lowest or middle levels (0.25 m/s and 0.35 m/s).
g) Suitable Operational Conditions
Suitable operational conditions are those that result in a process with a high yield and low rates of caking and product incrustation (↓CAK and ↓INC). However, it was also desirable that the agglomerated product have the following characteristics:
Low wetting time (↓WET); Low moisture content (↓MST); High mean particle diameter (↑DPM); High bulk porosity (↑POR).
Based on the statistically significant effects of the experimental design, Table 3 shows values at the which the main variables should be set to achieve the desired process.
Table 3 indicates that it was not possible to select and satisfy all desired conditions. The operational conditions opted for were those that gave a process with a high yield with a low wetting time and a low moisture content, so, the parameters selected were TAR: 75 °C, VAR: 0.45 m/s, ATM: 0.70 l/h and NOZ: 70 cm.
-12.64µm 117.29µm
94.54µm
-20 0 20 40 60 80 100 120 Raw acerola powder Mean (Agglom.) VAR D P M (µ m ) 2.22% 3.77% -0.25% -0.34% -0.5 0.0 0.5 1.0 1.5 2.0 2.5 3.0 3.5 4.0 Raw acerola powder Mean (Agglom.) TAR QB MS T (% )
Figure 3: Representation of the mean particle diameter
for the raw/agglomerated acerola powder and significant effect at a confidence level of 95%.
Figure 4: Representation of the moisture content for
the raw/agglomerated acerola powder and significant effects at a confidence level of 95%.
1.08s 0.90s 6.45s 14.32s 0 2 4 6 8 10 12 14 16 Raw acerola powder Mean (Agglom.) TAR VAR W E T ( s ) 48.68% 54.22% 0 10 20 30 40 50 60
Raw acerola powder Mean (Agglomerated)
PO
R
(%
)
Figure 5: Representation of the wetting time for the
raw/agglomerated acerola powder and significant effects at a confidence level of 95%.
Figure 6: Representation of the bulk porosity for the
Table 3: The operational conditions suitable for fluidized bed agglomeration.
↓CAK ↓INC ↓WET ↓MST ↑DPM
TAR (°C) - - 75* 90 -
VAR (m/s) - 0.45* 0.25 - 0.25
ATM (l/h) - - - 0.70* -
NOZ (cm) 70* - - - -
* Selected operational conditions.
Agglomeration Kinetics
The agglomeration kinetics used the operational conditions obtained from the experimental design.
a) Mean Particle Diameter
The behavior of the growth kinetics can be observed by the displacement of the particle size distribution peak (Figure 7). Figure 8 shows how the mass fraction changed over time for each particle size. The mass fraction of fines (64 µm and 90.5 µm) decreased to form larger particles (128 µm, 181 µm and 256 µm).
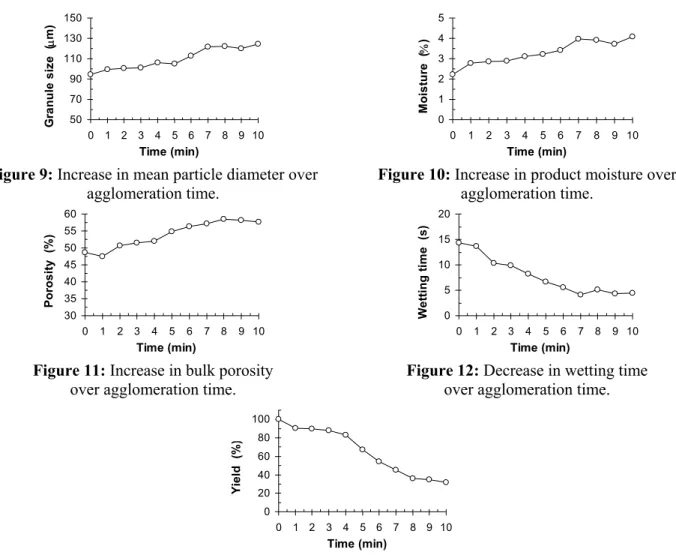
Figure 9 shows that the mean particle diameter increased 30% with agglomeration. During the first 5 minutes the agglomeration rate was lower. The highest growing rate was seen in the period between 5 and 7 minutes. After that particle consolidation stopped and the mean particle diameter remained unchanged due to the consolidation and breakage counterpoise.
b) Moisture Content
Figure 10 shows that the agglomerated powder moisture increased 80% in relation to that of the raw acerola powder (MST = 2.2%). The product moisture increased until the seventh minute of the process.
After that, absorption of the moisture stopped and product moisture remained at 4%.
c) Bulk Porosity
Figure 11 shows that the bulk porosity increased from 35.5% to 48% in 8 minutes of the process.
d) Wetting Time
Figure 12 shows that the wetting time decreased from 14.2 s to 4.2 s in 7 minutes of the process. The particle growth resulted in an improvement of the instant properties. The agglomerated powder had larger and more porous particles than the raw acerola powder and penetrated the liquid surface more quickly due to the capillary forces.
e) Product Incrustation
Figure 13 shows the decrease in yield due to product incrustation. The initial amount of acerola powder was 0.5 kg. During agglomeration, a portion of the product coalesced on the inner wall and formed an incrustation layer due to liquid atomization. The incrustation mass fraction at 10 minutes of the process reached 70%. Based on this result, a vibration or scraping system should be attached to equipment to minimize product incrustation and make fluidized bed agglomeration a viable process.
10 100 1000
DPM (µm)
Matéria Prima
2 min 4 min 6 min 8 min 10 min
Raw acerola powder
M
a
s
s
f
ra
c
ti
o
n
(
%
) dpi (µm)
0 10 20 30 40 50
0 2 4 6 8 10
Time (min)
M
a
s
s
f
ra
c
ti
o
n
(
%
) 19
45.5 64 90.5 128 181 256 362.5 512.5 725 1015
Figure 7: Peak displacement on particle size
distribution over agglomeration time.
Figure 8: Evolution of the mass fraction (xi) of particle
50 70 90 110 130 150
0 1 2 3 4 5 6 7 8 9 10
Time (min) G ra n u le s ize (µ m ) 0 1 2 3 4 5
0 1 2 3 4 5 6 7 8 9 10
Time (min) M o is tu re (% )
Figure 9: Increase in mean particle diameter over
agglomeration time.
Figure 10: Increase in product moisture over
agglomeration time. 30 35 40 45 50 55 60
0 1 2 3 4 5 6 7 8 9 10
Time (min) Po ro s ity (% ) 0 5 10 15 20
0 1 2 3 4 5 6 7 8 9 10
Time (min) W e tti n g t im e (s )
Figure 11: Increase in bulk porosity
over agglomeration time.
Figure 12: Decrease in wetting time
over agglomeration time.
0 20 40 60 80 100
0 1 2 3 4 5 6 7 8 9 10
Time (min) Yi e ld (% )
Figure 13: Fraction of product loss by incrustation during agglomeration.
CONCLUSIONS
The experimental design and statistical analysis evaluated how the operational conditions modified the product properties. The increase in fluidizing air temperature resulted in a lower increase in agglomerated moisture and a decrease in the wetting time. The increase in fluidizing air velocity resulted in a decrease in product incrustation due to the decrease in the ratio between atomized liquid and fluidizing air flows. However, for this situation, the instant properties and the particle growth rate decreased. The increase in atomizing air flow caused production of small droplets and a decrease in the rate of moisture adsorption by the product. The caking decreased when the nozzle height was at the highest position.
Based on the results on the agglomeration kinetics, it can be concluded that the particle growth resulted in an increase in bulk porosity and an improvement of the instant properties. The
agglomeration time necessary to form the instant acerola powder was established at 7 minutes.
NOMENCLATURE
ATM Atomizing air flow l/h
CAK Caking (-)
DPM Mean particle diameter
µm
i
dp Sieve aperture
µm
INC Product incrustation (-)
POR Bulk porosity %
TAR Fluidizing air flow °C
TI Wetting time s
MST Moisture content %
liq
m Atomizing liquid flow ml/min
NOZ Nozzle height m
VAR Fluidizing air velocity m/s
i
b
ρ
Bulk density kg/m³s
ρ
Solid density kg/m³ACKNOWLEDGMENTS
The authors would like to thank Conselho Nacional de Desenvolvimento Científico e Tecnológico – CNPq – Brazil for their financial support.
REFERENCES
Hogekamp, S. and Schubert, H., Rehydration of Food Powders, Food Science and Technology
International, no. 9, 223-235 (2003).
Iveson, S. M., Litster, J. D., Hapgood, K. and ENNIS, B. J., Nucleation, Growth and Breakage Phenomena in Agitated Wet Granulation Processes: A Review, Powder Technology, no. 117, 3-39 (2001).
Schubert, H., Food Particle Technology: Part I. Properties of Particles and Particulate Food Systems, Journal of Food Engineering, no. 6, 1-32 (1987).