Carbon monoxide quantification by UV/Vis
spectrophotometry: a method validation and
iii
Dissertação do 2º ciclo de estudos conducente ao grau de Mestre
em Toxicologia Analítica, Clínica e Forense:
Carbon monoxide quantification by UV/Vis
spectrophotometry: a method validation and
stability study in whole blood samples
Armanda Manuela Henriques de Barros Ferreira
Trabalho realizado sob a orientação dos Professores Prof. Doutor Ricardo Jorge
Dinis-Oliveira, Prof.ª Doutora Ana Oliveira e Prof.ª Doutora Maria de Lourdes
Bastos.
v É autorizada a reprodução integral desta dissertação apenas para efeitos de investigação, mediante declaração escrita do interessado, que a tal se compromete.
vii
Construí amigos, enfrentei derrotas, venci obstáculos, bati na porta da
vida e disse-lhe: Não tenho medo de vivê-la.
Augusto Cury
ix
AGRADECIMENTOS
Uma palavra de agradecimento a todos os orientadores por todo o apoio.
Uma palavra especial ao Prof. Ricardo Dinis-Oliveira por todo o apoio, por todas
as críticas, por ter sido incansável comigo para que eu atingisse todos os meus
objetivos, a ele um grande obrigado.
Aos meus pais, sem eles nada disto era possível.
Ao Diogo, pelo apoio incondicional.
xi
RESUMO
O monóxido de carbono (CO) é um gás altamente tóxico, sem cor, sabor ou cheiro. É formado quando há combustão incompleta de matéria orgânica. Aproximadamente 40% do CO atmosférico provém de fontes naturais e os restantes 60% da intervenção humana., mas também pode ser gerado endogenamente. As intoxicações por CO são uma realidade comum, resultando em mais de 50000 admissões urgentes nos EUA. Em Portugal, as intoxicações por CO não são muito comuns, mas não devem ser desprezadas. A toxicidade do Co está relacionada com a sua interação com a hemoglobina (Hb), formando o complexo carboxihemoglobina (COHb), levando a um comprometimento do transporte de oxigénio para tecidos periféricos.
Um método espectrofotométrico para quantificação de COHb foi validado de acordo com a European Medicines Agency. O limite de deteção (LOD), limite de quantificação (LOQ), precisão (%CV), exatidão e linearidade do método foram determinados. Após colheita, o sangue foi misturado com fluoreto de sódio (NaF) 2.5% e separado em 2 tubos contendo solução hemolítica – um foi borbulhado com oxigénio e outro borbulhado com CO. Quantidades apropriadas destas soluções foram misturadas para a preparação de soluções de concentrações conhecidas. Posteriormente, todas as soluções padrão foram misturadas com ditionito de sódio para promover a redução e analisadas por espectrofotometria UV/Vis a 420 e 432 nm. Foi verificada linearidade para concentrações de COHb entre 0-100%, com r2≥0.98. A %CV intra e interdia foram inferiores a 15%. A percentagem de recuperação apresentou valores entre 89.3-117.3, com um desvio padrão de 10.1%. LOD e LOQ variaram entre 0.9-1.4%.
Para análise da estabilidade da COHb, amostras de sangue foram armazenadas a três temperaturas diferentes [temperatura ambiente (RT), 4ºC e -20ºC] e analisados com NaF – simulando um intoxicação fatal, e sem NaF – simulando uma intoxicação não-fatal. Nas amostras com %COHb correspondente a uma intoxicação não-fatal, a -20ºC e 4ºC não ocorreram variações na concentração de COHb entre a primeira análise e posteriores reanálises. À RT ocorreu uma variação negativa de 21,4% em relação ao valor inicial. Nas amostras com %COHb correspondente a uma intoxicação fatal tiveram o mesmo comportamento a -20ºC e a 4ºC. Já à RT ocorreu um aumento de 21,1% em comparação com o valor inicial. Concluindo, um método espectrofotométrico para quantificação da %COHb foi validado. A %COHb não sofreu variação ao longo do tempo a -20ºC e a 4ºC. RT não é uma temperatura de armazenamento recomendada para a quantificação de %COHb e o NaF parece não ter influência na sua estabilidade,
Palavras-chave: monóxido de carbono, fluoreto de sódio, validação de método, estabilidade
xiii
ABSTRACT
Carbon monoxide (CO) is a highly toxic, colorless, tasteless and odorless gas. It is formed when there is incomplete combustion of organic matter. Approximately 40% of atmospheric CO comes from natural sources and the remaining 60% comes from human activities. CO can also be generated endogenously. CO intoxications are a common reality, resulting in over 50000 emergency admissions in USA. In Portugal, CO intoxications are not very common, but cannot be overlooked. CO toxicity is mainly related with its interaction with hemoglobin (Hb) forming carboxyhemoglobin (COHb) and leading to a compromise of oxygen transportation to peripheral tissues.
A spectrophotometric method for quantification of COHb was validated accordingly to European Medicines Agency. The limit of detection (LOD), limit of quantification (LOQ), precision (%CV), accuracy and linearity of the method were determined. After collection, blood was mixed with sodium fluoride (NaF) 2.5% and separated in 2 tubes containing hemolysis solution – one was bubbled with oxygen and the other bubbled with CO. Appropriate amounts of these solutions were mixed in order to prepare standard solutions of known concentrations. Subsequently, all standards solutions were mixed with sodium dithionite to promote a reduction and analyzed by UV/Vis spectrophotometry at 420 and 432 nm. Linearity was verified in a concentration range from 0-100% of COHb, with r2≥0.98. The %CV intra and inter-day were below 15%. The recovery percentage ranged from 89.3-117.3%, with a deviation of 10.1%. LOD and LOQ varied from 0.9-1.4%.
In order to analyze the stability of COHb, blood samples were stored at three temperatures (room temperature (RT), 4ºC and -20ºC) and analyzed with NaF – simulating a fatal intoxication, and without NaF – simulating non-fatal intoxication. In non-fatal
intoxication samples, at -20ºC and 4ºC there was no variation in COHb concentration
between first analysis and posterior re-analysis. At RT there was a negative variation of 21.4% relatively to initial value. Fatal intoxication samples exhibited the same behavior at -20ºC and 4ºC. At RT, there was an increase of 21.1% in comparison to initial value.
In conclusion, a spectrophotometric method for %COHb quantification was validated. The %COHb did not suffer variation throughout time at -20ºC and 4ºC. RT is not a recommended storage temperature for %COHb quantification and NaF seems not to have any relevance in the stability.
xv
INDEX
FIGURES INDEX ... xix
TABLES INDEX ... xxi
Abbreviations ... xxiii
1. INTRODUCTION ... 3
2. CARBON MONOXYDE PHYSICAL AND CHEMICAL PROPERTIES ... 4
3. SOURCES OF CARBON MONOXIDE ... 4
3.1 External sources ... 4
3.2 Endogenous sources ... 5
4. PHYSIOLOGICAL ROLES OF CO ... 6
5. EPIDEMIOLOGY ... 7
6. TOXICITY MECHANISMS ... 8
7. SIGNS AND SYMPTOMS AFTER POISONING ... 9
8. FORENSIC RELATED ASPECTS ... 11
8.1 Autoptic findings ... 11
8.2 Collection and sample preservation ... 11
9. ANALYTICAL METHODS USED FOR CO/%COHb DETERMINATION ... 12
10. OBJECTIVES ... 19
11. MATERIAL AND METHODS ... 23
11.1 Reagents and standards ... 23
11.2 Collection of blood samples ... 23
11.3 Preparation of working solutions ... 23
11.4 Preparation of standards for calculation of factors F1, F2 and F3 and calculation of %COHb ... 23
11.5 Method validation ... 24
11.5.1 Linearity ... 25
11.5.2 Limit of detection and limit of quantification ... 25
11.5.3 Precision and accuracy ... 25
11.6 Stability study ... 26
12. RESULTS AND DISCUSSION ... 31
xvii
12.2 Calculated factors ... 31
12.3 Method validation ... 32
12.3.1 Linearity ... 32
12.3.2 Limit of Detection and Limit of Quantification ... 33
12.3.3 Precision, accuracy and recovery ... 33
11.4 Stability study ... 33
13. CONCLUSIONS ... 39
14. FUTURE PERSPECTIVES ... 43
xix
FIGURES INDEX
Figure 1: Effect of CO in O2 binding: when CO enters the erythrocyte, besides the fact that
it blocks O2 binding to Hb, it also causes an allosteric alteration in Hb, which cannot
dissociate O2. This leads to a compromise in O2 transportation to peripheral tissues, leading
to a hypoxic situation.
Figure 2: Effect of CO in cytochrome c oxidase. Electron transference from cytochrome c
oxidase to O2 is blocked, leading to a breakdown of O2 supply, aggravated the hypoxia.
Figure 3: Lividity of cherry-red/bright-pink color in a Caucasian individual, as consequence
of COHb formation (reproduced from Dinis-Oliveira et al, 2010, with permission).
Figure 4: Preparation of solutions of COHb and O2Hb at 100%.
Figure 5: Linearity study for n=3.
Figure 6: Evolution of %COHb throughout the storage time for non-fatal intoxication
sample.
xxi
TABLES INDEX
Table 1 – Physical and chemical properties of CO (adapted from Varma et al., 2015 and Wilbur et al., 2012).
Table 2 – Principal signs and symptoms in acute CO intoxications (based in Nelson and
Cox, 2008).
Table 3 – Classical methods used for CO determination (adapted from Widdop, 2001).
Table 4 – Types of detectors used in GC methods (based in Boumba and Vougiouklakis,
2005).
Table 5 – Other methods used for COHb analysis (adapted from Widdop, 2001 and Boumba
and Vougiouklakis, 2005).
Table 6 – Comparison between spectrophotometric and GC methods (adapted Boumba
and Vougiouklakis, 2005).
Table 7 – Calculated factors in method validation and stability study.
Table 8 – Results from precision and accuracy.
Table 9 – Stability of %COHb (nonfatal intoxication) at three different temperatures (RT, -20ºC and 4ºC.
Table 10 – Stability of %COHb (fatal intoxication) at three different temperatures (RT, -20ºC and 4ºC.
xxiii
Abbreviations
Abs – Absorbance
ADP – Adenosine diphosphate
cGMP – Cyclic guanosine monophosphate CIAV – Centro de Informação Antivenenos CO – Carbon monoxide
CO2 – Carbon dioxide
COHb – Carboxyhemoglobin CV – coefficient of variation
EDTA – Ethylenediaminetetraacetic acid
EPA – United States Environmental Protection Agency F1 – Factor 1 F2 – Factor 2 F3 – Factor 3 GC – Gas-chromatography Hb – Hemoglobin HHb – Reduced hemoglobin HO – heme-oxygenases KF – Potassium fluoride KH2PO4 – Monopotassium phosphate K2HPO4 – Dipotassium phosphate LOD – Limit of detection
LOQ – Limit of quantification MetHb – Methemoglobin NaF – Sodium fluoride NaOH – Sodium hydroxide NO – oxide nitric
O2 – Oxygen
O2Hb – Oxyhemoglobin ppm – parts per million RT – Room temperature
S100B – calcium-binding protein WHO – World Health Organization
1
Introduction
3
1.
INTRODUCTIONIntoxications are one of the problems that affect people’s lives (Dinis-Oliveira et al., 2013). In Portugal, the Centro de Informação Antivenenos (CIAV) received an average of 77 calls per day related with intoxications, between 2001 and 2011. In 2011, in absolute numbers, the CIAV has registered 8,973 potential cases of intoxications in children until 15 years old and 12,621 cases in adults, with the digestive tract representing 87% and 80% of cases, respectively (Dinis-Oliveira et al., 2013).
According to World Health Organization (WHO) data, in 2012 an estimated 193,460 people died worldwide from unintentional poisoning. In the same year, unintentional poisoning caused the loss of over 10.7 million years of healthy life (World Health Organization)
Carbon monoxide (CO) poisonings are relatively common (Ernst and Zibrak, 1998; Hampson and Weaver, 2007) leading to about 50,000 hospital admissions per year in the USA. In Europe, CO-related deaths represent an annual death rate of 2.24/100,000 population, with males more affected than females. 54.7% of deaths constitute unintentional deaths, and 38.1% constitute intentional deaths (Braubach et al., 2013). In Portugal, CO poisonings are not very common, but it should not be ignored (Hampson and Weaver, 2007; Sá et al., 2011).
CO is a highly toxic gas that exists in atmosphere, which concentration vary from 0.1 parts per million (ppm) in clean atmospheres to 5000 ppm in areas proximal to chimneys (Fawcett et al., 1992).
There are two main sources of CO: external and endogenous. About 60% of external CO comes from human intervention, while the remaining 40% comes from natural sources (Uges, 2011; Varma et al., 2015).
CO has been described as having physiological roles, namely as alleged neurotransmitter (although not completely proven), vasodilatation and platelet aggregation inductor. Being a gas, it does not depend on transporters to enter cells, so it can easily enter in it (Hartsfield, 2002; Snyder and Ferris, 2000; Varma et al., 2015). It also has a role in cardiac function, once it improves cardiac blood supply trough vascular tone relaxation in heart (Grill et al., 2003).
The toxicity of CO is mainly related to its capacity to bind hemoglobin (Hb), leading to the formation of carboxyhemoglobin (COHb) (Nelson and Cox, 2008). Indeed, CO has an approximately 230-270 times greater affinity for Hb than oxygen (O2). Consequently, relatively low levels of CO can have substantial and tragic effects (Nelson and Cox, 2008). In fact, with approximately 15% of COHb mild symptoms are described, such as headache
4
and dizziness; after 40-50% of COHb loss of consciousness and potentially death may occur (Pillay, 2013).
2.
CARBON MONOXYDE PHYSICAL AND CHEMICAL PROPERTIESCO is a diatomic stable gas in atmosphere, tasteless, colorless, odorless and non-corrosive (Varma et al., 2015; Wilbur et al., 2012). It has a molecular weight of 28.01 and it is very inflatable on air, in a wide range of concentrations. Below -191.53ºC CO is a liquid and at temperatures above 70ºC it is insoluble in water (George, 2001). When burned, it produces a blue flame (O'Neil et al., 2006). CO physical-chemical properties are described in Table 1.
Table 1 – Physical and chemical properties of CO (adapted from Varma et al., 2015 and Wilbur et al., 2012).
Property Description
Chemical structure
Physical state Gas
Molecular weight 28.01 Melting point -205 ºC Boiling point -191.53 ºC Density at 25ºC 1.145g/L Solubility: Water, 20ºC 2.3 mL/100 mL Organic solvents
Relatively soluble in ethyl acetate, chloroform and acetic acid
Explosive air limit 12.5-74.2 %
3.
SOURCES OF CARBON MONOXIDE3.1 External sources
CO is formed when there is an incomplete combustion of organic matter. It is produced as main pollutant when fossil fuels and biomass (gas, charcoal, woods, etc) are burned with inadequate supply of oxygen (Smollin and Olson, 2010; Wilbur et al., 2012) Common
5 sources of CO are smoke from exhaustion vehicles, fire smokes and heating systems poorly ventilated and maintained (Uges, 2011). However, approximately 40% of atmospheric CO comes from natural sources, such as natural gas emissions, volcanic eruptions, vegetal and animal degradation and also natural forest fires (Varma et al., 2015). CO can also be formed through the photochemical oxidation of methane and other volatile compounds existent in the atmosphere (Wilbur et al., 2012). The remaining 60% comes from human activities, like consumption of fossil fuels, tobacco smoke and dumps (Jain, 1990; Varma et al., 2015; Vreman et al., 2000).
Higher atmospheric levels of CO are observed in urban areas and also in places where there are permanent emission sources like gas, coal or petrochemical and also refineries (Wilbur et al., 2012). In the northern hemisphere, the average outdoor CO concentrations are about 0.12 ppm and in the southern hemisphere 0.04 ppm, with several changes throughout the year with highest levels verified during the winter (Wilbur et al., 2012).
The development of countries are leading to an increase on migration of rural populations to urban areas, this can lead to an increase in atmospheric CO (Varma et al., 2015). United States Environmental Protection Agency (EPA) set an environmental limit of 10 mg/m3 (9 ppm) of CO in air in not less than 8 hours, a limit that can only be exceeded once a year (Wilbur et al., 2012).
Luckily, atmospheric CO has not exceeded safety level globally or in any specific areas (e.g., Mexico City or Los Angeles), but it is a possibility. Many efforts must be done by the governments worldwide to reduce CO emissions (Varma et al., 2015).
3.2 Endogenous sources
CO can also be generated endogenously. Normal CO levels in plasma is in the range 1% to 5% and may rise up to 7% to 8% in smokers (Pillay, 2013) The greatest endogenous source of CO in healthy individuals is the degradation of heme group from erythrocytes to biliary pigments, catalyzed by heme-oxygenases (HO) (Ryter et al., 2006a; Varma et al., 2015). Tissues that can express HO can contribute to CO production, such as the spleen, liver and reticuloendothelial system, once they are the major location of heme metabolism (Wilbur et al., 2012). The net rate of endogenous CO production has been expected to be about 0.42 mL CO at standard temperature and pressure (Wilbur et al., 2012; Wu and Wang, 2005)
There are three isoforms known of HO: HO-1 (inducible) and HO-2 and HO-3 (both constitutive) (Ryter et al., 2002; Wilbur et al., 2012) Induction of HO-1 raises the production of CO, while inhibition HO expression/activity reduces CO production (Ryter et al., 2006b;
6
Ryter et al., 2002; Wilbur et al., 2012). A small portion (20%) of endogenous CO is generated from other hemoproteins, like myoglobin and other iron-containing proteins (Varma et al., 2015; Vreman et al., 2000). The endogenous-generated CO has been descripted in literature as a molecular chemical signal involved in several cellular functions, as proliferation, apoptosis and inflammation, and also defined as a neurotransmitter of the central nervous system (Lascaratos and Marketos, 1998; Prockop and Chickova, 2007).
4.
PHYSIOLOGICAL ROLES OF COStudies on CO physiological roles are relatively recent and it comes that CO may be on par with oxide nitric (NO) (Varma et al., 2015).
NO and CO have many common properties: both are gases, putative neurotransmitters, cause vasodilatation, increase cyclic guanosine monophosphate (cGMP), inhibit platelet aggregation and are synthesized endogenously, though CO had many exogenous sources (Hartsfield, 2002; Snyder and Ferris, 2000; Varma et al., 2015). As gases, both do not directly depend on plasma membrane transporters to enter cells (Varma et al., 2015). NO increases HO-1 gene expression and consequently CO formation (Hartsfield et al., 1997). Localization of HO-2 (enzyme responsible for releasing CO from COHb), and guanylyl cyclase in isolated brain parts absent in NO, joined with modifications in cGMP by agents and processes that modify CO, has been advanced as proof for a putative neurotransmitter role for CO (Verma et al., 1993). It is an evidence that when CO is released from heme breakdown it can increase cGMP. But, a neurotransmitter must transmit a message across a synapse, so, CO should only be treated as a putative non-proven neurotransmitter (Varma et al., 2015).
In cardiac terms, hypoxia-induced up-regulation of HO-1 in heart increase CO production, leading to an improvement in cardiac blood supply through vascular tone relaxation in heart, constituting a cardiac defense mechanism (Grill et al., 2003)
Regarding to vascular contractility, the process of CO-induced vasodilatation was first described by McGrath and Smith (McGrath and Smith, 1984), who showed that occurs relaxation of rat coronary artery when exposed to exogenous CO. The vasodilatation consequence of endogenous CO was described as inhibition of HO activity with metalloporphyrins either increased perfusion pressure of isolated rat liver (Suematsu et al., 1994) or decreased the diameter of pressurized gracillis muscle arterioles (Kozma et al., 1999; Wu and Wang, 2005).
Studies showed that CO also can inhibit platelet aggregation. Platelet release of adenosine diphosphate (ADP) and serotonin can be inhibited by CO (Mansouri and Perry,
7 1984; Wu and Wang, 2005). The inhibitory effect on platelet aggregation by CO is principally intermediated by activation of cGMP pathway (Wu and Wang, 2005). There is also described that CO improve the production of proinflammatory cytokines and interleukin-10 from monocytes (Otterbein et al., 2000).
5.
EPIDEMIOLOGYCO intoxications are relatively common and death can occur by intentional or unintentional ways (Mayes, 1993; Prockop and Chichkova, 2007), resulting in over 50,000 emergency admissions in USA per year (Hampson and Weaver, 2007). It is documented that CO intoxications are more frequent in females, with ages under 17 and during winter months (November to March). In USA in 2005, 24,891 cases of suspected CO-related hospitalization were reported, but only 17% were confirmed as CO intoxication (Iqbal et al., 2012).
In Europe, it is estimated that hundreds of deaths occur every year by CO inhalation (Braubach et al., 2013). In a study performed between 1980 and 2008, were reported by 28 countries 140,490 deaths related with CO inhalation. The annual death rate associated was 2.24 per 100,000 population (Braubach et al., 2013). In total, CO exposure involved a total of 31,473 hospital admissions, with an average of 342 admissions per year. Males are the more common victims of CO-related deaths. The largest share of mortality is found for the age group of 25-64 years old (63.2%), but data indicate that the population aged 65 years old or older is the most affected (22.3%) (Braubach et al., 2013). Unintentional deaths constitute 54.7% of all the deaths, with 35.9% related with accidental CO exposure. Intentional deaths represent an average of 38.1% of all deaths (Braubach et al., 2013).
In Portugal, the first epidemiological study was performed by Sá and collaborators (Sá et al., 2011). The study was based in the data on CO intoxications admissions between 1st January 2000 and 31st December 2007. 621 admissions at national level were verified, with a significant increase in winter months, as already described in literature (Sá et al., 2011; Wilson et al., 1998). A considerable percentage of accidents occurred with children, which may represent negligence and lack of information from parents and tutors (Sá et al., 2011). Concerning the elderly, there is no report of an increase of this kind of intoxications. Also only 2.1% of intoxications were intentional.
With this study it was possible to conclude that CO intoxications are not a very frequent problem in Portugal, but cannot be overlooked (Sá et al., 2011).
8
6.
TOXICITY MECHANISMSCO toxicity is related with its interaction with Hb. CO is rapidly absorbed by lungs and once in the bloodstream, CO rapidly binds to Hb with an affinity 230 to 270 higher than oxygen. This leads to an inadequate partial pressure of O2 and there is a reduction in arterial oxygen content (Pillay, 2013). When CO binds to Hb, occurs the formation of the complex COHb (Guzman, 2012; Pillay, 2013; Prockop and Chickova, 2007; Varma et al., 2015). Further, CO causes a leftward shift of the oxyhemoglobin (O2Hb) dissociation curve, affecting this way the offloading of O2 from Hb to tissues (Pillay, 2013)
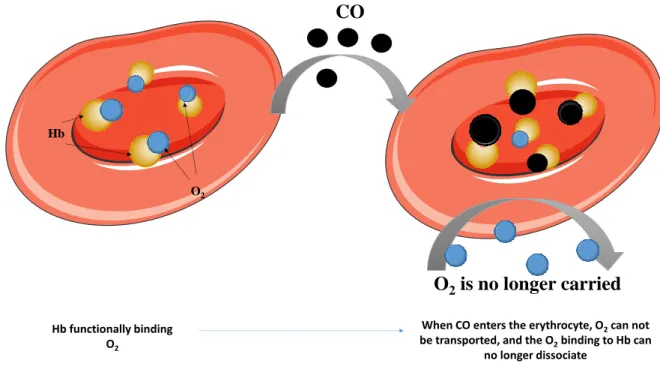
The CO-binding also leads to an allosteric alteration in the Hb molecule (Figure 1), increasing its affinity to oxygen and consequently the O2 molecule cannot be released, compromising its transportation to peripheral tissues (Guzman, 2012; Prockop and Chickova, 2007; Weaver, 2004). This effect is known as Haldane effect (Collier, 1976). The great affinity of CO to Hb also improves the binding of CO to Hb, compromising the binding of oxygen, resulting in a decrease of oxygen in circulation. Furthermore, the dissociation of the complex COHb is very slow (Renwick and Walton, 2001; Varma et al., 2015). Both mechanisms lead to a decrease of oxygen availability and consequently to hypoxia (Guzman, 2012).
Figure 1: Effect of CO in O2 binding: when CO enters the erythrocyte, besides the fact that it blocks O2 binding to Hb, it also causes an allosteric alteration in Hb, which cannot dissociate O2. This leads to a compromise in O2 transportation to peripheral tissues, leading to a hypoxic situation.
O
2is no longer carried
CO
Hb O2 Hb functionally binding O2When CO enters the erythrocyte, O2can not
be transported, and the O2binding to Hb can
9 CO can still bind to other heme-containing proteins than Hb, whose function may be modified by the presence of CO, such as cytochrome c oxidase (Figure 2), impairing metabolism and mitochondrial respiration, myoglobin and neuroglobin, interfering in O2 storage and utilization in muscle and brain, and platelet hemoproteins (Alonso et al., 2003; Bauer and Pannen, 2009; Guzman, 2012; Kao and Nanagas, 2006; Miro et al., 2000; Omaye, 2002; Wilbur et al., 2012). CO can also interfere in NO cell signaling pathway, cellular redox balance and reactive oxygen species, steroid and drug metabolism (cytochrome P450) and prostaglandin cell signaling pathway (Wilbur et al., 2012)
Figure 2: Effect of CO in cytochrome c oxidase. Electron transference from cytochrome c oxidase to O2 is blocked, leading to a breakdown of O2 supply, aggravating the hypoxia.
7.
SIGNS AND SYMPTOMS AFTER POISONINGThe main symptoms that occur in a CO acute exposure are described in Table 2. The principal mechanism of toxicity caused by CO exposure is tissue hypoxia, so tissues with higher demand for O2 are the most vulnerable, like brain or heart (Bauer and Pannen, 2009; Chavouzis and Pneumatikos, 2014; Wilbur et al., 2012).
CO intoxications are usually categorized in: mild, moderate and severe. Signs and symptoms in a mild intoxication include nausea, dizziness, vision disturbances, headache, dilatation of cutaneous musculature and occasionally cherry lips and skin (Wilbur et al., 2012). In a moderate CO intoxication confusion, chest pain, tachycardia, weakness, dyspnea may appear (Wilbur et al., 2012). In a severe CO intoxication symptoms include hypotension, cardiac and respiratory arrest, seizures, coma and possible death (Wilbur et al., 2012).
However, the effects of CO are not confined to the exact period after exposure and cases of delayed-onset and persistent neurological impairs have been reported. This
Cytochrome c Oxidase IV 2 H+ O2 2e- 2e-H2O
CO
10
development may take place from some days to about 3-4 weeks after exposure (Choi, 1983; Garland and Pearce, 1967; Kao and Nañagas, 2004; Lee and Marsden, 1994; Min, 1986; Myers et al., 1985; Thom and Keim, 1989; Wilbur et al., 2012). Additionally, it was described a syndrome of apparent recovery from an acute CO poisoning followed by a neurological and behavioral worsening after a latency period of 2 to 40 days, with symptoms transversal to almost any kind of neurological/psychiatric impair, as memory loss, seizures, hallucinations, psychosis and motor disturbances (Choi, 1983; Garland and Pearce, 1967; Kao and Nañagas, 2004; Lee and Marsden, 1994; Min, 1986; Myers et al., 1985; Thom and Keim, 1989). In the majority of the cases, long-term prognosis is good and symptoms have tendency to be progressively resolved (Chiew and Buckley, 2014).
In order to identify long-term neurological damages due to CO exposure, neurological injuries or loss of consciousness must be considered, although other means of identification of these symptoms in individuals may be required, once it can be difficult to know if there is history of loss of consciousness (Chiew and Buckley, 2014).
With this idea of identification of long-term neurological impairs, prediction tools have been studied, like the new calcium-binding protein (S100B) present in astrocytes, which is released after hypoxic injury as consequence of neuronal and astrocyte cell death (Chiew and Buckley, 2014). In a study performed in Taiwan by Park and collaborators (Park et al., 2012), 71 patients were involved and 10 of those patients developed delayed neurological impair. The study showed that those patients with neurological impair showed longer loss of consciousness and higher levels of S100B, being this protein a useful tool when it comes to evaluate a CO poisoning (Park et al., 2012).
Table 2 – Principal signs and symptoms in acute CO intoxications (based in Nelson and Cox, 2008).
% COHb Principal symptoms
<10% Not observed
~15% Mild headaches
20-30% Severe headaches, nausea, dizziness, visual disturbances
30-50% Severe neurological alterations
50%-60% Loss of consciousness, coma
11
8.
FORENSIC RELATED ASPECTS8.1 Autoptic findings
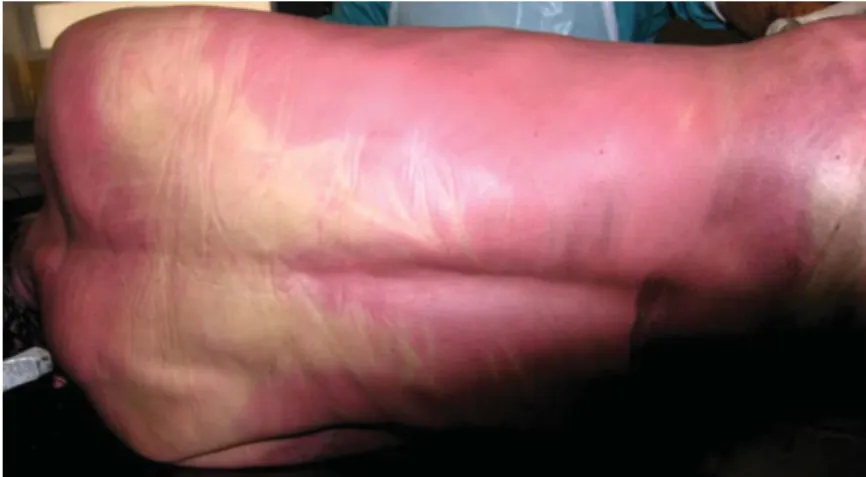
Autopsy findings in CO deaths are characteristic and may have an important role to determine the cause of death (Dinis-Oliveira et al., 2010b). Figure 3 shows the cherry-red or bright-pink colour of body lividity as the consequence of COHb formation, although similar lividity could develop in case of a cyanide poisoning (Dinis-Oliveira et al., 2010b).
Figure 3: Lividity of cherry-red/bright-pink color in a Caucasian individual, as consequence of COHb formation (reproduced from Dinis-Oliveira et al, 2010, with permission).
8.2 Collection and sample preservation
Sample collection and preservation has an important role in forensic cases (Negrusz and Cooper, 2013). A mandatory first step that must be done in sample collection is to ensure that containers are correctly labelled to eliminate any doubt about the sample origin (Moffat et al., 2011). After collection, specimens must be stored in sealed and well filled containers at -4ºC for short-term storage and -20ºC (or -80ºC) for long term storage (more than a week) (Dinis-Oliveira and Magalhães, 2013). All samples must be accessible only to authorized staff. All this it is done to assuring the security and integrity of samples, insuring the possibility of a future use (Negrusz and Cooper, 2013). In other words, chain of custody should be accomplished.
Preservatives are not usually necessary in specimens other than blood and it is recommended to keep an unpreserved sample as well as a preserved blood (Skoop, 2004). The preservatives mostly used are sodium fluoride (NaF) or potassium fluoride (KF). NaF is mainly used and a final concentration of 1-5% by weight is recommended (Dinis-Oliveira et al., 2010a; Negrusz and Cooper, 2013; Prouty and Anderson, 1987).
12
Fluoride preservation is mainly added to inhibit microorganism mediated conversion of glucose to ethanol and microorganism mediated oxidation of ethanol, conversion of cocaine to ecgonine methyl ester by pseudocholinesterases, enzymatic loss of others esters such as 6-acetylmorphine, GHB production in stored samples, among others (Dinis-Oliveira et al., 2010a).
It is also important to properly maintain a chain of custody, to insure that the sample/evidence has remained intact, and not been adulterated, changed or misplaced in any way that could compromise its integrity (Dinis-Oliveira and Magalhães, 2013)
9.
ANALYTICAL METHODS USED FOR CO/%COHb DETERMINATIONThe analysis of CO in blood has been of great interest for many years and various techniques have been used (Boumba and Vougiouklakis, 2005; Widdop, 2002). The classical methods used for CO analysis are summarized in Table 3.
Table 3 – Classical methods used for CO determination (adapted from Widdop, 2001).
Methods Description
Volumetric
(Horvath and Roughton, 1942; Nicholas, 1951)
This technique was first described by Van Slyke and collaborators (Slyke et al., 1923) and it became known as Van Slyke blood gas
apparatus. A blood sample is put in a chamber with buffer and
sodium dithionite. Nitrogen and oxygen are released in the chamber - oxygen is reduced (by sodium dithionite) and nitrogen is expelled. CO and CO2 are released with ferricyanide. CO2 is absorbed with sodium hydroxide and the residual volume of CO is measured (Feldstein, 1967; Slyke et al., 1923); it is very time consuming and there is the need of a specific apparatus.
Colorimetric (Feldstein, 1967)
This method uses an alkaline solution of the silver salt of p-sulphaminobenzoic acid and CO reacts with it, forming a silver colloidal solution. The absorbance of this solution is proportional to CO concentration in the sample.
Simple comparative color test
(Maehly, 1962; Widdop, 2002)
This method is based in direct visual comparison; blood from CO poisoning victims has a cherry-red color, although a normal color does not excludes poisoning; it can be compared a blood sample diluted with ammonia and normal blood treated the same way: a pink hint opposed to the straw of normal blood suggests that COHb
13 is present; It is a very simple method, but has very poor accuracy and cyanide poisonings give the same results.
Microdiffusion in Conway cell
(Feldstein and Klendshoj, 1957)
This method uses a Conway cell (“petri” dish with an inner and outer well); a blood sample is placed in the outer well, the acid sulfuric is put in contact with blood and makes release CO, which reacts with a solution of palladium chloride in the inner well; although it is inexpensive and can work as a rapid semi quantitative test, it requires skill to place the components correctly in the wells.
Hartridge reversion spectroscope
(Hartridge, 1922)
A simple device allows to observe directly COHb and oxyhemoglobin absorption bands in a sample of diluted blood; this device is currently obsolete.
CO: carbon monoxide; CO2: carbon dioxide; COHb: carboxyhemoglobin
The most popular and widely used techniques are spectrophotometric and chromatographic methods with variable detection systems (Boumba and Vougiouklakis, 2005).
Spectrophotometric methods are among the most frequently used techniques for CO quantification in blood (Boumba and Vougiouklakis, 2005). It is based in the comparison of the absorbance spectra of COHb with that of oxyhemoglobin and/or reduced hemoglobin (Widdop, 2002). There are two dominant spectrophotometric methods used for CO quantification:
a) Manual two-wavelength method using simple spectrophotometers
Different hemoglobin derivatives (reduced (HHb), O2Hb, methemoglobin (MetHb), etc) absorb at different wavelengths. The blood sample is converted into a two-component system (COHb/HHb, usually) and analyzed at two different selected wavelengths, usually 420 and 432 nm. Both O2Hb and MetHb are reduced, whereas COHb is not. This is an easy, rapid and simple method, but requires a reduction step (with sodium dithionite); main disadvantages are also the lack of precision and accuracy, as well as specificity for COHb. (Katsumata et al., 1982; Moffat, 1986; Zwart et al., 1981).
b) Automated multi-wavelength using specialized spectrophotometers called
CO-oximeters
This method provides differential spectrophotometric measures on hemolyzed blood samples. It can measure total Hb, COHb and other forms of Hb simultaneously. It requires
14
little sample preparation, has good precision and can do simultaneous reading within a minute. However at low levels of COHb the accuracy is limited. (Brehmer and Iten, 2003; Brown, 1980; Brunelle et al., 1996; Dennis and Valeri, 1980; Lee et al., 2003; Mahoney et al., 1993; Zwart et al., 1981). Because CO-oximeters are highly automated, they not offer the ability of adaptation of wavelengths to particular values suitable for each sample, an ability that manual spectrophotometric method could offer (Boumba and Vougiouklakis, 2005; Zwart et al., 1984)
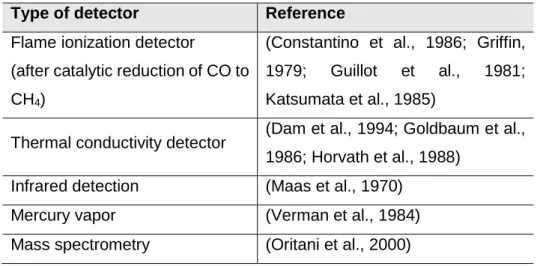
Gas-chromatographic (GC) methods are considered more sensitive and accurate than spectrophotometric ones (Widdop, 2002). Blood samples are usually subjected to lysis of erythrocytes and followed by the release of the CO bound to Hb, achieved usually by acidification. The quantity of CO found is related with the hemoglobin content of the sample (Boumba and Vougiouklakis, 2005; Verman et al., 1984; Widdop, 2002). Sulfuric and hydrochloric acids and potassium ferricyanide are the most used liberating agents. When used in combination with hemolytic agents, such as detergents and saponin, these agents provoke the fragmentation of the red cell membrane with liberation of the possible CO bound to Hb (Boumba and Vougiouklakis, 2005; Widdop, 2002). The CO released is subsequently directed to the reactor headspace, where the headspace gas is analysed by GC, with aim to separate from other gases (Boumba and Vougiouklakis, 2005). There are many different types of detection used in GC, specified in Table 4. Other methods have been described but they are not routinely used (Table 5).
Table 4 – Types of detectors used in GC methods (based in Boumba and Vougiouklakis, 2005).
Type of detector Reference
Flame ionization detector
(after catalytic reduction of CO to CH4)
(Constantino et al., 1986; Griffin, 1979; Guillot et al., 1981; Katsumata et al., 1985)
Thermal conductivity detector (Dam et al., 1994; Goldbaum et al., 1986; Horvath et al., 1988)
Infrared detection (Maas et al., 1970)
Mercury vapor (Verman et al., 1984)
Mass spectrometry (Oritani et al., 2000) CO: carbon monoxide; CH4: methane
15 Table 5 – Other methods used for COHb analysis (adapted from Widdop, 2001 and Boumba and Vougiouklakis, 2005).
Method Principle Applications
Fourier transform infrared spectrophotometry (Kijewski et al., 1985) Measurement of absorbance at characteristic bands Analysis of dried blood samples Differential protein precipitation
(Whitehead and Worthington, 1961; Wolff, 1947) Oxyhemoglobin heat precipitation at pH 5 Clinical analysis of CO poisoning Derivative spectroscopy
(Fukui et al., 1985; Fukui et al., 1984; Panzali et al., 1987; Parks and Worth, 1985) A derivative spectrometry is used to eliminate non-specific interferences Mainly forensic investigations
CO: carbon monoxide
The main advantages and disadvantages of spectrophotometric and GC methods are described in Table 6, as they are the most used worldwide.
Overall, the selection of the technique to quantify CO should be done carefully, taking into account the goal of analysis and all the conditions, such as quality/quantity/number of samples available, accuracy needed for the analysis and instrumentation available in the lab.
Table 6 – Comparison between spectrophotometric and GC methods (adapted Boumba and Vougiouklakis, 2005).
Method Advantages Disadvantages
Spectrophotometric
Little sample preparation Short analysis time Relatively low cost Ease and speed of operation (could be used in emergency
situations)
Errors due to interferences Not very accurate at
COHb (< 5%) Requires the use of fresh
blood
GC
Highly specificity for CO Not affected by interferences
Very small samples volume High accuracy
Considerable sample preparation Long-time analysis
16
Too demanding to routine/emergency
quantifications
CO: carbon monoxide; COHb: carboxyhemoglobin; GC: gas chromatography
For the present work it was chosen a spectrophotometric manual double-wavelength (420 and 432 nm) method.
17
Objectives
19
10.
OBJECTIVESCO is a highly toxic, colorless, tasteless and odorless gas. CO toxicity is mainly related with its interaction with Hb forming COHb leading to a compromise of oxygen transportation to peripheral tissues.
Quantification of COHb levels is an important procedure to confirm exposure to CO either in antemortem or postmortem cases, therefore a validation of a simple, accurate and precise method for COHb analysis is necessary. GC analysis is quite demanding, it requires long time analysis, and cannot be used in emergency situations, so in this study we decided for a spectrophotometric method due to the ease and speed of preparation. Additionally there aren’t enough studies of this method reported in the literature.
During the improvement of the method, also was evaluated the stability of COHb in whole blood samples, to infer on how long the samples can be kept and used, leading to reliable results. There are several studies of COHb stability in literature, but there is not a comparison between blood samples with and without preservative for long periods of time, at three different temperatures.
With this work, we aim to validate a spectrophotometric method for the %COHb quantification and to test the stability of %COHb in blood samples containing anticoagulant (ethylenediaminetetraacetic acid (EDTA)), with and without NaF 2.5%, stored at different temperatures: room temperature (RT), 4ºC and -20ºC, for a period of 6 months.
21
Material and methods
23
11.
MATERIAL AND METHODS11.1 Reagents and standards
Monopotassium phosphate (KH2PO4) and dipotassium phosphate (K2HPO4) were obtained from Merck™ (Darmstad, Germany). Sodium dithionite and NaF were obtained from Sigma-Aldrich™ (St. Louis, MO). Both oxygen and monoxide pump were obtained from Praxair (Madrid, Spain). Nitrogen pump was obtained from Air Liquid™. All the reagents used were of analytical grade or from the highest available grade. The equipment used was a Biotek Synergy™ microplate reader.
11.2 Collection of blood samples
Blood samples used in the method validation and stability study were collected voluntary prior to use (samples used in stability study were collected only once) from the same healthy, non-smoker, female individual. The collection was made in 4 mL tubes containing EDTA, provided by Green Vac-Tube™.
11.3 Preparation of working solutions
Buffer solution was prepared by dissolving 13.6g of KH2PO4 and 17.4g of K2HPO4 in 1000 mL of distilled water. The pH was adjusted to 6.85 with a sodium hydroxide (NaOH) 10N solution. Hemolytic solution was prepared by a 10-fold dilution of the buffer. Reducing solution was prepared always prior to use by mixing 0.0625g of sodium dithionite in 50 mL of buffer solution.
11.4 Preparation of standards for calculation of factors F1, F2 and F3 and calculation of %COHb
For the standards preparation, two blood pools were prepared: one of 100% O2Hb and other of 100% COHb. For this, 50 µL of blood were added to 6 mL of hemolytic solution and left for 10 minutes at RT to ensure total hemolysis. One pool was bubbled with ultrapure O2 for 20 minutes and the other pool with CO for 2 minutes. After this bubbling, both pools were
24
bubbled with nitrogen for 2 minutes to remove any O2/CO undissolved. Then, 200 µL of these solutions were transferred to other tubes containing 2.3 mL of reducing solution and left for 10 min to ensure complete reduction. Absorbance (Abs) readings were made at 420 and 432 nm as previously recommended (Beutler and West, 1984; Luchini et al., 2009). Factors were calculated as following:
F1 = Abs432O2Hb Abs420O2Hb F2 = Abs432COHb Abs420O2Hb F3 = Abs420COHb Abs420O2Hb
The %COHb in method validation and stability study was calculated based on the following formula: %𝐂𝐎𝐇𝐛 = 1 −AbsAbs420 432× F1 Abs420 Abs432 (F2 − F1) − F3 + 1 × 100
These formulas were deducted by Beutler and West (Beutler and West, 1984). In general, because each factor equal the ratio of two molar absorptivities, the Hb concentration in the factors cancel each other out when the same Hb solution is converted completely to either reduced Hb or COHb (Beutler and West, 1984; Luchini et al., 2009).
11.5 Method validation
A full method validation should be performed for any analytical method whether new or based upon literature (Peters and Maurer, 2002). Analytical method validation is a mandatory step to evaluate the ability of developed methods to provide accurate results during routine application. The validation of the method was performed accordingly to the European Medicines Agency guidelines (European Medicines Agency, 2011).
The linearity, limit of detection (LOD), limit of quantification (LOQ), precision and accuracy of the method were determined. In order to obtain these validation data, calibration curves were prepared by mixing appropriated volumes of hemolisated blood with CO or O2.
25 11.5.1 Linearity
The response of the instrument with regard to the concentration of analyte should be known, and should be evaluated over a specific concentration range. The calibration standards should be prepared in the same matrix as the matrix of the intended study samples by spiking the blank matrix with known concentrations of the analyte. There should be one calibration curve for each analyte studied in the method validation and for each analytical run (European Medicines Agency, 2011). The method linearity was determined by evaluation of the regression curve (Abs at 420 and 432 nm versus analyte concentration) and expressed by the determination coefficient (r2) using spiked samples. Three
independent calibration curves were obtained using 6 different concentrations of CO (0%, 10%, 30%, 50%, 80% and 100%). In addition, a blank sample (processed matrix sample without analyte) was prepared. These concentrations were prepared daily as mentioned before. Linearity was accepted if r2≥ 0.98.
11.5.2 Limit of detection and limit of quantification
The LOD is the lowest concentration of analyte in a sample that can be distinguished from the blank (noise of the system). The LOQ is the lowest concentration of analyte in a sample which can be quantified reliably, with an acceptable accuracy (bias) and precision. LOD and LOQ were determined as following:
blank blank y S LOD 3 and blank blank y S
LOQ 10 ,where σ is the standard deviation of the absorbance and S the
signal of the blank sample. For LOQ a coefficient of variation (%CV) ≤ 20% for precision was accepted.
11.5.3 Precision and accuracy
The precision of an analytical method describes the closeness of repeated individual measures of analyte of the same homogenous sample under the same conditions and may be considered at three levels: repeatability (also referred as within-run or within-day or intraday precision), intermediate precision and reproducibility (expresses the precision between laboratories and only has to be studied, if a method is supposed to be used in different laboratories).
Precision is expressed as the %CV. Intraday precision data was quantified by analysing the 3 replicates of three concentrations (low: 2%, medium: 30% and high: 90%) and
26
calculating the %CV. Absorbances of the same 3 concentrations, measured in 3 consecutive days, were used to calculate the interday repeatability (%CV). A %CV value of ≤15% for interday and intraday analysis was considered satisfactory.
The accuracy of a method is affected by systematic (bias) as well as random (precision) error components. The accuracy of an analytical method describes the closeness of the determined value obtained by the method to the true concentration of the analytes (expressed in percentage). The intraday and interday accuracy of the method were evaluated by spiking blank matrix with three different carbon monoxide concentrations (low: 2%, medium: 30% and high: 90%) and through the calculation of the deviation percentage between the calculated value and the nominal [Accuracy (%) = (experimental concentration/theoretical concentration) × 100]. A deviation percentage of ≤15% was considered satisfactory.
11.6 Stability study
The method used in stability study was based on the work of Luchini and collaborators (Luchini et al., 2009).
All blood samples were collected in tubes with EDTA as anticoagulant and stored at different conditions. Two concentrations were considered to simulate a:
a) Fatal intoxication - since postmortem blood does not coagulate in the exact
moment of death due to the existence of fibrinolysins that maintain postmortem blood fluid for a period of time after death, an anticoagulant was added to samples (Luchini et al., 2009; Mole, 1948; Mullertz, 1972);
b) Non-fatal intoxication - blood was prepared in order to mimic a non-fatal CO
poisoning, and also stored at different conditions.
To mimic a fatal intoxication, 2 mL of blood with anticoagulant were bubbled with CO for 40 seconds and then added NaF, while the blood used to mimic the non-fatal intoxication did not have NaF and was bubbled with CO for 10 seconds. Both samples were bubbled with nitrogen for 2 minutes to remove any CO unbounded to Hb.
In order to have a first value for comparison, 50 µL of blood of each pool were added to 6 mL of hemolytic solution and left for 10 minutes at RT to ensure total hemolysis. Then, 200 µL of these solutions were transferred to other tubes containing 2.3 mL of reducing solution and left for 10 min to ensure complete reduction. 150 µL of these solutions were placed in the wells of a microplate and absorbance readings were made at 420 and 432 nm. Reanalysis were performed in the same way.
27 Each pool was posteriorly divided in three aliquots of 2 mL each and stored at different temperatures: RT, -20ºC and 4ºC.
29
Results and discussion
31
12.
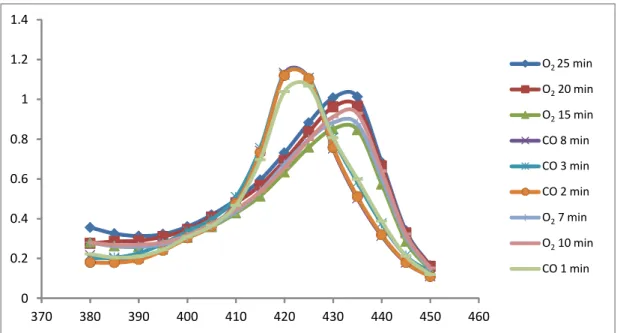
RESULTS AND DISCUSSION12.1 Preparation of calibrators at 100% O2Hb and COHb samples – bubbling times
In order to infer about the time necessary to obtain saturated solutions with O2 and CO, a series of tests were performed, by bubbling solutions at different times and observe when the maximum was reached. Figure 4 shows the results obtain.
Figure 4 – Preparation of solutions of COHb and O2Hb at 100%.
By observation of the graphic, by bubbling a solution for 20 minutes with O2 the maximum of intensity is achieved at 432 nm. By bubbling a solution for 2 minutes with CO it is obtained a maximum at 420 nm, so the solution is saturated. These 100% concentrated O2Hb and COHb were then used to calculate F1, F2 and F3 factors.
12.2 Calculated factors
Calculated F1, F2 and F3 factors for method validation and stability studies are presented in Table 7. 0 0.2 0.4 0.6 0.8 1 1.2 1.4 370 380 390 400 410 420 430 440 450 460 O2 25 min O220 min O215 min CO 8 min CO 3 min CO 2 min O27 min O210 min CO 1 min
32
Table 7 – Calculated factors in method validation and stability study.
Factors Method Validation Stability study Samples with anticoagulant Samples with anticoagulant and NaF F1 1.19 1.178 0.453 F2 0.52 0.7316 0.7320 F3 1.70 1.501 0.623 12.3 Method validation 12.3.1 Linearity
The weighted least squares linear regression equations and coefficients of determination were calculated using three independent curves. Results are presented as mean ± standard deviation and y and x represent the relationship between the %COHb and the corresponding absorbance readings. The determination coefficients were 0.9959 for 420 nm and 0.9831 for 432 nm over the concentration range, confirming the linearity of the method (Figure 5).
Figure 5 – Linearity study for n=3.
y = 0.0017x + 0.248 R² = 0.9959 y = -0.0017x + 0.2905 R² = 0.9831 0.000 0.050 0.100 0.150 0.200 0.250 0.300 0.350 0.400 0.450 0 20 40 60 80 100 Abso rb an ce %COHb Abs 420 Abs 432
33 12.3.2 Limit of Detection and Limit of Quantification
LOD and LOQ values ranged from 0.9-1.4%. Luchini and collaborators ((Luchini et al., 2009) in their work obtained a LOQ of 0.1%. In the work of Cronenberg and collaborators, was obtained a LOQ of 0.3% (Cronenberger et al., 2007). Hao and collaborators obtained a LOQ of 0.2% in their work (Hao et al., 2013).
12.3.3 Precision, accuracy and recovery
Precision, accuracy and recovery results are presented in Table 8. As the %CV calculated for intra- and inter-day precision studies did not exceed 15%, the developed method was considered precise for the analyte. Accuracies were evaluated using the percentage of recoveries. Accuracies in the range of 86.1-117.3% for %COHb were obtained, which are within the proposed acceptance limits for this parameter (100 ± 20%) (European Medicines Agency, 2011).
Table 8 – Results from precision and accuracy.
Analyte Concentration (%) Intra-day precision (%, n=3) Inter-day precision (%, n=3) Accuracy (%, n=3) CO 2 2.17 2.24 98.3 30 1.55 1.02 116.6 90 2.45 2.56 97.5 12.4 Stability study
In our study we attempted to evaluate the stability of the %COHb typically obtained in fatal and non-fatal intoxications. For non-fatal intoxication the initial value for posterior comparison was 27.4%. Table 9 shows the results obtained in all analysis and Figure 6 shows the behavior of %COHb throughout time.
34
Table 9 Stability of %COHb (nonfatal intoxication) at three different temperatures (RT, -20ºC and 4ºC.) Temperature (ºC) Time (days) 0 7 19 41 181 188 RT 27.4 23.8 32.4 24.8 7.1 6.4 -20 25.6 28.7 26.8 25.8 25.0 4 24.1 28.7 25.0 27.4 26.9
Figure 6: Evolution of %COHb throughout storage time for non-fatal intoxication sample.
At RT, %COHb suffers quite alterations throughout time, decreasing until 6.4 % after the 6 months of the study. Noteworthy that besides being at RT these samples did not had NaF, so that could influence this decrease. Also, it is referred in literature that in samples with relatively low %COHb, concentration could decrease with time (Kunsman et al., 2000). Comparing all values, from day 1 to day 180, with the initial value (27.4%), the %COHb did not suffer alterations up to 6 months when stored at -20ºC.
27.4 23.9 32.4 24.8 7.1 6.4 25,7 28.7 26.8 25.8 25.0 22.2 28.7 25.0 27.4 26.9 0 10 20 30 40 % COHb Time (days) RT -20ºC 4ºC 0 7 19 41 181 188
35 At 4ºC, the behavior of %COHb is quite similar to that obtained at -20ºC – no oscillations occur during the time of study. This suggests that RT is not a suitable temperature for blood samples suspicious of containing CO so low temperatures, namely below 4ºC, must be used as a storage temperature.
For fatal intoxications initial value obtained for posterior comparison was 76.2%. Table 10 shows the results obtained in all analysis and figure 7 shows the behavior of %COHb throughout time.
Table 10 – Stability of %COHb (fatal intoxication) at three different temperatures (RT, -20ºC and 4ºC. Temperature (ºC) Time (days) 0 7 19 41 181 188 RT 76.2 72.7 75.6 82.3 98.3 97.4 -20 76.6 74.4 77.1 77.9 77.1 4 79.2 75.3 78.8 77.7 77.0
Figure 7: Evolution of %COHb throughout storage time for fatal intoxication sample.
At RT, between day 0 (76.2%) and day 7 (72.7%) the difference was 3.5 %. Until day 41, all the concentrations practically did not suffer alterations. From day 181 it was found a difference up to 22.1%, already descript in literature as a normal behavior of COHb when %COHb > 70-80% (Kunsman et al., 2000). RT storage may influence this increase.
76.2 72.7 75.6 82.3 98.3 97.4 76.6 74.4 77.1 77.9 77.1 79.2 75.3 78.8 77.7 77.0 70 80 90 100 % COHb Time (days) RT -20ºC 4ºC 0 7 19 41 181 188
36
At -20ºC, comparing all values to the initial one (76.2%) it is visible that no alterations occur in %COHb throughout time. -20ºC appears to be a better storage temperature than RT when it comes to blood samples containing CO.
At 4ºC the behavior of %COHb throughout time is similar to that at -20ºC – no changes occur during the 6 months of study.
When it comes to store blood samples suspicious of containing CO, low temperatures must be used, namely below 4ºC. Other studies performed led to similar results. Kunsman
et al. (Kunsman et al., 2000) compared the stability of CO in postmortem blood samples
collected in grey-top vacutainer tubes with and without NaF (the authors did not specified NaF concentration in the referred tubes) and stored at 3ºC during two years. In their study the addition of preservative did not significantly affect the %COHb and they conclude that no significant changes occurred. Hampson (Hampson, 2008) also tested the stability of COHb and showed that no significant changes occurred in %COHb in blood samples with heparin and without NaF, with COHb levels remaining stable during the time of the study (four weeks) with or without refrigeration at 4ºC or RT.
37
Conclusions
39
13.
CONCLUSIONSA method for evaluation of %COHb in blood was validated by spectrophotometry UV/Vis. Linearity was verified in a concentration range from 0-100% of COHb, with r2 ≥ 0.98. The method has shown to be precise and accurate with a LOD and LOQ varying from 0.9-1.4%.
In the stability study, the %COHb suffered no variation throughout time (6 months) at -20°C and 4ºC, either for samples with and without NaF. RT is not a recommended storage temperature for blood samples containing CO. NaF seems not to have any relevance in the stability of CO in blood samples.
41
Future perspectives
43
14.
FUTURE PERSPECTIVESIn order to further analyze CO stability more conditions should be study, namely different initial concentrations of CO in blood, different concentrations of NaF added to blood and study other temperatures of storage, to prove if CO is stable in other conditions than those evaluated in this work.
Also a comparison between methods (e.g., spectrophotometry versus gas-chromatography) could be made in order to compare the precision and accuracy of each and infer which one is the more suitable for CO analysis.
45
References
47
15.
REFERENCESAlonso J, Cardellach F, Lopez S, Casademont J and Miró O (2003) Carbon monoxide specifically inhibits cytochrome c oxidase of human mithocondrial respiratory chain. Pharmacol Toxicol 93(3):487-490.
Bauer I and Pannen B (2009) Bench-to-side review: Carbon monoxide-from mitochondrial poisoning to therapeutic use. Crit Care 13(4):220.
Beutler E and West C (1984) Simplified determination of carboxyhemoglobin. Clin Chem 30:871-874.
Boumba VA and Vougiouklakis T (2005) Evaluation of methods used for carboxyhemoglobin analysis in postmortem blood. Int J Toxicol 24:275-281.
Braubach M, Algoet A, Beaton M, Lauriou S, Héroux M and Krzyzanowski M (2013) Mortality associated with exposure to carbon monoxide in WHO European Member States. Indoor
air 23:115-125.
Brehmer C and Iten P (2003) Rapid determination of carboxyhemoglobin in blood by oximeter.
Forensic Sci Int 133:179-181.
Brown L (1980) A new instrument for the simultaneous measurement of total hemoglobin, % oxyhemoglobin, % carboxyhemoglobin, & methemoglobin and oxygen content in whole blood. IEEE Trans Biomed Eng 27:132-138.
Brunelle J, Degtiarov A, Moran R and Race L (1996) Simultaneous measurement of total hemoglobin and its derivatives in blood using CO-oximeters: Analytical principles; their application in slecting analytical wavelengths and reference methods; a comparison of the results of the choices made. Scand J Clin Lab Invest 224:47-69.
Chavouzis N and Pneumatikos I (2014) Carbon monoxide inhalation poisoning. Pneumon 27:21-24. Chiew A and Buckley N (2014) Carbon monoxide poisoning in the 21st century. Crit Care 18:221. Choi I (1983) Delayed neurological sequelae in carbon monoxide intoxication. Arch Neurol
40:433-435.
Collier C (1976) Oxygen affinity of human blood in presence of carbon monoxide. J Appl Physiol 40(3):487-490.
Constantino A, Park J and Caplan Y (1986) Carbon monoxide analysis: A comparison of two CO-oximeters and head space gas chromatography. J Anal Toxicol 10:190-193.
Cronenberger C, Mould DR, Roethig H-J and Sarkar M (2007) Population pharmacokinetic analysis of carboxyhaemoglobin concentrations in adult cigarette smokers. Br Journal Clin
Pharmacol 65:1:30-39.
Dam JV, Pharm D and Daenes P (1994) Microanalysis of carbon monoxide in blood by head-space cappilary gas-chromatography. J Forensic Sci 39:473-478.
Dennis R and Valeri C (1980) Measuring oercent oxygen saturation of hemoglobin, percent carboxyhemoglobin and concentrations of total hemoglobin and oxygen in blood of man, dog and baboon. Clin Chem 26:1304-1308.
Dinis-Oliveira R, Carvalho F, Duarte J, Remião F, Marques A, Santos A and Magalhães T (2010a) Collection of biological samples in forensic toxicology. Toxicol Mech Methods 20 (7):363-414.
Dinis-Oliveira R, Magalhães T and Carvalho F (2013) A perícia em toxicologia forense: da suspeita à interpretação dos resultados. , in A ciência ao serviço da justiça (F P ed) pp 159-185, Lidel, Edições Técnicas LDA, Lisbon.
Dinis-Oliveira RJ, Carvalho F, Magalhães T and Santos A (2010b) Postmortem changes in carbon monoxide poisoning. Clin Toxicol 48:762-763.
Dinis-Oliveira RJ and Magalhães T (2013) Forensic toxicology in drug-facilated sexual assault. Toxicol
Mech Methods 23 (7):471-478.