Licence Creative Commom CC
RBCDH
1 Universidade do Estado de Santa Catarina. Centro de Ciências da Saúde e do Esporte. Laboratório de Pesquisa em Desempenho Humano. Florianópolis, SC. Brasil.
Received: 18 August 2014 Accepted: 10 November 2014
The highest velocity and the shortest duration
permitting attainment of VO
2
max during
running
A maior velocidade e o menor tempo de exercício em que
o VO
2max é alcançado na corrida
Tiago Turnes1
Rafael Alves de Aguiar1
Rogério Santos de Oliveira Cruz1
Felipe Domingos Lisbôa1
Amadeo Félix Salvador1
João Antônio Gesser Raimundo1
Kayo Leonardo Pereira1
Fabrizio Caputo1
Abstract – he severe-intensity domain has important applications for the prescription of running training and the elaboration of experimental designs. he objectives of this study were: 1) to investigate the validity of a previously proposed model to estimate the shortest exercise duration (TLOW) and the highest velocity (VHIGH) at which VO2max is reached during running, and 2) to evaluate the efects of aerobic training status on these variables. Eight runners and eight physically active subjects performed several treadmill running exercise tests to exhaustion in order to mathematically estimate and to experimentally determine TLOW and VHIGH. he relationship between the time to achieve VO2max and time to exhaustion (Tlim) was used to estimate TLOW. VHIGH was estimated using the critical velocity model. VHIGH was assumed to be the highest velocity at which VO2 was equal to or higher than the average VO2max minus one standard deviation. TLOW was deined as Tlim associated with VHIGH. Runners presented better aerobic itness and higher VHIGH (22.2 ± 1.9 km.h-1) than active subjects (20.0 ± 2.1 km.h-1). However, T
LOW did not difer between groups (runners: 101 ± 39 s; active subjects: 100 ± 35 s). TLOW and VHIGH were not well estimated by the model proposed, with high coeicients of variation (> 6%) and a low correlation coeicient (r<0.70), a fact reducing the validity of the model. It was con-cluded that aerobic training status positively afected only VHIGH. Furthermore, the model proposed presented low validity to estimate the upper boundary of the severe-intensity domain (i.e., VHIGH), irrespective of the subjects’ training status.
Key words: Oxygen uptake; Physical education and training; Physical itness; Running; Exercise.
Resumo– O domínio severo tem importantes aplicações para a prescrição do treina-mento de corrida e elaboração de delineatreina-mentos experimentais. O estudo teve como objetivos: 1) investigar a validade de um modelo proposto previamente para estimativa do menor tempo de exercício (TINF) e maior velocidade (VSUP) em que o VO2max é alcan-çado na corrida; e 2) comparar os efeitos do estado de treinamento nestes parâmetros. Oito corredores e oito indivíduos isicamente ativos realizaram uma série de testes até a exaus-tão em esteira rolante para estimar matematicamente e determinar experimentalmente o TINF e VSUP. A relação entre tempo para atingir o VO2max e tempo de exaustão (Tlim) foi usado para estimar o TINF. A VSUP foi estimada pelo modelo de Velocidade Crítica. VSUP foi assumida como a maior velocidade em que o VO2 foi igual ou maior que a média do VO2max menos um desvio padrão. TINF representou o Tlim associado a VSUP. Corredores apresentaram melhor aptidão aeróbia e consequentemente, maior VSUP (22,2 km.h-1) do que sujeitos ativos (20,0 ± 2,1 km.h-1). Entretanto, T
INTRODUCTION
Exercise intensities are classiied into four domains based on the oxygen uptake (VO2) response: moderate, heavy, severe, and extreme1,2. he
moder-ate domain comprises all exercise intensities that can be performed without a change in blood lactate in relation to resting values, i.e., below the lactate threshold. he heavy domain comprises all intensities between the lactate threshold and critical power, which corresponds to the highest constant
intensity at which maximum oxygen uptake (VO2max) is not reached3.
Intensities just above critical power (i.e., 5 to 10%) permit VO2max to be reached4,5, thereby entering the severe domain which is characterized by
all exercise intensities at which VO2max is achieved. Finally, the extreme domain comprises even higher intensities when the individual reaches the point of exhaustion even before achieving VO2max1,2,6.
Since the severe domain is the only intensity domain in which VO2max is achieved during constant-load exercise, it represents an important physiological range for the prescription of high-intensity interval training7,
which is necessary to provoke additional adaptations in aerobic param-eters of trained athletes8. Furthermore, an inverse relationship between
exercise intensity and the time to achieve VO2max (TAVO2max) exists in this domain. In other words, the higher the exercise intensity, the lower
TAVO2max1,9-11. If the exercise intensity continues to be high, at a certain
point, the constant intensity exercise will be so high that the individual reaches exhaustion even before VO2max is achieved12.
On the basis of this relationship, Hill et al.1, using cycle ergometer
exercise, proposed a mathematical model that would supposedly estimate
the highest intensity at which VO2max is achieved (IHIGH). his model
estimates a single time point at which the time to exhaustion (Tlim)
corresponds to the exact time when VO2max is achieved (i.e., Tlim =
TA-VO2max). his time point corresponds to the shortest time necessary to
achieve VO2max during constant exercise (i.e., shortest exercise duration to achieve VO2max, TLOW). Finally, the intensity corresponding to TLOW (i.e., IHIGH) is estimated by the hyperbolic model of critical power3. Caputo
and Denadai12 subsequently demonstrated that I
HIGH is sensitive to aerobic
training status. he authors observed that cyclists exhibited higher IHIGH values in absolute terms (451 ± 33 vs. 269 ± 73 W) and relative to maximum aerobic power (130 ± 10 vs. 117 ± 6%), as well as lower TLOW (117 ± 29 vs. 209 ± 29 s), when compared to untrained subjects. However, regardless of the training status of the subjects, the mathematical model proposed by Hill et al.1 was not valid to predict T
LOW in the two groups. Furthermore,
the validity of IHIGH estimated with the model decreased with increasing aerobic training status of the subjects.
As a consequence, the mathematical model proposed by Hill et al.1
showed poor validity in estimating the upper boundary of the severe-intensity domain during cycling12. he authors attributed this result to
case of some subjects, the exercise intensities were so high and the exercise duration so short that TAVO2max estimated by VO2 kinetics (tau x 4.6) was
higher than Tlim12. On the other hand, some studies have shown a lower
magnitude of the slow component of VO2 in running exercise compared
to cycling13-15. Moreover, in severe-domain exercise TAVO
2max seems to
be lower in running than in cycling16. herefore, application of this
math-ematical model to running in subjects with diferent training levels may improve the validity of the model, since the factors that afected the valid-ity of the model in cycling (i.e., slow component of VO2 and TAVO2max) would be minimized. Additionally, since runners and active subjects difer
in terms of TAVO2max and VO2 slow component amplitudes2, the use of
these two groups may demonstrate the importance of these factors for the capacity of the proposed model to predict VHIGH. Also, the higher intensity
and shorter exercise duration at which VO2max is reached and the
corre-sponding efects of training status on these variables have not been studied in running. his evaluation can be useful for runners who aim to improve VO2max, since the highest velocity at which VO2max is achieved (VHIGH)
would correspond to the VO2max reached within the shortest duration of
constant-load exercise. his would represent a good physiological index for training prescription designed to increase maintenance times spent close to or at VO2max. Finally, although the determination of VHIGH requires a large number of tests, consequently impairing its use during training, the value that this intensity represents of the main aerobic parameters (e.g., vVO2max, critical velocity) can be easily used for training prescription in subjects with diferent levels of aerobic itness.
herefore, the objectives of the present study were: 1) to investigate the validity of the linear regression model of the relationship between time to
exhaustion and TAVO2max in estimating TLOW during running, and 2)
to compare VHIGH and TLOW during running between runners and active
subjects. On the basis of the lower magnitude of the VO2 slow component
and faster response of TAVO2max during running, the model proposed by
Hill et al.1 could be valid to predict T
LOW in running. Furthermore, in view
of the shorter response times of VO2 to aerobic training2, a lower T
LOW and
higher VHIGH are expected in runners when compared to active subjects.
METHODS
Participants
apparently healthy, non-smokers, and had no injuries. he volunteers were informed about the methodology of the study and signed a free informed consent form. he study was approved by the Ethics Committed of the State University of Santa Catarina (Universidade do Estado de Santa Catarina - Protocol No. 100/2010).
Experimental design
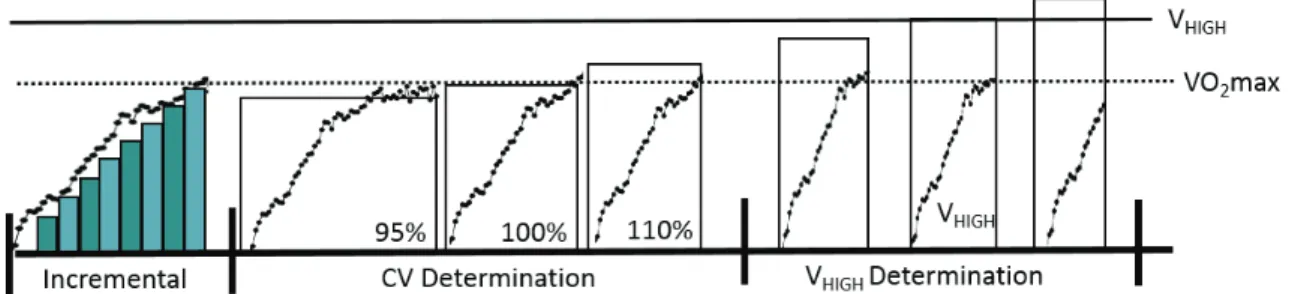
All subjects came to the laboratory in six to eight visits divided into three phases (Figure 1). In the irst phase, body weight and height were measured, followed by an incremental test. In the second phase, three running tests until exhaustion were performed at 95%, 100% and 110%
of vVO2max for the determination of TAVO2max and critical velocity
(CV). he latter corresponds to the y-axis intercept of the line derived from the linear regression of velocity on the inverse of time to exhaustion. In the third phase, 2 to 4 running tests until exhaustion were performed to determine VHIGH and TLOW. In all tests of the second and third phase, the test was preceded by warming up for 10 min at 50% of the velocity corresponding to the lactate threshold, followed by 5 min of rest in the sitting position prior to the test. he tests were performed on a motorized treadmill (INBRAMED Millenium Super Atl, Inbrasport, Porto Alegre, Brazil) maintained at 1% inclination.
Figure 1. Schematic representation of the experimental protocol. The curves of oxygen uptake are merely illustrative. VO2max, maximal oxygen uptake (dotted line); VHIGH, highest constant velocity at which VO2max is reached (solid line). For further details, see the Methods section.
he subjects were asked not to train exhaustively on the day prior to evaluation and to arrive at the laboratory in a fully fed and hydrated state. All procedures were carried out at the same time of day (±2 h), with an interval of 1 to 3 days between tests.
Incremental test
he initial load of the incremental test was 8 km.h-1 for active subjects
and 12 km.h-1 for runners, with increments of 1 km.h-1 every 3 min until
(Quark PFTergo, Cosmed, Rome, Italy), previously calibrated according to manufacturer instructions. he data were reduced to means of 15
sec-onds and the highest value was deined as the VO2max of the incremental
test (VO2INC), which was used to determine the subject’s VO2max. he
lowest velocity at which VO2max was achieved was deined as vVO2max.
he intensity prior to the increase of 1 mmol.L-1 in blood lactate
concen-trations in relation to resting values was considered the velocity at lactate threshold17. Blood lactate concentrations were determined in heparinized
capillary blood analyzed immediately in an electrochemical analyzer (YSI 1500 Sport, Yellow Springs, OH, USA).
Determination of critical velocity
he subjects performed three time-to-exhaustion tests at 95%, 100% or 110%vVO2max on three diferent days. hese intensities were selected to in-duce a time to exhaustion between 2 and 15 min3. he tests were performed
in a random order, with only one test per day. In all tests, the subject was
encouraged verbally to maintain efort until voluntary exhaustion. VO2
data were obtained in each test and reduced to means of 15 seconds. he highest VO2 of each test was determined and considered for the calculation of the subject’s VO2max (i.e., VO295%, VO2100% and VO2110%). For each intensity, Tlim was deined as the total exercise time. For the estimation of CV and D’, the individual values of velocity and Tlim obtained were adjusted using a linear model of velocity versus the inverse of time (1/ time) as follows18:
V = D’ • 1/Tlim + CV (Equation 1)
where V is the constant exercise velocity (km.h-1); Tlim is the time to
exhaustion at the respective velocity (s); D’ is the anaerobic distance capacity (m), and CV is the critical velocity (km.h-1). Two parameters were derived
from the equation: CV, which corresponds to the y-axis intercept of the line, and D’, which corresponds to the slope of the line in relation to the x-axis.
Predicted V
HIGHand T
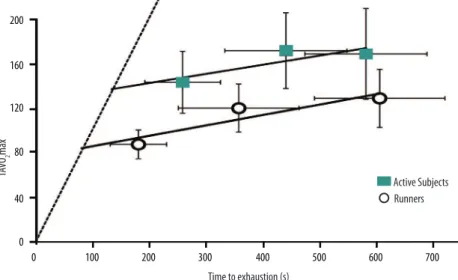
LOWLinear regression was used to individually describe the relationship
be-tween TAVO2max and Tlim. With TAVO2max expressed as a function of
Tlim, it was possible to identify the single Tlim at which VO2max could
hypothetically be achieved at the time of exhaustion (predicted TLOW), i.e.,
when TAVO2max = Tlim. VHIGH was estimated with Equation 1, replacing
Tlim with predicted TLOW (Figure 2).
Determination of V
HIGHand T
LOWvelocity that was 5% higher until VO2max had not been achieved (as shown in Figure 1). Otherwise, if VO2max was not reached during the irst test, the following tests were performed at a 5% lower velocity12 until VO
2max had
been reached. VO2 was measured throughout the protocol. As a criterion
to achieve VO2max, breath-by-breath data obtained in the VHIGH test were analyzed as averages of 5 seconds. he mean of the three highest consecu-tive values (i.e., 15 s) of VO2 in the VHIGH test were deined as VO2max of the VHIGH test. his value had to be equal to or higher than VO2max (mean of VO2INC, VO295%, VO2100% and VO2110%) minus 1 intrasubject standard deviation (i.e., VO2max – 1 SD) to considered the attainment of VO2max12.
VHIGH was considered the highest constant velocity at which VO2max was achieved. TLOW was deined as Tlim associated with VHIGH.
Figure 2. Relationship between time to achieve VO2max (TAVO2max) and time to exhaustion (Tlim) of tests performed at 95%, 100% and 110% vVO2max in active subjects and runners. The estimate of the shortest duration when VO2max is achieved (TLOW) corresponds to the time when Tlim = TAVO2max, i.e., the point of intersection of the trend line of regression between TAVO2max and Tlim and the identity line (dashed line).
VO
2kinetics
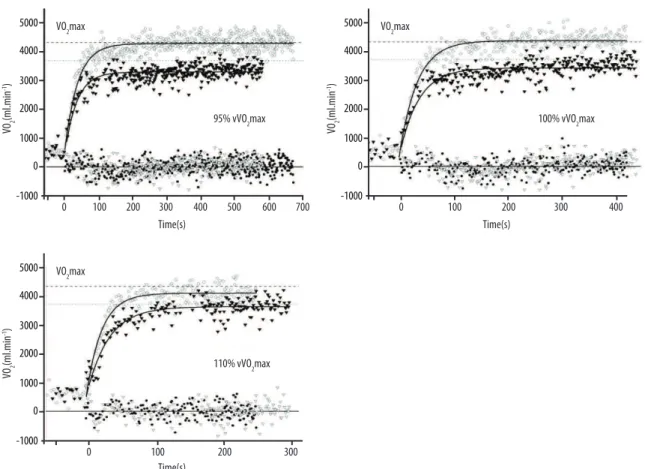
For each exercise transition, breath-by breath VO2 responses were itted
using the following equation:
VO2(t) = VO2b + A (1 – e-(t/τ)) (Equation 2)
where VO2(t) is the oxygen uptake at time t; VO2b is the pre-exercise oxygen uptake; A is the asymptote of the amplitude, and τ is the constant time of oxygen uptake kinetics (deined as the time necessary to reach 63% of A). Occasional errant breaths were removed if they deviated more than four standard deviations from the local mean of 30 seconds19. For the tests at
95%, 100% and 110% vVO2max, TAVO2max was calculated as 4.6 x τ.
Statistical analysis
were compared between groups by the Student t-test for independent sam-ples. Two-way ANOVA with repeated measures for one factor (i.e., intensity
for the analysis of TAVO2max and Tlim, and method used for the analysis
of VHIGH and TLOW) was used for all other analyses. When a signiicant F value was found, an appropriate Student t-test was used to detect possible diferences between two variables. he validity of the proposed model was also analyzed using Pearson’s correlation test and typical error expressed as the coeicient of variation20. Pearson’s correlation test and multiple
(step-wise) linear regression analysis, grouping all subjects in the same group, were used to analyze the relationship of VHIGH and TLOW with the variables studied. A level of signiicance of P ≤ 0.05 was adopted in all analyses.
RESULTS
Incremental test and critical velocity
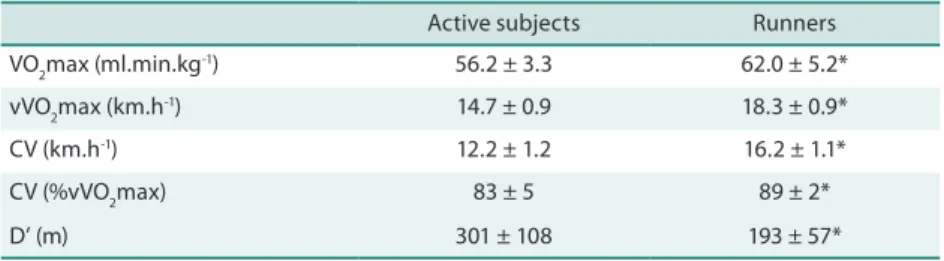
VO2max, vVO2max, CV (absolute and relative) and D’ difered signiicantly (P ≤ 0.03) between groups (Table 1). he mean coeicient of determination of the CV model was 0.981 ± 0.026 in the two groups.
Table 1. Characteristics of the group and critical velocity model.
Active subjects Runners
VO2max (ml.min.kg-1) 56.2 ± 3.3 62.0 ± 5.2*
vVO2max (km.h-1) 14.7 ± 0.9 18.3 ± 0.9*
CV (km.h-1) 12.2 ± 1.2 16.2 ± 1.1*
CV (%vVO2max) 83 ± 5 89 ± 2*
D’ (m) 301 ± 108 193 ± 57*
CV: critical velocity; D’: anaerobic distance capacity. *Signiicant diference between groups (P ≤ 0.03).
Responses in the constant-load tests
Analysis of variance of Tlim detected a signiicant F value in the factor intensity (P < 0.001) and in the interaction between the two factors (P = 0.017). Finally, pairwise comparison revealed no signiicant diference in Tlim at 95% vVO2max (active: 585 ± 108 s; runners: 609 ± 115 s; P = 0.43) or 100% vVO2max (active: 444 ± 108 s; runners: 360 ± 107 s; P = 0.08) between
groups. However, Tlim at 110% vVO2max was signiicantly higher (P =
0.007) in active subjects compared to runners (261 ± 67 versus 183 ± 50 s).
Regarding the comparison of TAVO2max, ANOVA only detected a
signiicant F value in the group (P < 0.001) and intensity (P < 0.001) factor.
Pairwise comparison revealed no signiicant diference in TAVO2max at
95% vVO2max (active: 169 ± 41 s; runners: 129 ± 26 s) or 100 %vVO2max
(active: 173 ± 34 s; runners: 121 ± 22 s) between groups (P > 0.2). However,
TAVO2max at 110% vVO2max was signiicantly lower in runners (active:
144 ± 28 s; runners: 88 ± 13 s) when compared to 95% and 100% vVO2max
Validity of the proposed model
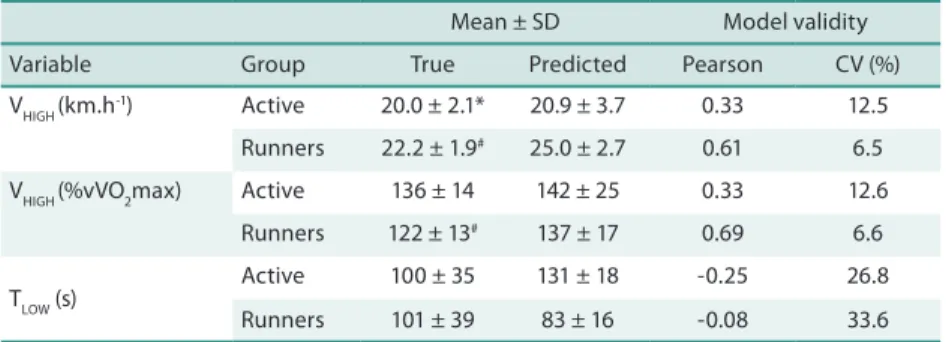
Table 2 shows the predicted and observed (true) values of VHIGH and TLOW for the two groups, as well as the relative and absolute consistency of the model proposed. For absolute VHIGH, ANOVA detected a signiicant F value in the group (P < 0.05) and prediction model (P < 0.05) factor. When VHIGH was ex-pressed as relative values, only the prediction model factor was signiicant (P = 0.047). Furthermore, the same analysis detected a signiicant F value in the group factor (P ≤ 0.01) and in the interaction between factors (P < 0.01) for TLOW. Pairwise comparison revealed signiicant diferences between groups for VHIGH expressed as absolute values (P = 0.046), but no signiicant
dif-ference for TLOW (P = 0.97). Moreover, a signiicant diference between
predicted and observed values of VHIGH (relative and absolute) was only
observed in runners (P < 0.01). Finally, comparison between predicted and observed TLOW showed no signiicant diference in either group (P > 0.09).
Figure 2 shows the relationship between TAVO2max and Tlim in the
tests at 95%, 100% and 110% vVO2max for the two groups. he coeicient
of determination of this relationship was low in runners (r2 = 0.79 ± 0.26)
and active subjects (r2 = 0.68 ± 0.39). here was no signiicant correlation
between the observed and predicted values of any of the parameters, despite the observation of a signiicant trend in the correlation for VHIGH in run-ners (P = 0.06). he coeicient of variation to estimate VHIGH was higher in
active subjects (12.5%) than in runners (6.5%). he coeicient of variation for TLOW was high in both groups (> 25%).
Table 2. Observed (true) and predicted values of highest velocity (VHIGH) and shortest duration (TLOW) at which VO2max is achieved in active subjects and runners.
Mean ± SD Model validity
Variable Group True Predicted Pearson CV (%)
VHIGH (km.h-1) Active 20.0 ± 2.1* 20.9 ± 3.7 0.33 12.5
Runners 22.2 ± 1.9# 25.0 ± 2.7 0.61 6.5
VHIGH (%vVO2max) Active 136 ± 14 142 ± 25 0.33 12.6
Runners 122 ± 13# 137 ± 17 0.69 6.6
TLOW (s) Active 100 ± 35 131 ± 18 -0.25 26.8
Runners 101 ± 39 83 ± 16 -0.08 33.6
CV: coeicient of variation.*Signiicant diference between groups (P < 0.05). #Signiicant diference between true and predicted values (P < 0.05).
Relationship between variables
VHIGH was signiicantly correlated only with vVO2max (r = 0.49; P = 0.05). he multiple linear regression model showed that the main variables pre-dicting VHIGH are, in order of importance, vVO2max and D’. he multiple correlation coeicient adding each variable was 0.49-0.63 (P = 0.03) and the equation estimated from this correlation was VHIGH = 0.9 x vVO2max + 0.011 x D’ + 3.528. TLOW was not correlated with any of the variables studied.
DISCUSSION
To our knowledge, this is the irst study determining the highest velocity and shortest exercise duration at which maximal oxygen uptake is achieved during running and the inluence of training status on these variables. One of the main results of this study was that VHIGH was sensitive to training status. However, in contrast to our initial hypothesis, TLOW did not difer between groups. Furthermore, the capacity of the proposed model to es-timate VHIGH and TLOW was poor.
Prediction model of V
HIGHand T
LOWIn the present study, VHIGH corresponded to 136 ± 14% of vVO2max in active subjects, the same relationship estimated by Hill et al.1 with a mathematical
model in active subjects during cycling (i.e., 136% of maximal aerobic power). However, this similarity must have occurred by chance considering the dif-ferences in the exercise mode used. In view of this diference, we applied the model proposed by Hill et al.1 to estimate V
HIGH and TLOW. his model is based
on a strong linear relationship between TAVO2max and Tlim, which was
not strong in the present study, with a mean coeicient of determination of 0.68 ± 0.39 and 0.79 ± 0.26 for active subjects and runners, respectively. As a consequence, the model was also ineicient in estimating VHIGH, probably because the estimate of VHIGH obtained with the CV model depends on TLOW
Some limitations of the present study regarding the estimation of VHIGH
and TLOW should be taken into consideration. First, the model proposed
is based on a strong linear relationship between TAVO2max and Tlim1.
However, in each group, TAVO2max was signiicantly lower only at the
intensity of 110% vVO2max compared to the other intensities (95% and
100% vVO2max). It is important to note that the extent of TAVO2max was probably afected by the use of only one transition at each intensity24. his
fact impairs the comparison of small changes in VO2 kinetics during run-ning exercises across the severe-intensity domain, i.e., those that already exhibited rapid VO2 kinetics25. herefore, using only one transition, the
relationship between TAVO2max and Tlim was compromised in the two
groups studied and was apparently not linear, reducing the eicacy of the
model to mathematically estimate TLOW. However, only one transition was
conducted for all evaluations due to the high requirements of the tests, large number of laboratory visits and low availability of the group of run-ners. Finally, the small number of subjects may reduce the power of the statistical test used by causing type II errors. However, despite the small number of subjects, the present study detected failures arising from this model and these failures would probably persist even if a larger number of subjects were included.
Efects of training status
he results of VO2max, vVO2max and CV obtained for the runners
stud-ied were similar to those reported in the literature for moderately trained athletes21. Furthermore, the aerobic itness of active subjects was lower than
that of runners, with the observation of lower aerobic indices and higher TAVO2max at all intensities tested. However, active subjects exhibited a higher D’, i.e., the characteristic of withstanding intensities above CV for
a longer period of time22. his fact was demonstrated by the higher Tlim
at the intensity of 110% vVO2max in active subjects compared to runners. As observed for other aerobic indices evaluated in the present study,
VHIGH was higher in runners and was consequently found to be sensitive to
training status. Additionally, this parameter was correlated with vVO2max,
indicating that VHIGH is an important aerobic index. However, multiple
regression analysis suggests that VHIGH is inluenced by both vVO2max
and D’. his suggestion is in accordance with the study of Billat et al.10 in
which only subjects possessing higher D’ values achieved VO2max at 140%
vVO2max. However, it should be noted that vVO2max was the main variable in multiple regression analysis, a inding corroborated by studies in which this threshold responded positively to aerobic training6,12.
In contrast to VHIGH, TLOW was similar in the runners and active
sub-jects studied here. his result disagrees with Caputo and Denadai12 who
found a lower TLOW in trained athletes due to aerobic adaptations that were responsible for a rapid VO2 kinetic response2. In fact, a lower TAVO
2max
the CV (i.e., higher D’) for a longer period of time, resulting in the same Tlim at diferent relative intensities in the two groups (i.e., active subjects at a higher relative intensity than athletes). As a consequence, it is likely that the two groups studied present a similar TAVO2max for the same Tlim in supramaximal exercises, since an increase in relative intensity reduces
TAVO2max1,9-11. hese factors may explain in part the lack of a diference
in TLOW between groups.
In addition to the lack of diference in TLOW between groups (active
subjects: 100 ± 35 s; runners: 101 ± 39 s), the TLOW values obtained here are
lower than those reported by Caputo and Denadai12 for cycling exercise
(active subjects: 209 ± 29 s; runners: 117 ± 29 s). VO2 kinetic responses in the severe domain have been shown to be faster in running when com-pared to cycling15, 23. Furthermore, when the same relative intensities are
compared, cyclists showed a higher Tlim during cycling than runners
during running16, which could explain the apparent diferences in T
LOW
between studies. Finally, despite lower aerobic itness compared to runners, the active subjects studied here exhibited good aerobic conditioning, as demonstrated by the fact that their VO2max (56.2 ± 3.3 ml.min.kg-1) was
similar to that of long-distance runners during cycling (54.6 ± 5.5 ml.min. kg-1) and higher than that of untrained subjects (42.9 ± 3.5 ml.min.kg-1)
in the study of Caputo and Denadai12. Taken together, these factors seem
to contribute to an apparent lower TLOW in running compared to cycling.
CONCLUSION
he present study showed that the highest velocity at which VO2max is
achieved responds positively to aerobic training. However, on the basis of the multiple regression model used, training strategies designed to improve
D’ may also be important for improvement of VHIGH. Finally, researchers
and coaches should not rely on the mathematical estimation of VHIGH and
TLOW, since the model proposed appeared not to be valid in running.
Acknowledgements
To Conselho Nacional de Desenvolvimento Científico e Tecnológico (CNPq) for inancial support (Grant No. 478459/2008-4).
REFERENCES
1. Hill DW, Poole DC, Smith JC. he relationship between power and the time to achieve VO2max. Med Sci Sports Exerc 2002;34(4):709-14.
2. Burnley M, Jones AM. Oxygen uptake kinetics as a determinant of sports perfor-mance. Eur J Sport Sci 2007;7(2):63-79.
3. Vanhatalo A, Jones AM, Burnley M. Application of critical power in sport. Int J Sports Physiol Perform 2011;6(1):128-36.
4. Poole DC, Ward SA, Gardner GW, Whipp BJ. Metabolic and respiratory proile of the upper limit for prolonged exercise in man. Ergonomics 1988;31(9):1265-79.
Corresponding author
Tiago Turnes
Rua Pascoal Simone, 358 - Coqueiros - CEP: 88080-350 - Florianópolis, SC. Brasil
Email: tiagoturnes89@gmail.com
6. Caritá RAC, Caputo F, Greco CC, Denadai BS. Aptidão aeróbia e amplitude dos domínios de intensidade de exercício no ciclismo. Rev Bras Med Esporte 2013;19(4):271-4.
7. Duield R, Edge J, Bishop D. Efects of high-intensity interval training on the VO2 response during severe exercise. J Sci Med Sport / Sports Medicine Australia 2006;9(3):249-55.
8. Laursen PB, Jenkins DG. he scientiic basis for high-intensity interval training: optimising training programmes and maximising performance in highly trained endurance athletes. Sports Med 2002;32(1):53-73.
9. Margaria R, Mangili F, Cuttica F, Cerretelli P. he kinetics of the oxygen consump-tion at the onset of muscular exercise in man. Ergonomics 1965;8(1):49-54.
10. Billat VL, Blondel N, Berthoin S. Determination of the velocity associated with the longest time to exhaustion at maximal oxygen uptake. Eur J Appl Physiol Occup Physiol 1999;80(2):159-61.
11. Hill DW, Stevens EC. VO2 response proiles in severe intensity exercise. J Sports Med Physical Fitness 2005;45(3):239-47.
12. Caputo F, Denadai BS. he highest intensity and the shortest duration permitting attainment of maximal oxygen uptake during cycling: efects of diferent methods and aerobic itness level. Eur J Appl Physiol 2008;103(1):47-57.
13. Jones AM, McConnell AM. Efect of exercise modality on oxygen uptake kinetics during heavy exercise. Eur J Appl Physiol Occup physiol 1999;80(3):213-9.
14. Carter H, Jones AM, Barstow TJ, Burnley M, Williams CA, Doust JH. Oxygen uptake kinetics in treadmill running and cycle ergometry: a comparison. J Appl Physiol 2000;89(3):899-907.
15. Caputo F, Denadai BS. Exercise mode afects the time to achieve VO2max without inluencing maximal exercise time at the intensity associated with VO2max in triathletes. Int J Sports Med 2006;27(10):798-803.
16. Caputo F, Mello MT, Denadai BS. Oxygen uptake kinetics and time to exhaustion in cycling and running: a comparison between trained and untrained subjects. Arch Physiol Biochem 2003;111(5):461-6.
17. Coyle EF. Integration of the physiological factors determining endurance perfor-mance ability. Exerc Sport Sci Rev 1995;23:25-63.
18. Whipp BJ, Huntsman DJ, Stoner N, Lamarra N, Wasserman K. A constant which determines the duration of tolerance to high-intensity work. Federation Proceed-ings. 1982;41(5):1591.
19. Ozyener F, Rossiter HB, Ward SA, Whipp BJ. Inluence of exercise intensity on the on- and of-transient kinetics of pulmonary oxygen uptake in humans. J Physiol 2001; 15;533(Pt 3):891-902.
20. Hopkins WG. Measures of reliability in sports medicine and science. Sports Med 2000;30(1):1-15.
21. Kilding AE, Winter EM, Fysh M. Moderate-domain pulmonary oxygen uptake kinetics and endurance running performance. Journal of sports sciences. 2006 Sep;24(9):1013-22.
22. Chidnok W, Dimenna FJ, Bailey SJ, Wilkerson DP, Vanhatalo A, Jones AM. Efects of pacing strategy on work done above critical power during high-intensity exercise. Med Sci Sports Exerc 2013;45(7):1377-85.
23. Hill DW, Halcomb JN, Stevens EC. Oxygen uptake kinetics during severe intensity running and cycling. Eur J Appl Physiol 2003;89(6):612-8.
24. Lamarra N, Whipp BJ, Ward SA, Wasserman K. Efect of interbreath luctuations on characterizing exercise gas exchange kinetics. J Appl Physiol 1987;62(5):2003-12.