www.atmos-chem-phys.net/16/5091/2016/ doi:10.5194/acp-16-5091-2016
© Author(s) 2016. CC Attribution 3.0 License.
Cloud chamber experiments on the origin of ice crystal complexity
in cirrus clouds
Martin Schnaiter1, Emma Järvinen1, Paul Vochezer1, Ahmed Abdelmonem1, Robert Wagner1, Olivier Jourdan2, Guillaume Mioche2, Valery N. Shcherbakov2, Carl G. Schmitt3, Ugo Tricoli4, Zbigniew Ulanowski5, and
Andrew J. Heymsfield3
1Institute of Meteorology and Climate Research – Atmospheric Aerosol Research,
Karlsruhe Institute of Technology (KIT), Karlsruhe, Germany
2Laboratoire de Métérologie et Physique (LaMP), Clermont-Ferrand, France 3National Center for Atmospheric Research (NCAR), Boulder, Colorado, USA 4Institute of Environmental Physics, University of Heidelberg, Heidelberg, Germany
5Centre for Atmospheric and Instrumentation Research, University of Hertfordshire, Hatfield, UK
Correspondence to:Martin Schnaiter ([email protected])
Received: 22 October 2015 – Published in Atmos. Chem. Phys. Discuss.: 4 November 2015 Revised: 8 April 2016 – Accepted: 12 April 2016 – Published: 25 April 2016
Abstract.This study reports on the origin of small-scale ice crystal complexity and its influence on the angular light scat-tering properties of cirrus clouds. Cloud simulation exper-iments were conducted at the AIDA (Aerosol Interactions and Dynamics in the Atmosphere) cloud chamber of the Karlsruhe Institute of Technology (KIT). A new experimen-tal procedure was applied to grow and sublimate ice parti-cles at defined super- and subsaturated ice conditions and for temperatures in the −40 to−60◦C range. The experiments were performed for ice clouds generated via homogeneous and heterogeneous initial nucleation. Small-scale ice crys-tal complexity was deduced from measurements of spatially resolved single particle light scattering patterns by the lat-est version of the Small Ice Detector (SID-3). It was found that a high crystal complexity dominates the microphysics of the simulated clouds and the degree of this complexity is dependent on the available water vapor during the crystal growth. Indications were found that the small-scale crystal complexity is influenced by unfrozen H2SO4/H2O residuals
in the case of homogeneous initial ice nucleation. Angular light scattering functions of the simulated ice clouds were measured by the two currently available airborne polar neph-elometers: the polar nephelometer (PN) probe of Laboratoire de Métérologie et Physique (LaMP) and the Particle Habit Imaging and Polar Scattering (PHIPS-HALO) probe of KIT. The measured scattering functions are featureless and flat in
the side and backward scattering directions. It was found that these functions have a rather low sensitivity to the small-scale crystal complexity for ice clouds that were grown under typ-ical atmospheric conditions. These results have implications for the microphysical properties of cirrus clouds and for the radiative transfer through these clouds.
1 Introduction
Cirrus clouds are situated in the cold upper troposphere at temperatures typically below −35◦C, and, therefore, they are completely composed of ice particles (Guignard et al., 2012; Baran et al., 2012). With their persistent coverage of about 30 % in the midlatitudes and up to 70 % in the trop-ics, these clouds are an important component of the Earth’s energy balance (Guignard et al., 2012). The underlying net radiative effect is expressed by the difference between a cool-ing effect due to the reflection of incomcool-ing shortwave solar radiation (albedo effect) and a warming effect by the absorp-tion of outgoing long-wave terrestrial radiaabsorp-tion (greenhouse effect). Both effects depend on the macroscopic properties of the clouds, like the ice water content (IWC) or the cloud op-tical thicknessτ, as well as the size, shape, and crystal
The mean global net radiative effect of cirrus clouds is highly uncertain, because their solar albedo cannot easily be quantified due to the unknown scattering properties of the complex-shaped ice particles. The crystal complexity can alter the local net radiative effect of a cirrus cloud (with otherwise fixed macroscopic parameters) from−40 to +20 W m−2(Zhang et al., 1999), though the global effect by cirrus clouds is much less. Airborne in situ measurements of the microphysical properties of cirrus clouds have revealed an increasing wealth of different sizes, shapes, and crystal complexity (see, e.g., Baran, 2012, for an overview). This clearly emphasizes that more specific studies are necessary on the link between the ice particle microphysical complex-ity and the macroscopic cloud radiative properties.
For a better assessment of the cirrus radiative effects, sin-gle particle light scattering models for different ice particle shapes and degree of crystal complexity have been devel-oped over the last 2 decades (Baran, 2009; Yang et al., 2015). These calculations have been stimulated by the remote sens-ing community, which need realistic ice particle light scat-tering properties to improve their retrieval algorithms. The cirrus ice crystal model used in these algorithms has suc-cessively been extended in order to cover the increasing ice cloud remote sensing observations like spectral reflection, polarization, and depolarization. With these new observa-tions, there is now increasing evidence that highly complex ice particles (irregular particles or crystals with rough sur-faces) are necessary to get a consistent interpretation of the combined satellite observations (Baran et al., 2003; Baran and Francis, 2004; Baum et al., 2011; van Diedenhoven et al., 2013; Baran et al., 2014b; Liu et al., 2014; Cole et al., 2014). The angular scattering function of such ice particles is cal-culated to be featureless with a flat trend at backscattering angles, so that the ice features observed in the scattering function of pristine ice particles, i.e., the 22 and 46◦halos
as well as the ice bow at backscattering angles, are smoothed out. Field et al. (2003) analyzed SID-2 single particle scat-tering patterns in order to draw conclusions on the scatscat-tering phase function of cirrus ice crystals. They found no evidence for 22◦halos in their data set of midlatitude cirrus. The
fea-tureless and flat scattering functions result in relatively low asymmetry parameters,g, below 0.8 for these particles and
between 0.75 and 0.78 for retrievedg values inferred from
recent remote sensing polarization observations (van Dieden-hoven et al., 2013; Cole et al., 2014).
In situ measurements of the angular light scattering func-tion in midlatitude cirrus clouds (Gayet et al., 1998, 2004; Febvre et al., 2009) as well as Arctic mid-level ice (Lam-pert et al., 2009) and mixed-phase clouds (Jourdan et al., 2010) by the polar nephelometer (PN; Gayet et al., 1997) re-vealed a low asymmetry parameter in the range from 0.76 to 0.79, indicating ice particles with deeply roughened surfaces. Ulanowski et al. (2006) measured the angular light scattering function of smooth and roughened ice analogue crystals in the laboratory. They deduced very low asymmetry
parame-ters of 0.63 for rough hexagonal rosette crystals, which dif-fer significantly from the parameters around 0.8 recorded for smooth rosettes.
Over the last few years, an increasing number of stud-ies have been published that apply the environmental elec-tron microscopy technique to investigate the surface prop-erties of growing and sublimating ice particles over a wide range of temperatures (Pfalzgraff et al., 2010; Neshyba et al., 2013; Ulanowski et al., 2014; Magee et al., 2014). The com-mon observation of these studies is a prevalent mesoscopic roughness topography of the ice crystal surfaces on the scale of 1–20 µm. Neshyba et al. (2013) derived a roughness parametrization from their micrographs and applied a ray-tracing model to calculate the expected consequences for the angular light scattering function. They calculated a signifi-cant reduction of the asymmetry parameter of about 0.04 to 0.06 due to the derived surface roughness. Although these in-vestigations indicate a prominent mesoscale surface texture of the ice crystals with the ice saturation ratio as an impor-tant driving factor, the relevance of these findings for real atmospheric ice particles is still under debate.
As already mentioned, the uncertainties in assessing the radiative effect by cirrus clouds are due to the uncertainties of many macroscopic as well as microscopic cloud proper-ties like IWC, the vertical structure of the ice particle size and shape distributions, the amplitude and distribution of the small ice mode, etc. (Mitchell et al., 2008; Yang et al., 2012; Baran et al., 2014a). However, if ice crystal surface rough-ness is a prevalent feature of atmospheric ice particles, the reduced asymmetry parameters of these particles has signifi-cant consequences for the cloud radiative effect, as it was re-cently shown in a climate modeling study by Yi et al. (2013). They used the National Center for Atmospheric Research Community Atmosphere Model (CAM, version 5.1) and cal-culated the global net radiative effects of clouds consisting of smooth and severely roughened ice particles. A global-averaged difference of−1.46 W m−2was calculated between the runs with smooth and roughened ice particles, indicating that ice particle surface roughness has the potential to force the energy balance in a similar magnitude as the greenhouse gases but opposite in sign. However, the underlying assump-tion that all atmospheric ice particles have a similar degree of crystal complexity and, therefore, a similar low asymme-try parameter is highly questionable.
i. What is the role of the thermodynamic conditions pre-vailing during ice particle growth for the crystal com-plexity?
ii. Does the ice nucleation type, i.e., heterogeneous or ho-mogeneous, have an influence on the ice crystal com-plexity?
iii. What is the impact of ice crystal complexity on the an-gular light scattering function and the asymmetry pa-rameterg?
The crystal complexity was deduced from single particle measurements by the latest version of the Small Ice Detector (SID-3), which has been recently applied in an aircraft field study by Ulanowski et al. (2014).
The SID-3 method to deduce single particle complexity is described in Sect. 2.1 followed by an introduction to the AIDA cloud chamber instrumentation and the experimental procedure in Sect. 2.2. It was found that ice crystal complex-ity is frequently observed in the simulated ice clouds and the degree of this complexity is dependent on the available water vapor during the crystal growth. A parametrization was de-veloped to link the crystal complexity to the available water vapor. This parametrization as well as the link between the angular light scattering properties and ice crystal complex-ity are presented in Sect. 3. The atmospheric relevance of the results is discussed in Sect. 4 and the final conclusions are drawn in Sect. 5.
2 Methods
2.1 Quantification of ice crystal complexity and surface roughness
2.1.1 Measurement of high-resolution angular light scattering patterns
Crystal complexity of individual small ice particles is mea-sured using the Small Ice Particle Detector Mk. 3 (SID-3). To differentiate single crystal complexity, which is the sub-ject of the present study, to the complexity that is induced by crystal aggregation, we henceforth use the term “small-scale complexity”, which is often referred to as surface roughness. While large-scale complexity or crystal aggregation can eas-ily be observed by high-resolution imaging (e.g., Schmitt and Heymsfield, 2014), the characterization of small-scale complexity needs a different approach, like the detection of high-resolution scattering patterns described here. Small-scale complexity, therefore, comprises all surface distortions on a single ice particle (surface roughness on a variety of scales, polycrystallinity, and (stepped) hollowness) that re-sults in the formation of speckles in coherent light scattering. The analysis of these spatial fluctuations in the scattered in-tensity of individual particles is the fundamental method of
measuring single particle complexity with SID-3 (Ulanowski et al., 2014).
SID-3 is the latest version of a suite of airborne single par-ticle cloud probes that were developed by the University of Hertfordshire, UK. The derivation of ice particle complexity from SID-3 measurements is possible, since the basic con-cept of the SID instruments differ from other airborne single particle scattering probes. While these probes measure the total scattered light intensity in forward direction, the SID in-struments additionally quantify the spatial distribution of the forward scattered light at different resolution levels. The first version of the instrument uses six azimuthally arranged de-tectors and was primarily designed to discriminate between super-cooled water droplets and ice particles (Hirst et al., 2001). The second versions, named SID-2 and SID-2H, were designed to detect azimuthal light scattering patterns with 24 and 28 detectors, respectively (Cotton et al., 2010; Johnson et al., 2014). Finally, SID-3 uses an intensified charged cou-pled device camera (ICCD) to acquire two-dimensional (2-D) forward light scattering patterns with an angular resolu-tion of better than 0.1◦. Details of the instrument set up and
data acquisition can be found in Ulanowski et al. (2014) and Vochezer et al. (2016). Here, we want to briefly highlight those features of SID-3 that are important for the ice crystal complexity measurements.
In the SID-3 probe individual particles pass a 532 nm, 30 mW laser beam. From these particles, 2-D light scattering patterns are acquired using a 780×582 pixels ICCD (Photek Ltd, UK) with a maximum repetition rate of 30 Hz. Although images can be stored as 12 bit TIFF files, we set SID-3 to store the patterns as 8 bit grey-scale JPEG files to be con-sistent with the laboratory and field studies by Ulanowski et al. (2014) and Vochezer et al. (2016). Image brightness can be adjusted by changing the intensifier gain of the ICCD. For the chamber experiments, we have chosen gains of 175 or 180 in order to get a maximum of analyzable scattering patterns (neither underexposed nor saturated) for the particle size range from about 3 to 30 µm.
In the case of the SID-3 instrument, the (usable) polar angular range covered by the annulus-shaped main detector aperture is 7 to 23◦relative to the forward scattering
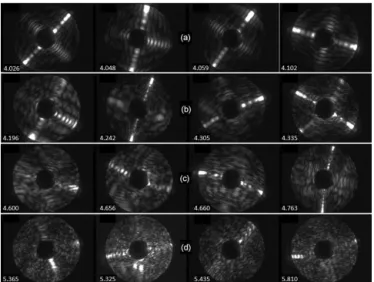
direc-tion. Representative examples of 2-D scattering patterns of single small ice particles that were nucleated and grown in our cloud chamber experiments are given in Fig. 1. Note that for pristine hexagonal ice columns the scattering pat-terns (given in Fig. 1a, b) clearly show the 22◦halo
refrac-tion peaks on the intense diffracrefrac-tion arc that corresponds to thec axis of the crystals. In the case of roughened or
proce-Figure 1.Representative examples of 2-D light scattering patterns
of individual small columnar ice particles generated in re-growth cloud chamber experiments at−50◦C. The patterns are labeled by the energy feature parameterke (lower left corner). The patterns
are arranged according to increasingkefrom left to right and from panels(a)to(d). Particle fractions that have a significant degree of
small-scale complexity are deduced by setting a threshold value of kthre =4.6 and classifying all particles equal and above as complex.
dures to grow ice crystals with different degrees of complex-ity are presented in Sect. 2.2.2.
In addition to the 2-D scattering patterns, the triggering system of SID-3 stores scattering intensity data of all parti-cles that have passed the sensing area of the instrument, i.e., also for those particles that were detected while the ICCD was still busy with the image processing of a previous parti-cle. The maximum acquisition rate for trigger intensity data is 11 kHz. This feature allows us to (i) calibrate the trigger de-tector by a set of scattering patterns from water droplets and (ii) generate statistically well-defined particle size distribu-tions based on the trigger intensity measurements. In the case of SID-3, the trigger intensity measurements are performed under a relatively narrow solid angle around the 50◦
direc-tion with respect to the forward direcdirec-tion.Therefore, the mea-surement is biased by the particle orientation in the case of aspherical ice particles. For this reason, the trigger intensity measurements from the Particle Phase Discriminator (PPD-2K), the laboratory version of SID-3, was used in the present study to determine the particle size distribution of the cham-ber ice clouds. PPD-2K measures the light scattering inten-sity of each individual particle over the annulus-shaped main detector aperture which is less biased by particle orientation. In addition, PPD-2K has a specifically designed inlet noz-zle that focusses the sampled particles to the sensitive area of the instrument which results in better counting statistics compared to SID-3. Details on the PPD-2K and the size cali-bration procedure can also be found in Vochezer et al. (2016).
2.1.2 Scattering pattern analysis
For the analysis of the 2-D scattering patterns, a comprehen-sive image processing and analysis software was developed using the Vision Development Module of the LabView™
(National Instruments Inc., USA) package. A detailed de-scription of the main analysis steps per scattering pattern can be found in Vochezer et al. (2016). These steps comprise
– the computation of the polar integrated azimuthal inten-sity profile for droplet/ice discrimination
– a Mie fit procedure of the azimuthally integrated polar intensity profile in the case of spherical particles to de-termine the droplet diameter
– a discrete fast Fourier transformation of the polar inten-sity profile for the shape classification of ice particles – a speckle pattern texture analysis to deduce small-scale
ice crystal complexity.
While the first three steps are explained in detail in Vochezer et al. (2016), the final speckle pattern analysis step is de-scribed in the following.
The crystal complexity analysis relies on the grey-level co-occurrence matrix (GLCM) method described in Lu et al. (2006). This method was originally developed in the con-text of quality control of surface treatment processes, and Ulanowski et al. (2010) transferred it for the first time to the analysis of SID-3 ice crystal scattering patterns. The GLCM method was further applied in a first study on ice crystal complexity of simulated cirrus clouds generated in the AIDA cloud chamber (Schnaiter et al., 2011) and in the analysis of SID-3 data of atmospheric ice particles by Ulanowski et al. (2014).
The GLCM represents a frequency matrix describing how often pairs of grey levels occur in a texture image for pix-els separated by a certain distance 1d and along a certain
direction. In case of the 8 bit grey-level scattering patterns generated by SID-3, the GLCM has a size of 128×128 ele-ments, where each elementp(i, j )represents a specific pair
of grey-level values given by the two matrix indicesi, j. The
values of the individual elements give the total number of the corresponding grey-level pairs that were found when the al-gorithm is moving pixel-wise across the scattering pattern. Illustrations of this procedure can be found in Figs. 3 and 4 of Lu et al. (2006). Speckle pattern texture features can then be extracted from the GLCM, like the energy or uniformity featureEthat represents the sum of the squared elements in
the GLCM
E= mX−1
i=0
mX−1
j=0
p(i, j )2. (1)
1973, for details). In addition to these texture features, a “combined roughness measure” as defined by Ulanowski et al. (2014) as well as the normalized energy feature param-eterkeare computed by the image processing software. The
former is a combination of E with measures of the image
brightness distribution which (i) has a clear correlation with the subjective particle surface roughness and (ii) is less sensi-tive to image brightness variations. The latter was introduced by Lu et al. (2006). They investigated the correlation of the GLCM features to the physical roughness for laser scatter-ing patterns (λ=0.66 µm) from standard grinding specimens
with average surface roughness profile parametersRain the
range from 0.05 to 1.6 µm. The energy featureEwas found
to have the best correlation to the physical surface rough-ness. Moreover, Lu et al. (2006) investigated the robustness ofEfor variances in the configuration of the measurement,
e.g., laser power stability, and suggested an exponential fit to the energy feature vs. pixel distance functionE(1d)as the
most robust roughness measure. The energy feature param-eter kethen represents the coefficient of this exponential fit
to the combinedE(1d)curves that were calculated from the
GLCM for the four distinct directions 0, 45, 90, and 135◦.
In the present analysis algorithm,keis deduced based on the
energy feature curves that are calculated for the first three di-rections. Each of the three curves covers the1drange from 1
to 31. So, a total number of 3×30=90 GLCM are calculated and analyzed per scattering pattern.
According to Lu et al. (2006), the energy feature parame-terkehas “a good relationship with the surface roughness; is
more robust to the variances of the setup configuration, the position, and the orientation of the surface to be measured; and is the best feature parameter to characterize the surface roughness”. They plotted the dependence ofkeon the
phys-ical surface roughness profile parameter Ra and found that
for theRavalue range from 0.1 to about 0.4 µm thekevalues
increase from 4 to 5.8, respectively. Moreover,ke started to
saturate at a value around 6 forRavalues larger than the laser
wavelength. The robustness ofke for the SID-3 optical
sys-tem and for variances in laser power was also investigated in the present work by using analogue ice particles residing on glass plates as test objects (see Appendix A for details). The result of this test (given in Table A1) shows thatkevaries by
less than 1 % over a broad image brightness range. Further, discrete dipole approximation (DDA) light scattering calcu-lations of deformed spherical ice particles were conducted for different deformation degrees in order to determine a re-lationship between thekevalue and the particle surface
mod-ifications. Details of this modeling work can be found in Ap-pendix B. In summary, these tests show that (i)keis the most
robust feature parameter to characterize small-scale crystal complexity with SID-3 and (ii) there is a correlation between the optical feature ke and the physical surface distortion in
the range from 0.1 to about 1 µm whenkestarts to saturate.
The analysis and interpretation of the SID-3 data therefore
rely onkeas the primary measure for small-scale ice crystal
complexity.
For this work the above listed scattering pattern analysis steps were restricted to images within a narrow mean bright-ness (grey level) range between 10 and 25. In this way we could minimize remaining image brightness biases on the GLCM analysis results. For this brightness range the rela-tive standard deviation inkeis only 0.7 % and the fraction of
saturated pixels per pattern is always below 1 % even for the brightest images (see Appendix A).
2.2 Cloud chamber simulation experiments
The ice crystal growth experiments were conducted in the aerosol and cloud simulation chamber AIDA of the Karl-sruhe Institute of Technology. AIDA can be operated as an expansion chamber to simulate the atmospheric conditions in ascending cloud parcels in the temperature range down to −90◦C. The general experimental procedure applied in these cloud expansion experiments has been described in several publications (e.g., Möhler et al., 2005a; Wagner et al., 2006, 2015; Schnaiter et al., 2012). In the present study, the cham-ber was used to simulate ice clouds in the cirrus temperature regime. A novel experimental procedure was developed to modify the ice crystal surface properties and their degree of small-scale complexity through growth and sublimation pe-riods at defined super- and subsaturated ice conditions. This method is different from the standard expansion procedure (see, e.g., Möhler et al., 2005a) and is therefore described in more detail in Sect. 2.2.2. In the following section, the cham-ber instrumentation is introduced that was applied in the ex-periments.
2.2.1 Instrumentation
We used the same instrument configuration as in the study of Schnaiter et al. (2012) with additional airborne cloud particle probes; the PN (Gayet et al., 1997), the Particle Habit Imag-ing and Polar ScatterImag-ing probe (PHIPS) as well as a Formvar replicator very similar to the one used in Miloshevich and Heymsfield (1997). A scheme of the basic experimental set-up is shown in Fig. 5 of Schnaiter et al. (2012).
PHIPS-HALO is a novel airborne cloud probe that has been developed and certified for the operation on-board the new German research aircraft HALO (High Altitude and LOng Range). PHIPS-HALO is a combination of a stereo-scopic imager and a polar nephelometer to acquire (i) micro-graphs of individual ice particles from two directions at an optical resolution of about 2.5 µm and (ii) the polar
scatter-ing function of the same particle in the angular range from 1 to 170◦. Details on the basic instrument concept and
measures, depending on the particle concentration, the polar scattering function of single particles or particle ensembles in the angular range from 3.5 to 169◦ (Gayet et al., 1997;
Crépel et al., 1997).
Ice particle replica were generated on 35 mm transparent plastic film strips that were precoated with polyvinyl for-mal (Formvar). Precoating was produced at room tempera-ture by brushing one side of the plastic film with a solution of 5 % Formvar in chloroform which results in a Formvar coat-ing of about 100 µm. For the operation at the AIDA cham-ber the replicator was modified by a solvent dispensing sys-tem composed of ∼3 m teflon tubing and a syringe pump located outside the insulating housing of the chamber. In this way the softening of the Formvar coating by dispensing dichloromethane to the strip could be externally controlled. We used dichloromethane to soften the coating prior to the impaction of ice particles because of its low freezing point of −95.1◦C (Takahashi and Fukuta, 1988).
The airborne instruments PN, PHIPS-HALO, and SID-3 were located underneath the chamber within the temperature-controlled environment of AIDA. There, the instruments were installed into specific vacuum-sealed canisters in a strictly vertical orientation. These canisters have a 10 mm inner diameter stainless steel sampling tube that penetrates the chamber wall and projects into the chamber volume by about 0.2 m. Each sampling tube is equipped with a
horn-shaped inlet to minimize sampling artifacts. Within the in-strument canister, the sampling tube terminates about 10 mm in front of the sensing area of the instrument. Each canister is connected via a mass flow controller to the central vac-uum system of the AIDA facility. By applying a mass flow of typically 50 standard liters per minute (standard L min−1)
cloud particles from the chamber volume can be sampled, ac-celerated to a speed of about 10 m s−1in the sampling tube,
and measured when exiting the tube close to the sensing area of the instrument. The ice particle replicator was installed in a similar canister as the other airborne instruments but was aspirated by only 20 standard L min−1in order to get a
rea-sonable separation of the ice particle replica on the strip. The PPD-2K has a vacuum-sealed detection cell, so there is no need for installing the instrument in a separate canister. The detection cell is equipped with a focusing particle nozzle that produces a confined particle beam with a cross section of 2.5 mm2. This cross section is small enough to completely
fit into the flat rectangular laser beam cross section of the in-strument. In this way, the forward scattering intensity of all sampled particles is detected and analyzed in terms of the equivalent optical particle diameter. Further details on the in-strument design and the calibration procedure can be found in Vochezer et al. (2016).
Three different aerosol types were used in the cloud simu-lation experiments to initiate the ice formation: soot particles from a graphite spark generator (GFG 1000, PALAS) (Möh-ler et al., 2005b), Arizona Test Dust particles that were re-dispersed by a rotating brush generator (RGB 1000, PALAS)
in conjunction with impaction stages to size select the<2 µm
particles (Möhler et al., 2006), and aqueous sulfuric acid par-ticles generated in a home-built H2SO4/H2O nucleation
gen-erator (Wagner et al., 2008).
Aerosol number concentrations prior to and during the cloud expansion runs were measured with a condensation particle counter (CPC3010, TSI). Several modifications have been applied to the CPC in order to ensure reliable operation during the cloud expansion runs, i.e., at differential pressures between the sampling line and the environment of more than 500 hPa (Seifert et al., 2004). The aerosol number size distri-bution was measured with a scanning mobility particle sizer (SMPS, TSI) and an aerodynamic particle sizer (APS, TSI) (Möhler et al., 2006).
The presence of cloud particles inside the chamber is mon-itored by the laser light scattering and depolarization instru-ment SIMONE (Schnaiter et al., 2012). SIMONE measures scattered light from particles residing in the center of the chamber from near-forward (2◦) and near-backward (178◦)
directions. The backscattered light is analyzed with respect to its polarization state which facilitates the derivation of the linear depolarization ratioδl. Although SIMONE is routinely
used to detect phase transitions in aerosol and cloud parti-cle ensembles, it has recently also been used to investigate the microphysical properties of corona-producing ice clouds (Järvinen et al., 2014).
Water vapor measurements are conducted in two ways: in situ measurements by using a tunable diode laser (TDL) spectrometer (Ebert et al., 2005) to measure the interstitial water vapor mass and an extractive measurement for mea-suring the total (interstitial plus condensed) water mass. For the latter, we used a fast chilled-mirror frost-point hygrome-ter (MBW, model 373) that is located outside the insulating housing of AIDA and that is connected via a heated stainless steel tube to the chamber volume. The accuracy of the TDL and MBW measurements is±3 %. Further details on the wa-ter vapor measurements at AIDA can be found in Wagner et al. (2010) and Fahey et al. (2014).
2.2.2 Growth and sublimation cycles
A novel experimental procedure for the AIDA cloud chamber was developed in order to grow and sublimate ice particles at defined super- and subsaturated ice conditions. This proce-dure consists of the following main steps that are applied to the pre-cooled chamber. In the present work the experiments were conducted at initial chamber temperatures of−40 and −50◦C.
hu-midity conditions throughout the volume were ensured by operating the mixing ventilator of the chamber. After these preparation steps, a saturation ratio with respect to iceSiceof about 0.95±0.03 and a background
parti-cle number concentration of∼0.1 cm−3were typically
measured.
2. Aerosol addition: aerosol particles were generated by the respective aerosol generator (Sect. 2.2.1) and the aerosol flow was directed to the AIDA chamber. The AIDA particle number concentration was continuously monitored and the aerosol addition was stopped after the desired concentration had been reached. The aerosol size distribution was measured after a homogenization period of several minutes.
3. Initial cloud activation: a chamber expansion run was started by opening the valve to the vacuum pump. The suction capacity of the pump was controlled and was typically set to a value of either 60 or 80 % of the full capacity, which is 250 m3h−1. The start of the
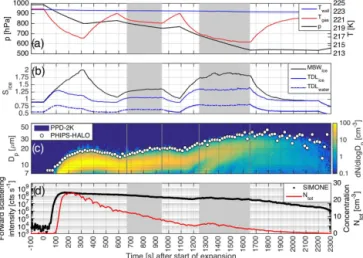
expan-sion marks the reference time of the experiment run and is given as time 0 s in Fig. 2. As a consequence of the decreasing pressure, the gas temperature decreases at nearly constant wall temperature (see Fig. 2a). The continuous increase in this temperature difference re-sults in an increase of Sice from slightly subsaturated
into supersaturated conditions (blue line in Fig. 2b). At a specific threshold supersaturation, which is dependent on the used aerosol type, ice starts to form. In our ex-periments, ice forms either by heterogeneous deposition nucleation on soot or mineral dust or by homogeneous freezing in the case of aqueous sulfuric acid. The ice for-mation onset is clearly marked by the strong increase in the SIMONE near-forward scattering signal (black line in Fig. 2d). After ice particles have been formed they grow on the expense of excess water vapor in the still supersaturated environment. Eventually, the size of the ice crystals is above the lower detection limit of 7 µm of the PPD-2K instrument, so that they are counted (red line in Fig. 2d) and sized (color plot in Fig. 2c). At the same time the PHIPS-HALO instrument started to im-age ice particles as indicated by the mean equivalent sphere diameter shown in Fig. 2c. The constant offset between the two diameters plotted in Fig. 2c is due to the fact that ice particles have a lower differential scat-tering cross section compared to liquid water droplets in the angular range of the PPD-2K and, therefore, their size is underestimated by a factor of about 1.7 (Cot-ton et al., 2010). The increasing ice water content in the chamber is also nicely reflected by the increasing difference between the total water and interstitial water mass measurements (black and blue lines in Fig. 2b). Ice crystal growth continues as long as the expansion is maintained, e.g., until 310 s after start of the expansion in the example given in Fig. 2.
Figure 2. Example of a regrowth experiment conducted in the
AIDA cloud chamber at an initial temperature of−50◦C. The ex-perimental procedure is specifically designed to grow and sublimate ice particles at defined super- and subsaturated ice conditions (solid blue line in panelb). Regrowth periods are indicated by the shaded
areas. See text for details.
4. Sublimation period: as the initial growth of the ice parti-cles depends on the specific ice nucleation properties of the aerosol used, the growth conditions in terms of su-persaturation cannot be controlled. Therefore, a subse-quent sublimation period was applied in order to remove the ice particle surface characteristics from the initial growth. For this purpose, a flow of dry synthetic air (∼40 m3h−1) was fed into the chamber immediately af-ter the expansion had been stopped, resulting in a com-pression of the chamber volume and, thus, in an increase of the gas temperature. Consequently, the ice saturation ratioSice changed from supersaturated to subsaturated
conditions due to the addition of dry air and the gas tem-perature increase (Fig. 2b). By controlling the compres-sion air flow, a defined saturation ratio can be adjusted. In the experiment shown in Fig. 2, the saturation ratio was set to about 0.8. As soon as the compression was applied, the ice particles started to sublimate as indi-cated by the decrease in the ice particle size (Fig. 2c). The ice particles were forced to sublimate for a period long enough to see a clear change of their shape and sur-face properties, but short enough not to completely sub-limate them. A sufficient particle surface processing by sublimation is indicated by the observation of oval SID-3 scattering patterns as shown in Fig. SID-3. A subsample of the scattering patterns acquired by SID-3 is displayed online by the instrument data acquisition software. A visual monitoring of these patterns is performed during the sublimation period in order to decide when the sub-limation can be stopped.
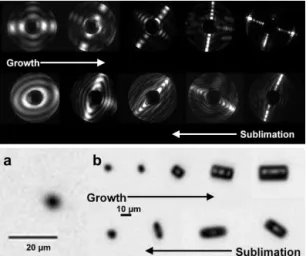
Figure 3.Evolution of SID-3 scattering patterns (upper panel) and
PHIPS-HALO micrographs (series b in the lower panel) of colum-nar ice particles collected during growth and sublimation periods in the−40◦C temperature range. Ice particle surface processing by sublimation is clearly visible by a roundening of the ice particle edges resulting in oval SID-3 scattering patterns. Note that SID-3 is capable to determine the particle shape for crystals with sizes of only 2 to 3 µm (patterns on the left side of the upper panel) whereas the imaging method used in PHIPS-HALO cannot give a clear shape information for particles smaller than about 10 µm (image a in the lower panel).
particles was started. For this purpose, the addition of compressing air was stopped followed by a controlled expansion of the chamber volume (e.g., at 580 s ex-periment time in Fig. 2). Since the basic idea of this experimental procedure was to control the ice particle grow speed, the regrowth should happen at a specific but nearly constant supersaturation (e.g., about 1.05 in case of the experiment shown in Fig. 2). For this purpose, the expansion was manually controlled by tuning the suc-tion flow, while monitoring the saturasuc-tion ratio measure-ment. Depending on the target supersaturation, suction flow tuning was applied either by using a mass flow con-troller (range up to ∼100 m3h−1) or by changing the suction capacity of the pump. In this way, the regrowth of the ice particles was conducted at a nearly constant supersaturation over periods of at least 200 s (indicated by the shaded areas in Fig. 2). Several regrowth periods at different supersaturations can be performed within one ice cloud by repeating steps (4) and (5), provided that the ice particle number concentration, which is de-creasing by sedimentation and sampling losses, is still above∼5 cm−3.
3 Results
For the present work, a total of 45 sublimation and regrowth experiments have been selected from the AIDA campaign
HALO06 (preflight test campaign for the HALO aircraft; February 2011) and the AIDA Rough ICE particle cam-paigns RICE01 (November 2012), RICE02 (May 2013), and RICE03 (December 2014).
As the water vapor mixing ratio is frequently measured inside cirrus ice clouds, the basic idea of the regrowth ex-periments was to study the dependence of the small-scale ice particle complexity on the ice saturation ratio during the growth of the crystals. Therefore, the start and end times for each regrowth period were manually determined by examin-ing the time curve ofSice(blue line in Fig. 2b) and
identify-ing those periods whereSice showed a plateau (as indicated
by the shaded areas in Fig. 2). The results of the single parti-cle scattering pattern analysis were then statistically analyzed for these regrowth periods. As already mentioned, only scat-tering patterns within a narrow mean brightness (grey level) range from 10 to 25 were considered as valid patterns in this statistical analysis. Periods that had less than 100 valid scat-tering patterns were excluded from the study. For the same time periods,Sice was averaged to determine the mean ice
saturation ratio, to which the ice crystals had been exposed during their regrowth.
The result of this analysis is shown in Fig. 4. Experiments that were started at initial temperatures of−40 and−50◦C are given as black and grey symbols, respectively. Note that the 1σ error bars given forSicerepresent the variations that
are due to the manual control of the pumping speed in order to keep a constant saturation ratio. The median complexity parameterkee clearly increases with increasing
supersatura-tion in the case of the−50◦C experiments, and this trend is even steeper for the experiments that were conducted at an initial temperature of−40◦C. As for a given supersatura-tion the available condensable water mass is increasing with increasing temperature, the ice particles will grow faster at warmer temperatures, and, consequently, more defects in the crystal lattice are expected. Ice particle habits and growth rates were measured in the laboratory by Bailey and Hal-lett (2004) for ice particles grown on thin glass wires over a broad temperature range from−20 to−70◦C. They clearly observed faster growth rates with higher supersaturations and warmer temperatures. At−50◦C and for supersaturations of 20 and 40 %, growth rates of about 0.035 and 0.07 µm s−1,
Figure 4.Median ice crystal complexity parameterkeededuced from
SID-3 scattering patterns that were measured in simulated cirrus clouds at the AIDA cloud chamber. The ice clouds were grown at different ice saturation ratiosSiceand at initial chamber tempera-tures of−40◦C (black symbols) and−50◦C (grey symbols). Three different aerosol types were used to nucleate ice by heterogeneous nucleation on soot (circles) and mineral dust (stars) as well as by homogeneous nucleation in aqueous sulfuric acid particles (trian-gles).
complexity was already observed at supersaturations around 10 %.
3.1 Correlation betweenkfeand the available condensable water vapor mixing ratioξvacw
The previously discussed results by Bailey and Hallett (2004) as well as our own results from the optical imaging of laboratory-grown ice particles indicate that the available con-densable water mass is the driving factor for the crystal growth rate and finally the crystal complexity. Although these studies do not give insight into the ice particle sur-face properties (except the observed (stepped) hollowness; Fig. 5), it is reasonable to assume that a high ice particle growth rate also results in the formation of surface complex-ity, like surface roughness and stepped hollowness. There-fore, the ice saturation ratio plotted in Fig. 4 for the−40 and −50◦C experiments was converted into the available con-densable water vapor mixing ratioξvacwgiven on thexaxis in
Fig. 6. In this approach,ξvacwwas calculated as the difference
between the measured interstitial water vapor mixing ratioξv
and the saturated mixing ratioξvsfor the given pressure and
temperature conditions inside AIDA. ξvs was thereby
calcu-lated based on the parametrization of the ice vapor pressure by Murphy and Koop (2005). ξvacw therefore represents the
mixing ratio of excess water molecules that can deposit to the solid ice face. This way of representing the SID-3 crystal complexity data results in a combined correlation between e
ke andξvacw for the−40 and−50◦C experiments. Figure 6
Figure 5.Ice particle replicas generated in the regrowth period of
RICE01_27 at a temperature around−55◦C and an ice supersatu-ration of 19 %. The particle habit distribution is a mixture of solid and hollow columns as well as small rosettes (left). Hollow rosette with a maximum dimension of about 35 µm (upper left). Although stepped hollowness is difficult to see with the replication method on small ice crystals, it can be identified in cases when the ice par-ticle was ideally replicated (upper right image). Scanning electron micrograph of a rosette replica showing that in general the ice par-ticle surface properties (including stepped hollowness) are masked by the Formvar replication method (lower right).
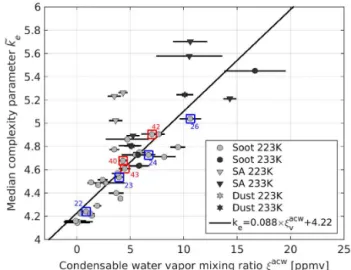
Figure 6. Median ice crystal complexity parameter kee plotted
against the condensable water vapor mixing ratio that was available during the regrowth of the ice particles.
confirms the assumption that the ice crystal growth rate also controls the small-scale ice particle complexity. The corre-lation can be quantified by fitting a simple linear regression model to the data which gives a least square functional de-pendency of
e
ke=0.088×ξvacw+4.22, (2)
withξvacwgiven in ppmv.
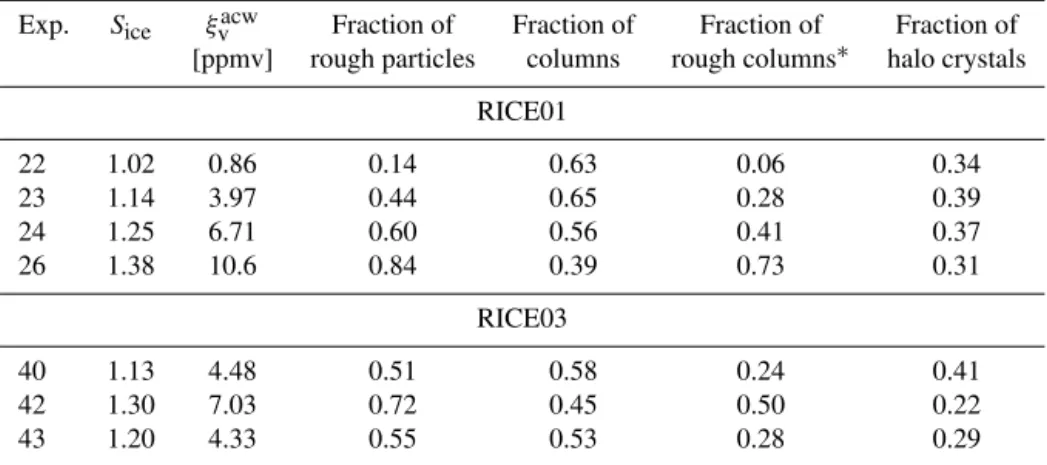
small-Table 1.Results of the particle fraction analysis for those experiments of the RICE01 and RICE03 campaign that are labeled, respectively, in blue and red in Figs. 4 and 6. All experiments where conducted at an initial temperature of−50◦C and with soot particles as heterogeneous ice nuclei.
Exp. Sice ξvacw Fraction of Fraction of Fraction of Fraction of [ppmv] rough particles columns rough columns∗ halo crystals
RICE01
22 1.02 0.86 0.14 0.63 0.06 0.34 23 1.14 3.97 0.44 0.65 0.28 0.39 24 1.25 6.71 0.60 0.56 0.41 0.37 26 1.38 10.6 0.84 0.39 0.73 0.31
RICE03
40 1.13 4.48 0.51 0.58 0.24 0.41 42 1.30 7.03 0.72 0.45 0.50 0.22 43 1.20 4.33 0.55 0.53 0.28 0.29
∗Ratio of the number of rough columns to the number of all columns.
scale crystal complexity or surface roughness and not the type of ice nucleus. There is one exception, however: the re-growth experiments conducted at an initial temperature of −50◦C and using homogeneous nucleation in aqueous sul-furic acid particles to initiate the ice cloud (grey triangles in Fig. 6). These experiments result in higher kee values
com-pared to the corresponding experiments with heterogeneous initial ice formation on soot (circles) or dust (stars) as well as homogeneous initial nucleation at−40◦C (black triangles). This indicates a “memory” effect in the ice crystal com-plexity for homogeneous nucleation at colder temperatures. A possible explanation for this observation could be the for-mation of concentrated H2SO4/H2O residuals on the ice
crystal surface, which affects the regular crystal growth. Such a separation into solid ice and unfrozen residual solution was observed by calorimetric measurements on aqueous H2SO4
droplets in the cirrus temperature range 190< T <230 K
(Bogdan et al., 2006; Bogdan, 2006). Although emphasized by the authors, the formation of a complete H2SO4/H2O
coating of the crystal surface was not unambiguously proven by these studies. However, the formation of such coatings can have significant consequences for the ice particle growth rate and the persistence of ice supersaturations in cirrus clouds (Bogdan and Molina, 2009). Further studies with homoge-neously nucleated ice particles are necessary to investigate the impact of unfrozen H2SO4/H2O residuals on the
small-scale ice crystal complexity.
3.2 Discussion of specific ice particle fractions
Table 1 gives examples of the SID-3 pattern analysis re-sults for the regrowth experiments labeled in blue and red in Figs. 4 and 6. The fraction of rough particles is thereby calculated by setting a threshold valuekethrof 4.6 and
clas-sifying all particles below this threshold as smooth (exam-ples given in Fig. 1a, b) and all particles equal and above as
rough (examples given in Fig. 1c, d). The fraction of colum-nar ice particles is calculated from a fast Fourier transfor-mation of the polar integrated azimuthal intensity profile of the patterns according to the description given in Vochezer et al. (2016). While the fractions of rough particles and rough columns are clearly correlated withSiceandξvacw, the fraction
of columns stays rather constant at a value around 0.6 up to ice saturation ratios of about 1.15 followed by a significant decrease for higher supersaturations. This observation can be explained by the formation of hollow columns and rosettes at an onset saturation ratio between 1.15 and 1.2 which re-sults in a distorted or changed symmetry in the correspond-ing light scattercorrespond-ing patterns. Another result from Table 1 is the behavior of the fraction of those crystals that have indi-cations of a 22◦halo in the scattering pattern. This fraction is
deduced by a visual inspection of each individual valid scat-tering pattern for intensity spots around 22◦that are clearly
contrasted from surrounding pixels. Interestingly, this parti-cle fraction is not depending onSiceorξvacwbut is, except for
experiment 42 from RICE03, rather constant within the nar-row range between 30 and 40 %. For the interpretation of this result one has to keep in mind that the pixels in the 22◦halo
spot are always saturated due to the limited dynamic range of the ICCD camera of 8 bit. Therefore, the true intensity in the halo spot is unknown and, thus, it cannot be concluded from the fraction of halo particles whether and how strong a 22◦
halo would appear in the ice cloud. Even if it is unlikely that an ice cloud with roughened ice crystals would show a halo feature, it has to be kept in mind that there is always a signif-icant fraction of the (small) hexagonal ice columns that show the 22◦halo feature in the SID-3 scattering patterns also for
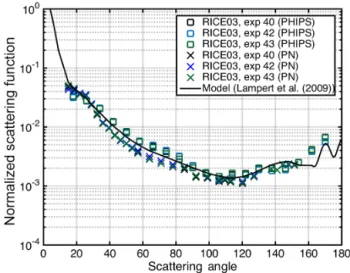
3.3 Angular light scattering functions
For the three experiments from RICE03 labeled in red in Figs. 4 and 6 and listed in Table 1, polar scattering functions were measured by the polar nephelometers PN and PHIPS-HALO and are plotted in Fig. 7. The individual scattering functions given in Fig. 7 are mean values of all valid par-ticle scattering functions measured during the regrowth pe-riods. A valid particle scattering function has (i) an intensity above the background level for each individual angular chan-nel and (ii) no saturated chanchan-nels. Scattering functions that do not fulfil these criteria were removed from the analysis. A mean background intensity is deduced for each individual channel and is subtracted from the valid particle scattering functions before averaging. In the case of the PHIPS-HALO instrument, channel crosstalk and sensitivity characteristics are taken into consideration by applying a correction matrix to the mean scattering function. See Jourdan et al. (2003) for a description of the channel correction in the case of the PN instrument. After this, the resulting mean particle scattering function is normalized so that its integral over the instrumen-tal angular range equals 1.
Although there are systematic deviations in the normalized scattering functions deduced from the PN and PHIPS-HALO measurements, both instruments agree in the following ob-servations:
i. the measured scattering functions show only minor changes from experiment to experiment
ii. the scattering functions are rather flat and featureless with no clear indications of a 22 or 46◦halo
iii. there are some indications of a slight ice bow-like fea-ture in the 130 to 150◦angular range.
Observations (i) and (ii) can be interpreted as the result of crystal complexity that randomizes spatial light scattering to a sufficient degree so that shape-dependent features, like halo features, are removed from the polar scattering func-tion resulting in a flat funcfunc-tion with no significant variafunc-tions for the different experiments. Interestingly, the polar scat-tering function is rather insensitive over a range of ice par-ticle growth conditions where the SID-3 method still sees significant differences in the small-scale complexity param-eter kee (cf. Fig. 6). Although the particle scattering
func-tions for very lowkee values have not been measured, these results might indicate that after a certain crystal complex-ity is induced the angular light scattering function is insensi-tive to further increases in this complexity. The correspond-ing threshold in terms of Sice is quite low and around 1.1
for the ice clouds grown in the−50◦C temperature range. In terms of the temperature-independent condensable water va-por mixing ratioξvacw, this threshold is about 4.3 ppmv.
How-ever, further analyses of the scattering functions in the differ-ent phases of the experimdiffer-ent runs are necessary to come to
Figure 7.Mean angular scattering functions measured in the
re-growth periods of those ice cloud experiments of RICE03 that are labeled in red in Figs. 4 and 6. Two polar nephelometers were deployed in these experiments: the airborne approved polar neph-elometer from Clermont-Ferrand (PN, crosses) and the novel in-strument PHIPS-HALO from KIT (squares).
a final conclusion on the sensitivity of the light scattering functions to the small-scale ice particle complexity.
Observation (iii) indicates a minor influence from regular or near-spherical ice crystals on the angular light scattering function of the ice clouds (Baran et al., 2012). A similar fea-tureless scattering function with a slight indication of an ice bow-like feature was measured by the PN in a case study of a mid-level Arctic ice cloud (Lampert et al., 2009). A particle mixture composed of deeply roughened hexagonal columns and smooth ice spheres was necessary to represent this ob-servation. The corresponding angular scattering function of this particle model has an asymmetry parameterg of 0.78
and is plotted as solid line in Fig. 7. A very good agreement between the modeled and measured scattering functions is found, which is astonishing given that the modeled func-tion is retrieved for an Arctic mid-level (not cirrus) cloud at a mean temperature of −24.3◦C. Here, it is important to note that the measurements do not cover the forward and backward angular ranges and, therefore, also other scattering function models with different asymmetry parameters likely can fit the measurements. Further modeling work is neces-sary that uses the measured particle size distribution in con-junction with the shape information from the PPD-2K, SID-3 and PHIPS-HALO measurements to constrain the ice parti-cle microphysical scheme in the iterative inversion method that was used in Lampert et al. (2009) and detailed in Os-hchepkov et al. (2000) and Jourdan et al. (2003). Only such an inversion analysis would result in a more reliable model scattering function and asymmetry parameter.
laboratory-generated ice clouds in the −50◦C temperature range with a scattering function retrieved for an Arctic mid-level cloud indicates that the above discussed small-scale complexity threshold for a rather insensitive scattering func-tion might be of general nature and also valid for natural ice clouds. In conjunction with the main finding of our study, namely a fast developing ice particle complexity with super-saturation conditions, this indicates some important conse-quences for the light scattering properties of atmospheric ice particles that will be discussed in the following section.
4 Atmospheric implications
In the present study the ice supersaturation with temperature, i.e., the available condensable water vapor ξvacw, was
iden-tified as the main driving factor for the formation of small-scale ice crystal complexity. This factor has a low threshold value of 4.3 ppmv for the growth of ice particles with a suffi-cient degree of crystal complexity. A strong randomization of the light scattering is the consequence of this complexity re-sulting in a featureless cloud angular scattering function that is insensitive to further changes in the growth conditions. So, the question is how frequently such threshold conditions can be found in cirrus clouds in order to draw conclusions on the role of ice crystal complexity for the short-wave radiative properties of these clouds.
In a study by Krämer et al. (2009) in situ water vapor data from Arctic, midlatitude, and tropical cirrus were an-alyzed and discussed in terms of the frequency of supersatu-rated conditions inside cirrus clouds. The authors found fre-quency distributions of the ice saturation ratio Sice that are
symmetrically distributed around a peak value close to 1 for the 200< T < 240 K temperature range. Although high
su-persaturations up to the homogeneous freezing level were measured, information of the growth history can hardly be deduced from these data as the supersaturation quickly re-laxes after a sufficient amount of ice particles have been nu-cleated. However, by applying a simple box model and as-suming homogeneous nucleation, their modeled ice number concentrations agree well with the measured concentrations for reasonable updraft speeds indicating that the formation and growth pathway of the young cirrus particles could in-deed started from high supersaturations.
In the Interhemispheric Differences in Cirrus Properties from Anthropogenic Emissions (INCA) experiment, ice satu-ration ratio-dependent cloud-present fractions were deduced from in situ particle measurements in northern and south-ern midlatitude cirrus (Ström et al., 2003). Cirrus ice par-ticle formation onsets were estimated by the interpretation of local minima in these fractions to be a consequence of the reduced detection efficiency of the cloud particle instru-ments in case of recently nucleated cirrus particles. Follow-ing this interpretation, the cirrus clouds were preferentially formed in theSicerange between 1.4 and 1.55 and slightly
be-low 1.3 for the Southern and Northern Hemisphere, respec-tively. It was suggested that this difference in the freezing thresholds is an effect of the different pollution levels in both hemispheres resulting in homogeneous ice nucleation as the dominant freezing mechanism in the relatively clean South-ern Hemisphere and heterogeneous nucleation in the more polluted Northern Hemisphere (Haag et al., 2003). By tak-ing into consideration that the frequency distribution of mea-sured in-cloud temperatures during INCA was between−30 and−60◦C with a maximum at about−50◦C (Gayet et al., 2004), the ice particles nucleated and grew in an ice supersat-urated environment that forces significant crystal complexity according to the chamber results shown in Fig. 4. In con-junction with the discussion of the light scattering data given in Sect. 3, it can be expected that the cirrus clouds probed during INCA should have angular scattering functions with (i) no indications of a 22◦ halo and (ii) an asymmetry
pa-rameterg with only little variations in hemispheric as well
as interhemispheric comparisons. Both expectations were in-deed confirmed by in situ PN measurements during INCA by Gayet et al. (2004). Based on a statistical analysis of angu-lar scattering functions measured in the Northern and South-ern Hemisphere, a very stable asymmetry parameter was de-duced ranging from 0.76 to 0.78 with almost no differences in the mean values for the Northern (0.767) and Southern (0.770) Hemisphere. Only about 3 % of all measured scatter-ing functions showed a 22◦halo feature, also with no
signifi-cant differences between the northern and southern measure-ments. It was concluded that the angular particle scattering properties give no indications on privileged ice nucleation mechanisms in the two hemispheres, although it was indi-cated from the freezing onset analysis. Here it is important to note that even though it was ruled out by the authors, the results might be partially affected by ice particle shattering on the probe tips and inlets.
In a case study of a semi-transparent midlatitude cirrus, Baran et al. (2015) analyzed angular-dependent radiometric measurements from the PARASOL satellite in order to link the shape of the back-hemispheric angular scattering func-tion to the relative humidity (RHi) field predicted by a nu-merical weather model. Even though their data set was not statistically sufficient to find a strong correlation, the au-thors observed the tendency that cloud regions exhibiting an ice bow feature were more associated with low RHi values, while regions with no features in the backscattering angular scattering function were associated to RHivalues larger than about 115 %.
Both of the above observations are in accordance with the findings of the present paper where also no significant differ-ences in the angular light scattering properties could be iden-tified for growth conditions above aboutSi=1.1, although significant differences in the complexity parameterkee were
con-ditions that were high enough to produce significant crystal complexity, irrespective of the ice nucleation mechanism. In addition to the SID-3 laboratory results, there are indications from airborne SID-3 measurements that the GLCM speckle analysis method might be sensitive to the nucleation mech-anism (homogeneous or heterogeneous) in ice clouds com-posed of complex ice particles (Ulanowski et al., 2014).
5 Conclusions
In this paper the origin of small-scale ice crystal complexity and its consequences for the angular light scattering prop-erties of cirrus clouds were investigated in specific cloud chamber experiments performed in the−40 to−60◦C tem-perature range. The particle surface complexity was deduced from highly resolved angular light scattering patterns of sin-gle ice particles measured by the latest version of the SID-3. Similar to the previous work by Ulanowski et al. (2014), a speckle texture analysis was developed based on the GLCM as part of the SID-3 scattering pattern analysis package (Vochezer et al., 2016). It was found that the normalized energy feature parameter ke of the GLCM is the most
ro-bust measure of small-scale crystal complexity. The angu-lar light scattering function of the laboratory-generated ice clouds was measured by the two currently available airborne polar nephelometers PN and PHIPS-HALO.
A new experimental procedure was applied at the AIDA cloud chamber to regrow ice particles at defined ice satura-tion levels after the crystal surface properties from the initial nucleation and growth phases have been removed in a sub-limation period. The nucleation of ice particles was initi-ated by using three different aerosol types: soot particles and mineral dust for heterogeneous ice nucleation as well as sul-phuric acid particles for homogeneous nucleation. For 45 sta-ble regrowth periods, the median crystal complexity parame-terkeewas deduced from the individual SID-3 scattering
pat-terns. Averaged angular light scattering functions were de-duced from the polar nephelometers for three regrowth peri-ods.
From the experimental results the following main conclu-sions can be drawn.
– There is a clear correlation between the small-scale crystal complexity deduced from the SID-3 measure-ments and the volume mixing ratio of available con-densable water vaporξvacw. The correlation could be
fit-ted by a simple linear functional dependence given in Eq. (2).
– The small-scale particle complexity that develops dur-ing the crystal (re)growth is not influenced by the type of heterogeneous ice nucleus inside the crystal. How-ever, there are indications for a memory effect in the case of homogeneous nucleation in aqueous sulphuric acid particles.
– There are no significant differences in the measured an-gular light scattering functions of ice clouds that were regrown atξvacw>4 although significant differences in e
ke were deduced from the SID-3 data. This indicates
threshold conditions for the small-scale particle com-plexity leading to an insensitive cloud scattering phase function. The measured functions are featureless and flat in the side and backward scattering directions. These results have significant implications for the radiative transfer through cirrus clouds as water vapor measurements indicate that the growth of cirrus ice particles starts at satu-ration ratios that are usually above the threshold conditions for the formation of small-scale complexity. Furthermore, ice particles with a high degree of small-scale complexity can be expected if the crystals were homogeneously nucle-ated because (i) the growth starts at high supersaturations and (ii) there are indications that concentrated H2SO4/H2O
residuals on the ice crystal surface affects further crystal growth. A prevailing ice crystal complexity in cirrus clouds would result in a low asymmetry parameter g and,
con-sequently, in a stronger solar albedo effect. The presented chamber results indicate that for typical growth condition rather low variations ingare expected. However, combined
in situ measurements with SID-3 and PHIPS-HALO (or PN) in cirrus clouds that were formed under different thermody-namic conditions are necessary to prove these conclusions. Such data are available from the HALO aircraft campaigns Midlatitude Cirrus (ML-CIRRUS) and Aerosol, Cloud, Pre-cipitation, and Radiation Interactions and Dynamics of Con-vective Cloud Systems (ACRIDICON-CHUVA). The results of these measurements will be the subject of forthcoming publications.
Data availability
Appendix A: Characterization of the normalized energy feature parameterke
The conclusion given by Lu et al. (2006) that ke is the
most robust GLCM feature to quantify surface roughness was checked for the SID-3 set-up by the following proce-dure. An analogue ice particle aggregate with severely rough-ened surfaces was placed on a thin polycarbonate window with anti-reflective coating. See Krasinski et al. (2007) for a description of how these ice analogue particles can be pro-duced in the laboratory. After a visual inspection of the ana-logue aggregate under the optical microscope (left image of Fig. A1), the sample particle was moved into the sensitive area of SID-3 and was fixed at this position. While the in-strument was forced to continuously trigger, the laser power was varied from a few milliwatts to its maximum power of 100 mW. In this way a series of SID-3 patterns was acquired for the same particle at the same orientation but for differ-ent laser intensities (see right image of Fig. A1 for an ex-ample). The latter variation results in images with different brightnesses. In a final step, the GLCM features ke, energy,
and combined roughness were statistically analyzed for dif-ferent grey-level ranges. The result of this analysis is given in Table A1. The test clearly shows thatke is the most
ro-bust GLCM feature also in the case of quantifying ice crystal complexity with SID-3.
Figure A1.Microscopic image of an ice analogue aggregate with
rough surface residing on a polycarbonate window (left). The sodium fluorosilicate crystals can grow to hexagonal morphologies similar to water ice crystals. The fact that their refractive index is close to water ice makes them well suited for light scattering inves-tigations (Ulanowski et al., 2003, 2006). The crystal was moved into the sensitive area of SID-3 where scattering patterns were acquired (right).
Table A1.Relative 1σstandard deviations of the three GLCM
fea-tureske, energyE, and combined roughness. The SID-3 patterns
were acquired on the analogue ice particle shown in Fig. A1. The GLCM speckle texture analysis was restricted to three different grey-level ranges.
Grey-level ke Energy Combined
range E roughness
Appendix B: Modeling SID-3 scattering patterns of deformed particles
The problem of electromagnetic scattering is here treated through the DDA approach. We make use of the GDT-matrix code (Tricoli et al., 2015) developed to simulate the SID-3-like forward scattering pattern (the electromagnetic field is calculated in an annulus between 5 and 25◦ in the forward
direction). In order to increase the upper bound of the size parameter that can be modeled, we use the publicly available code ADDA (Yurkin and Hoekstra, 2012) to calculate itera-tively the inverse of the interaction matrix. The convergence is checked through comparisons of the phase functions ob-tained with ADDA and with Mie theory for the equivalent sphere. We find that for a refractive index of m=1.32, it
is possible to stabilize the iterative solver in ADDA using at least 1.5 millions of dipoles (i.e., at least 10 dipoles per wave-length). In this way we are able to simulate ice particles up to a size parameter ofx=50 (corresponding to a particle of equivalent radius of about 4 µm). Then, exploiting the equiv-alence of the transition matrix with the inverse of the interac-tion matrix, we import this matrix into the GDT-matrix code in order to reproduce the output format required for the SID-3 analysis algorithm. In fact, the square modulus of the electric field is calculated for the given forward scattering annulus and it is then plotted on a plane of 780×582 pixels. The sim-ulated wavelength corresponds to the SID-3 laser beam, i.e., 532 nm. In order to be able to apply the GLCM method, the output intensity plot is saved as 8 bit grey-scale JPEG files. The mean intensity of the generated JPEG pictures is then rescaled to 20 (in order to be comparable with the bright-ness range restrictions used in the analysis as described in Sect. 2.1.2). We apply this method to deformed spherical particles. These shapes are generated through the publicly available software called Siris, described in Muinonen et al. (1996) and freely available from Muinonen and Nousiainen (2003). To reproduce shapes like the one depicted in Fig. 5 (lower right corner) we chose a power law description of the correlation function. The power law index for the correlation coefficient is set to 3. We chose a minimum polynomial or-der of 2 and a maximum of 10 (for larger minima the shape has more small-scale deformations). Then we vary the rela-tive standard deviation of the radial distance (σ) from 0.02
to 0.5. The generated shapes are represented in Fig. B1 (all simulated intensity patterns are calculated for a fixed size pa-rameter ofx=46).
It is clearly seen that for smallσthe simulated SID-3
pat-terns show only slight deviations from the regular concentric rings expected from diffraction theory for a smooth sphere. In contrast, for large deformations (e.g.,σ=0.3) the patterns
show speckles. The largerσthe smaller the speckle intensity
spots in the pattern. The same is also observed for a fixed
Figure B1.Distorted spherical ice model particles with different
deformation parametersσ, effective densitiesρe, and area ratiosα that were used in the ADDA/GDT-matrix approach (upper panel). All input model particles have a fixed size parameter of 46. Cor-responding 8 bit grey-scale output patterns (lower panel). Theke
values of the GLCM analysis are given below each pattern.
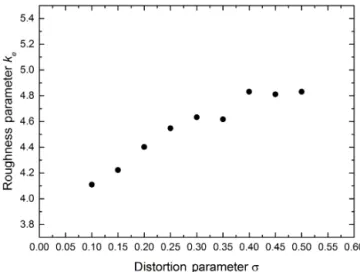
Figure B2.Dependence of the crystal complexity parameterkeon
the distortion parameterσfor the model particles shown in Fig. B1.
σand increasing size parameter (not shown). Thus,σ
repre-sents a microphysical shape parameter used to describe the degree of deformation (relative to the smooth sphere). In-terestingly, by applying the GLCM method to the simulated patterns, the relative standard deviation of the radial distance (σ) can be related to the normalized energy feature
parame-terke(see Fig. B2). A linear relation is obtained betweenσ
andke up to deformations of aboutσ=0.5 whereke starts
to saturate. Although Fig. B2 shows a clear correlation, more such calculations are necessary to investigate the dependence ofkeon the small-scale complexity of faceted ice crystals. It
is envisaged to do these calculations in future with the goal to develop a calibration of the small-scale crystal complexity parameterke against the physical ice crystal surface
Appendix C: Growth rate analysis
In RICE01, the ice particle morphological parameters and their frequencies of occurrence have been measured by the PHIPS imager as functions of temperature, ice saturation ra-tio (Sice), and pressure. Figure C1 shows an example result
for the regrowth experiment RICE01_27 started at an ini-tial temperature of −50◦C. Figure C1a shows the pressure and temperature inside AIDA during the expansion. The ice saturation ratioSice is presented in Fig. C1b, and Fig. C1c
gives the evolution of the particle equivalent diameter dur-ing the initial growth (I) and the regrowth (II) phases of the experiment. The AIDA atmospheric conditions forced the generation of two main habit types (compact particles and columns) which could be classified by the imaging sys-tem of PHIPS-HALO as well as the replicator strip analysis (Fig. 5). The temporal evolution of the particle equivalent diameters shows quasi-linear increases of the particle dimen-sion during the phases of near-constant ice supersaturation conditions (indicated in yellow in Fig. C1). These periods were later used to calculate the particle growth rate. The re-growth at Sice≈1.2 (phase II) resulted in the formation of
hollow columns that were observed in this phase (sample im-ages in Figs. C1 as well as 5). In other experiments at higher
Sice, even more complex deformations were observed due
to the fast growth of the crystals. Finally, Fig. C1d shows the fraction of columnar particles deduced from the PHIPS-HALO images. It shows that the column fraction increased with time, which is due to a size-dependent shape classifi-cation for particles in this size range. However, at the final stage of phase II, a column fraction of 0.4 to 0.5 was de-duced, which is close to 0.58 inferred from the SID-3 pat-terns analysis. After phase II, there is a period (starting at 1500 s) where the temperature increased andSicedecreased.
At this stage the particles started to sublimate at ice subsatu-rated conditions, resulting in the formation of rounded parti-cle edges that could be parti-clearly observed in the PHIPS-HALO images of the columnar ice crystals in this stage (see images in Figs. C1c and 3). Interestingly, the sublimation process re-sults in a scatter of the deduced column fraction in Fig. C1d. Along a series of AIDA expansions during RICE01, dif-ferentSicevalues were produced at the same temperature to
study the influence ofSiceon the particle growth rate at
con-stant temperature. TheSice value was kept constant for
cer-tain time in each expansion to allow sufficient crystal growth. The growth rates of thecaxis,aaxis, and equivalent
diame-ter of the columnar ice particles were deduced for four differ-entSiceregrowth experiments conducted at the same
temper-ature (−56◦C). The results are shown in Fig. C2. In agree-ment with the results from Bailey and Hallett (2004), the growth rates correlate with the ice supersaturation. However, Bailey and Hallett (2004) deduced a linear dependence of the maximum particle dimension with supersaturation while our results rather indicate an exponential dependence. This can be attributed to the different experimental procedures
ap-Figure C1.Temporal evolution of the AIDA cirrus cloud
exper-iment RICE01_27. (a) Gas temperature and pressure inside the
AIDA chamber.(b)Ice saturation ratioSice inside the AIDA vol-ume. (c) Geometric particle diameters as measured by
PHIPS-HALO.(d)Column ratio during the experiment.