HESSD
8, 111–150, 2011Soil buffer limits flash flood response to extraordinary rainfall
C. C. Brauer et al.
Title Page
Abstract Introduction
Conclusions References
Tables Figures
◭ ◮
◭ ◮
Back Close
Full Screen / Esc
Printer-friendly Version
Interactive Discussion
Discussion
P
a
per
|
Dis
cussion
P
a
per
|
Discussion
P
a
per
|
Discussio
n
P
a
per
|
Hydrol. Earth Syst. Sci. Discuss., 8, 111–150, 2011 www.hydrol-earth-syst-sci-discuss.net/8/111/2011/ doi:10.5194/hessd-8-111-2011
© Author(s) 2011. CC Attribution 3.0 License.
Hydrology and Earth System Sciences Discussions
This discussion paper is/has been under review for the journal Hydrology and Earth System Sciences (HESS). Please refer to the corresponding final paper in HESS if available.
Soil bu
ff
er limits flash flood response to
extraordinary rainfall in a Dutch lowland
catchment
C. C. Brauer1, A. J. Teuling1,*, A. Overeem1,**, Y. van der Velde1,2, P. Hazenberg1, P. M. M. Warmerdam1, and R. Uijlenhoet1
1
Hydrology and Quantitative Water Management Group, Wageningen University, The Netherlands
2
Soil Physics, Ecohydrology and Ground Water Management Group, Wageningen University, The Netherlands
*
formerly at: Institute for Atmospheric and Climate Science, ETH Zurich, Switzerland
**
now at: Royal Netherlands Meteorological Institute, De Bilt, The Netherlands
Received: 17 December 2010 – Accepted: 22 December 2010 – Published: 11 January 2011 Correspondence to: C. C. Brauer ([email protected])
HESSD
8, 111–150, 2011Soil buffer limits flash flood response to extraordinary rainfall
C. C. Brauer et al.
Title Page
Abstract Introduction
Conclusions References
Tables Figures
◭ ◮
◭ ◮
Back Close
Full Screen / Esc
Printer-friendly Version
Interactive Discussion
Discussion
P
a
per
|
Dis
cussion
P
a
per
|
Discussion
P
a
per
|
Discussio
n
P
a
per
|
Abstract
On 26 August 2010 the eastern part of The Netherlands and the bordering part of Germany were struck by a series of very heavy rainfall events lasting for more than a day. Over an area of 740 km2 more than 120 mm of rainfall was observed in 24 h. This extreme event resulted in local flooding of city centres, highways and agricultural
5
fields, and considerable financial loss.
In this paper we report on the unprecedented flash flood triggered by this exception-ally heavy rainfall event in the 6.5 km2 Hupsel Brook catchment, which has been the experimental watershed employed by Wageningen University since the 1960s. This study aims to improve our understanding of the dynamics of such lowland flash floods.
10
We present a detailed hydrometeorological analysis of this extreme event, focusing on its synoptic meteorological characteristics, its space-time rainfall dynamics as ob-served with rain gauges, weather radar and a microwave link, as well as the measured soil moisture, groundwater and discharge response of the catchment.
At the Hupsel Brook catchment 159.5 mm of rainfall was observed in 24 h,
corre-15
sponding to an estimated return period in the order of 6000 years. As a result, dis-charge at the catchment outlet increased from 4.4 l s−1 to nearly 5 m3s−1 (i.e. a
spe-cific discharge of 0.77 m3s−1km−2, or 2.8 mm h−1). Within 7 h discharge rose from 50
to 4.5 m3s−1.
The catchment response can be divided into four phases: (1) soil moisture reservoir
20
filling, (2) groundwater response, (3) surface depression filling and surface runoffand (4) backwater feedback. The first 35 mm of rainfall were stored in the soil without a sig-nificant increase in discharge. Relatively dry initial conditions (in comparison to those for past discharge extremes) prevented an even faster and more vigorous hydrological response.
HESSD
8, 111–150, 2011Soil buffer limits flash flood response to extraordinary rainfall
C. C. Brauer et al.
Title Page
Abstract Introduction
Conclusions References
Tables Figures
◭ ◮
◭ ◮
Back Close
Full Screen / Esc
Printer-friendly Version
Interactive Discussion
Discussion
P
a
per
|
Dis
cussion
P
a
per
|
Discussion
P
a
per
|
Discussio
n
P
a
per
|
1 Introduction
Flash floods, defined here as extreme floods generated by intense precipitation over rapidly responding catchments, have recently drawn increased attention, both from the scientific community and from the media. Their often devastating consequences, both in terms of material damage and loss of life, have triggered a number of European
5
research projects (e.g. FLOODsite, HYDRATE, and IMPRINTS) to study the meteoro-logical causes and hydrometeoro-logical effects of such events. Examples of such studies are reported in the recent publications by Smith et al. (1996), Ogden et al. (2000), Gaume et al. (2003), Gaume et al. (2004), Delrieu et al. (2005) and Borga et al. (2007).
From the perspective of water management and early warning, one of the main
chal-10
lenges posed by the phenomenon of flash floods is the extremely rapid response times of many of the catchments involved (as short as 10 min for certain small urban water-sheds in mountainous environments). The consequence of these short lead times is that hydrological forecasting systems for regions with catchments prone to flash floods must rely heavily on meteorological forecasts, either from radar-based
short-15
term precipitation forecasting (nowcasting) or from numerical weather prediction. Im-proved forecasting and early warning of flash floods is crucial, because the extreme discharges associated with such events (maximum specific discharges can reach tens of m3s−1km−2) can have devastating societal consequences.
Typically, a timescale of a few hours is used to distinguish a flash flood from a regular
20
flood. Since runoffgeneration is faster in mountainous catchments with steep slopes than in lowland catchments and since orography can impact the magnitude of rainfall extremes (Miglietta and Regano, 2008), most flash-floods occur in mountainous areas. However in case of extreme rainfall, rapid runoffgeneration due to overland flow can also trigger flash floods in lowland catchments (Van der Velde et al., 2010).
25
HESSD
8, 111–150, 2011Soil buffer limits flash flood response to extraordinary rainfall
C. C. Brauer et al.
Title Page
Abstract Introduction
Conclusions References
Tables Figures
◭ ◮
◭ ◮
Back Close
Full Screen / Esc
Printer-friendly Version
Interactive Discussion
Discussion
P
a
per
|
Dis
cussion
P
a
per
|
Discussion
P
a
per
|
Discussio
n
P
a
per
|
to weeks). However, heavy rainfall events and the associated local flooding do occur in The Netherlands (Monincx et al., 2006). In addition, the magnitude of 24-h rainfall extremes that can trigger such flooding is expected to increase in a warmer climate (Kew et al., 2010). Thus, an improved understanding of the hydrological processes involved in the response of both natural and man made (polder) catchments to local
5
heavy rainfall is needed to support water management in lowland areas.
In this paper we report on the flash flood triggered by an exceptionally heavy rainfall event on 26 August 2010 that occurred exactly over the 6.5 km2 Hupsel Brook catch-ment, which has been the experimental watershed employed by Wageningen Univer-sity since the 1960s.
10
The catchment and used data will be described in Sect. 2. We present a detailed analysis of the synoptic meteorological situation leading to the event (Sect. 3.1), the rainfall accumulations as measured by rain gauges, weather radar, and a microwave link (Sects. 3.2 and 3.3) and the extreme value statistics of the rainfall accumulation (Sect. 3.4). The soil moisture, groundwater and surface water response within the
15
catchment will be described in Sects. 4.1–4.3. We present a dissection of the observed hydrological response into a sequence of contrasting regimes that characterize the storage and discharge dynamics of the catchment following this extraordinary rainfall event (Sect. 5). Finally we present our conclusions (Sect. 6)
2 Hupsel Brook experimental catchment
20
2.1 Field site
The Hupsel Brook catchment is situated in the east of The Netherlands (Fig. 1). Its area is 6.5 km2, its elevation ranges from 22 to 35 m a.s.l. and the mean slope is 8‰ (Van der Velde et al., 2009). The brook itself is 4 km long and has 7 small tributaries with lengths varying from 300 to 1500 m (Warmerdam, 1979). The slope of the brook
25
HESSD
8, 111–150, 2011Soil buffer limits flash flood response to extraordinary rainfall
C. C. Brauer et al.
Title Page
Abstract Introduction
Conclusions References
Tables Figures
◭ ◮
◭ ◮
Back Close
Full Screen / Esc
Printer-friendly Version
Interactive Discussion
Discussion
P
a
per
|
Dis
cussion
P
a
per
|
Discussion
P
a
per
|
Discussio
n
P
a
per
|
The Hupsel Brook catchment was selected as a research catchment in the 1960s because of its hydrogeological setting. The top layer consists of loamy sand with some clay, peat and gravel layers. Its thickness increases from 0.2 m in the east to 10 m in the west. The sand layer is situated on an impermeable marine clay layer of more than 20 m thick. Consequently, there is one phreatic aquifer discharging to the brook and
5
regional groundwater flow is assumed to be small.
The Hupsel Brook is natural, but both the catchment and the brook have been mod-ified by human intervention (Warmerdam, 1979). The meandering brook has been straightened before the start of the observations (and parts are being restored since 2007). Several culverts have been constructed since the 1960s, which form
poten-10
tial obstacles during high flow conditions. Drainpipes are installed in about 50% of the plots to accommodate optimal groundwater levels for agriculture (Fig. 1) (Van der Velde et al., 2010). A dense network of ditches allows quick discharge when catchment stor-age is high, but the small (tertiary and secondary) ditches are often dry when catch-ment storage is low.
15
Since 1963 various hydrological, geological and meteorological measurement cam-paigns have been carried out, which have been well documented in the literature (e.g., Colenbrander, 1965; Stricker and Brutsaert, 1978; Stricker and Warmerdam, 1982; Hopmans and van Immerzeel, 1988; Van Ommen et al., 1989; Hopmans and Stricker, 1989; Puente et al., 1993; Van der Velde et al., 2009; Rozemeijer et al., 2010). We
20
refer to these studies for more information on the catchment.
2.2 Data
The Royal Netherlands Meteorological Institute (KNMI) operates a network of 32 auto-mated meteorological stations (with a density of about 1 station per 1000 km2), where among others 10-min values of rainfall (measured with an automatic rain gauge), global
25
HESSD
8, 111–150, 2011Soil buffer limits flash flood response to extraordinary rainfall
C. C. Brauer et al.
Title Page
Abstract Introduction
Conclusions References
Tables Figures
◭ ◮
◭ ◮
Back Close
Full Screen / Esc
Printer-friendly Version
Interactive Discussion
Discussion
P
a
per
|
Dis
cussion
P
a
per
|
Discussion
P
a
per
|
Discussio
n
P
a
per
|
The KNMI also operates a manual rain gauge network (with a density of about 1 gauge per 100 km2) to collect daily (08:00–08:00 UTC) rainfall accumulations. One of these manual rain gauges is located within the catchment, less than 1 km southwest of the meteorological station (Fig. 2).
Weather radars are valuable in flash flood research, because they give quantitative
5
information about both the spatial and the temporal variability in rainfall (Younis et al., 2008). Two weather radars are operated by the KNMI in De Bilt and Den Helder. The weather radar in De Bilt is about 100 km west of the catchment. Standard weather radar rainfall estimates are prone to large errors. To obtain radar rainfall depths of good quality, rain gauge networks were used to adjust radar-based accumulations.
10
A daily spatial adjustment was combined with an hourly mean-field bias adjustment. This adjustment method has been described and verified in Overeem et al. (2009a) and Overeem et al. (2009b), the main difference with these previous studies being an increase in spatial resolution from 2.4 to 1 km.
Another source of rainfall data is available for this event. As part of a commercial
15
network for mobile telecommunication, many microwave links have been installed in The Netherlands. Microwaves are sent from a transmitting antenna to a receiving an-tenna. Rainfall attenuates the microwave signal and because of this, as a byproduct, such links can provide quantitative information about path-averaged rainfall intensi-ties (Messer et al., 2006; Leijnse et al., 2007). One of these microwave links has
20
one antenna located within the Hupsel Brook catchment and the other 15.1 km to the southwest (see Fig. 2). From this link minimum and maximum received powers over 15-min intervals were available, with a resolution of 0.1 dB, based on 10-Hz sampling. The path-averaged rainfall intensity was estimated from the minimum and maximum received powers according to Overeem et al. (2010b)
25
HESSD
8, 111–150, 2011Soil buffer limits flash flood response to extraordinary rainfall
C. C. Brauer et al.
Title Page
Abstract Introduction
Conclusions References
Tables Figures
◭ ◮
◭ ◮
Back Close
Full Screen / Esc
Printer-friendly Version
Interactive Discussion
Discussion
P
a
per
|
Dis
cussion
P
a
per
|
Discussion
P
a
per
|
Discussio
n
P
a
per
|
and 27 August, 15:00 UTC) the gauge-adjusted 1-h radar rainfall depths at the same location have been used.
In a field (with drainpipes) located next to the meteorological station 31 piezometers have been installed (Fig. 1) (Van der Velde et al., 2009). This field slopes towards a ditch on one side of the field. The surface has local elevations and depressions with
5
height differences of approximately 50 cm. Piezometers are situated both on local ele-vations and in local depressions to capture the differences in groundwater dynamics. In 14 of the 31 piezometers pressure sensors record water levels every 15 min. A number of Echoprobe capacitance sensors (type Echoprobe EC-20) were also installed in this field to measure soil moisture content. Here we use data from one sensor at 40 cm
10
depth situated in a local elevation at 20 m from the ditch.
Since 1968, discharge data have been collected with a particular type of H-flume at the catchment outlet (Hooghart, 1984). Its temporal resolution for the period used in this paper was 15 min. Further details concerning the calibration of this flume are provided in Sect. 4.4.
15
2.3 Post-event field surveys
Post-event field surveys can provide valuable information on water levels and flow pro-cesses in ungauged parts of the catchment (Gaume, 2006; Gaume and Borga, 2008; Marchi et al., 2009). Such surveys were performed directly after the event on 27 Au-gust, as well as during several phases of the recession following the flash flood. During
20
these surveys, photographs were taken on several locations in the catchment and all in-strumentation was inspected. Additional information was provided by local inhabitants. A summary of the surveys is provided in Table 1.
2.4 Discharge regime
It is relevant to put the 27 August discharge peak, as well as the conditions prior to
25
HESSD
8, 111–150, 2011Soil buffer limits flash flood response to extraordinary rainfall
C. C. Brauer et al.
Title Page
Abstract Introduction
Conclusions References
Tables Figures
◭ ◮
◭ ◮
Back Close
Full Screen / Esc
Printer-friendly Version
Interactive Discussion
Discussion
P
a
per
|
Dis
cussion
P
a
per
|
Discussion
P
a
per
|
Discussio
n
P
a
per
|
from 1969 to 2010 some statistics can be computed. Mean discharge at the outlet of the Hupsel Brook catchment is 60 l s−1(0.8 mm d−1). During 1% of the time 170 l s−1is
exceeded and during 1‰ of the time 924 l s−1is exceeded.
The maximum discharge measured since 1969 was 3.0 m3s−1 and occurred on
31 December 1993. This discharge peak was caused by a rainfall event of 21 mm
5
in one day and 38 mm of rainfall in the four preceding days. Since 1969, a daily mean discharge of 1 m3s−1was exceeded five times. In Table 2 rainfall depths and durations,
and initial and peak discharges are given for these events. Initial discharges (and most likely also initial storage) were much higher for the five previous discharge extremes than on 26 August 2010, resulting in high discharges after much less rainfall.
10
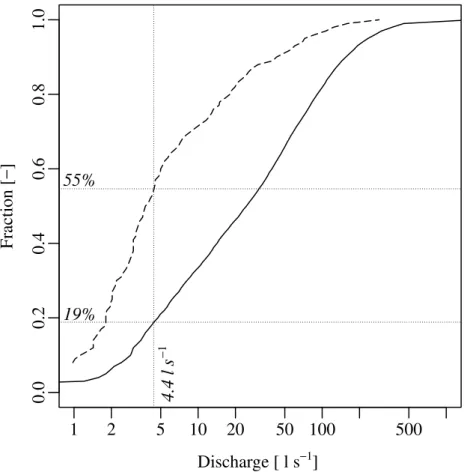
Restricting the analysis to the conditions typical for the last decade of August (20– 31 August), the mean discharge is 16 l s−1 and during 10% of the time 43 l s−1 is
ex-ceeded. Sometimes there is no or hardly any discharge. During 10% of the time 1.1 l s−1is not reached. Before the start of this rainfall event, the discharge was 4.4 l s−1,
a value that is exceeded 81% of the days and on 45% of the days in the last decade
15
of August (Fig. 3). A discharge of 4.4 l s−1is therefore low in terms of the mean for the
end of August and also much lower than the initial conditions for the past extremes, but it is not exceptional.
3 Rainfall event
3.1 Synoptic situation and rainfall pattern
20
The synoptic chart at 26 August, 18:00 UTC shows an elongated region with multiple shallow low pressure centres stretching from the Bay of Biscay to Poland (Fig. 4). The low pressure centres were sandwiched between bands of high pressure over the north Atlantic and southern Europe, which allowed the system to be stationary during most of the day. Because pressure gradients were small, wind speeds were low and storm
25
HESSD
8, 111–150, 2011Soil buffer limits flash flood response to extraordinary rainfall
C. C. Brauer et al.
Title Page
Abstract Introduction
Conclusions References
Tables Figures
◭ ◮
◭ ◮
Back Close
Full Screen / Esc
Printer-friendly Version
Interactive Discussion
Discussion
P
a
per
|
Dis
cussion
P
a
per
|
Discussion
P
a
per
|
Discussio
n
P
a
per
|
Along these low pressure centres a warm front was present, which divided warm, humid air in the south from cooler air in the north. The temperature gradients over The Netherlands were large. For example, a difference of 8◦C in maximum daily surface
temperature was found over 150 km.
The frontal transition zone of warm air in the south and cooler air in the north of
5
The Netherlands caused several active disturbances during 26 August. In the course of the afternoon the atmosphere south of the warm front became unstable, giving rise to some very heavy, mostly convective rain showers in the middle and eastern part of the country. These disturbances were part of a mesoscale convective system and passed The Netherlands with a west-southwesterly flow, locally resulting in
extraordi-10
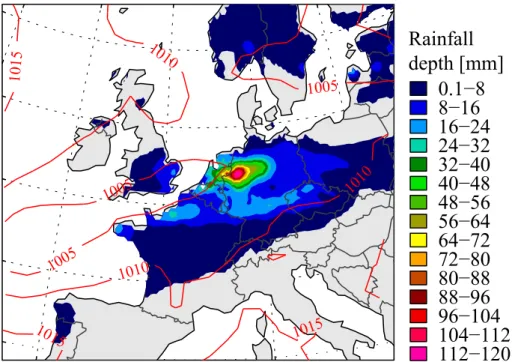
nary accumulations of rainfall (see Schumacher and Johnson, 2005, for a description of a mesoscale convective system). Similar accumulations were recorded in parts of Northwestern Germany (Fig. 4).
Because storm cells moved along a stationary line, it rained continuously for long periods of time in several places. More than 18 h of continuous rainfall was recorded in
15
De Bilt (the location of the used KNMI weather radar).
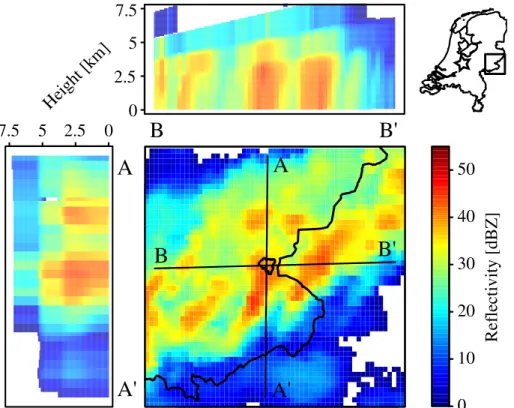
The rainfall pattern which lead to these heavy intensities was highly variable, con-taining both convective and stratiform rainfall. Figure 5 presents a clear example of the spatial variability in the rainfall field as observed by the weather radar in De Bilt at 19:15 UTC. This weather radar scans at different angles, which makes it possible to
20
obtain a vertical profile of radar reflectivity (Hazenberg et al., 2010). In Fig. 5 both the horizontal and vertical extent of the convective area (reflectivity exceeding 40 dBZ) can be clearly identified.
The convective cells were part of a larger southwest-northeast oriented squall line that became apparent in the Hupsel Brook catchment at 15:30 UTC (see also Fig. 6). In
25
HESSD
8, 111–150, 2011Soil buffer limits flash flood response to extraordinary rainfall
C. C. Brauer et al.
Title Page
Abstract Introduction
Conclusions References
Tables Figures
◭ ◮
◭ ◮
Back Close
Full Screen / Esc
Printer-friendly Version
Interactive Discussion
Discussion
P
a
per
|
Dis
cussion
P
a
per
|
Discussion
P
a
per
|
Discussio
n
P
a
per
|
over the Hupsel Brook catchment. After 22:15 UTC rainfall got a more stratiform char-acter.
3.2 Estimation using rain gauges and weather radar
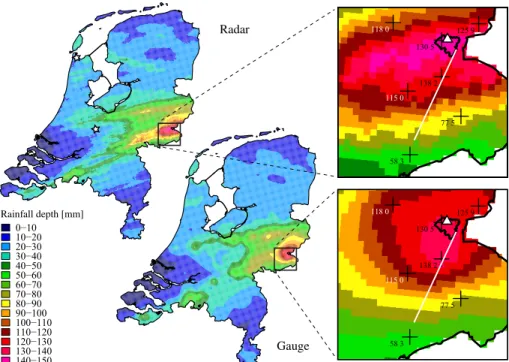
Figure 2 shows daily rainfall depths for 26 August, 08:00 UTC to 27 August, 08:00 UTC for the gauge-adjusted radar composite and the interpolated manual rain gauge data.
5
Locations of the manual rain gauges and their observed daily sums are also shown. The highest manual rain gauge rainfall depth for this day (138.2 mm) was observed in Lievelde, 4 km southwest of the catchment. This, for Dutch conditions, extraordi-nary accumulation belongs to the highest ever recorded in The Netherlands since of-ficial registration of the national rain gauge network started in 1951. The highest daily
10
rainfall depth measured (with manual rain gauges) since 1951 was 148 mm, the sec-ond highest 146 mm (source: KNMI). The 3rd, 5th and 7th places are occupied by Lievelde (138.2 mm), Hupsel (130.5 mm) and Rekken (125.9 mm), all from 26 August, 08:00 UTC to 27 August, 08:00 UTC (all plotted in Fig. 2). A less official record from the KNMI shows another maximum: on 3 August 1948, 208 mm of rainfall was measured.
15
At the location of the automatic rain gauge in the catchment a gauge-adjusted radar rainfall depth of 140.7 mm was measured (08:00–08:00 UTC). Based on the data series from the automatic rain gauge (gaps filled with radar data), the maximum daily (08:00– 08:00 UTC) rainfall depth is 146.3 mm and the maximum 24-h rainfall depth is 159.5 mm (04:00–04:00 UTC). This is larger than the largest 24-h rainfall depth observed in the
20
11-year climatological radar data set for the entire land surface of The Netherlands (142 mm for a radar pixel of 6 km2).
Figure 6 shows that the cumulative rainfall depths from 26 August, 08:00 UTC to 26 August, 21:00 UTC from the automatic rain gauge and the gauge-adjusted radar hardly differ. Daily accumulations from radar and manual rain gauge are comparable,
25
HESSD
8, 111–150, 2011Soil buffer limits flash flood response to extraordinary rainfall
C. C. Brauer et al.
Title Page
Abstract Introduction
Conclusions References
Tables Figures
◭ ◮
◭ ◮
Back Close
Full Screen / Esc
Printer-friendly Version
Interactive Discussion
Discussion
P
a
per
|
Dis
cussion
P
a
per
|
Discussion
P
a
per
|
Discussio
n
P
a
per
|
The rainfall event can be divided into roughly four parts according to rainfall intensity (see also Figs. 6 and 9). From 04:00 to 10:00 UTC rainfall was moderately intense (27.2 mm; mean rainfall intensity 4.5 mm h−1), from 10:00 to 15:00 UTC rainfall was
light (4.7 mm; mean rainfall intensity 0.9 mm h−1), from 15:00 to 22:00 UTC rainfall was
intense (111.0 mm; mean rainfall intensity 15.9 mm h−1) and from 22 to 03:00 UTC rain-5
fall was moderately intense (16.3 mm; mean rainfall intensity 3.3 mm h−1).
From the gauge-adjusted radar composite the spatial extent (including a part of Germany) of the extreme event is derived for the largest 24-h rainfall depths (04:00– 04:00 UTC). The 24-h rainfall depth exceeds 100 mm for a 2100 km2 area, 120 mm for a 740 km2area, and 140 mm for a 170 km2area. The scale of this event is considerably
10
larger than the largest scale of the 24-h rainfall depth exceeding 100 mm,∼450 km2, as
found in the 11-year climatological radar data set for The Netherlands (Overeem et al., 2010a).
3.3 Estimation using microwave link
Microwave links can potentially be used to provide rainfall estimates in data-sparse
15
regions or during extreme events.
During the event of 26 August, the microwave link connection remained stable up to a radar rainfall depth of 80 mm and the obtained depths correspond well to the radar depths measured over the same path (Fig. 6). Figure 7 shows that the dynamics of the link-based rainfall intensities are similar to those obtained from path-averaged
20
gauge-adjusted radar rainfall intensities. This confirms that microwave links are a use-ful addition to the existing networks and that they can be used to estimate rainfall in areas where no gauges are available.
This is a simple, first-order attempt to estimate rainfall intensities from this commer-cial microwave link: Some important sources of error were not taken into account: (1)
25
HESSD
8, 111–150, 2011Soil buffer limits flash flood response to extraordinary rainfall
C. C. Brauer et al.
Title Page
Abstract Introduction
Conclusions References
Tables Figures
◭ ◮
◭ ◮
Back Close
Full Screen / Esc
Printer-friendly Version
Interactive Discussion
Discussion
P
a
per
|
Dis
cussion
P
a
per
|
Discussion
P
a
per
|
Discussio
n
P
a
per
|
for a link of this frequency (15.3 GHz). both instantaneously (Fig. 5) and accumulated over the entire event (Fig. 2) can cause systematic deviations (Overeem et al., 2010b).
3.4 Estimation of return period
While the rainfall event can easily be characterized as extraordinary based on the anal-ysis in Sect. 3.2, the question remains how extreme this event really was, and what the
5
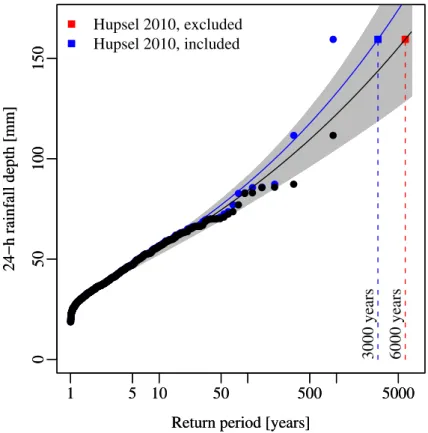
probability is of such an event happening again in the near future. Figure 8 shows a probability plot of 24-h rainfall depths, based on Overeem et al. (2008), who per-formed an extreme value analysis of rainfall depths from time series of 12 automatic rain gauges in The Netherlands (altogether 514 years of data). A rough estimate of the average return period of the 24-h rainfall depth for this event (based on automatic rain
10
gauge and radar data), 159.5 mm (red square), is in the order of 6000 years for a given location.
When the extreme value analysis is repeated including the 159.5 mm rainfall depth, the average return period decreases to the order of 3000 years. Note that this hardly influences the quantiles of rainfall depths for average return periods up to about
15
100 years. Of course, these return periods are significantly longer than the return period of 159.5 mm being exceeded in 24 h at an arbitrary location in The Netherlands. The uncertainties due to sampling variability have been shown to be large (Overeem et al., 2008). Using the bootstrap method the 95% confidence interval was obtained. For the 24-h accumulation for a return period of 6000 years this interval ranges from
20
HESSD
8, 111–150, 2011Soil buffer limits flash flood response to extraordinary rainfall
C. C. Brauer et al.
Title Page
Abstract Introduction
Conclusions References
Tables Figures
◭ ◮
◭ ◮
Back Close
Full Screen / Esc
Printer-friendly Version
Interactive Discussion
Discussion
P
a
per
|
Dis
cussion
P
a
per
|
Discussion
P
a
per
|
Discussio
n
P
a
per
|
4 Hydrologic response
4.1 Soil moisture response
When rainfall infiltrates into the unsaturated zone, soil moisture can be expected to re-act before groundwater and runoff. Figure 9 shows the observed local response of soil moisture content. Before the rainfall event, the soil was relatively dry. The soil moisture
5
content measured by the available sensor at 40 cm depth was initially 23% and started to rise at 07:00 UTC, 3 h after the start of the rainfall event. As a result of the first part of the rainfall event with moderate intensities (04:00–09:00 UTC) the soil moisture content rose slowly to 32% at 10:00 UTC. Between 09:00 and 10:00 UTC 12 mm of rainfall was registered, leading to a steep increase in soil moisture content up to 41% at 11:00 UTC.
10
Between 10:00 and 12:00 UTC there was hardly any rainfall and the soil moisture con-tent remained constant, but between 12:00 and 13:00 UTC another 3.6 mm of rainfall occurred and the soil moisture content reached saturation (45%) at 14:30 UTC. After that, the soil moisture content slowly decreased, but remained above 40% until 27 Au-gust, 19:30 UTC. The high soil moisture contents contributed to the strong groundwater
15
table response. It should be noted that soil moisture contents returned to pre-event lev-els within 3 days.
4.2 Groundwater response
The depth and dynamics of the groundwater levels depend on the distance to the ditch and on the microtopography (Van der Velde et al., 2010). In Fig. 9 groundwater depths
20
are shown for 2 of the 14 recorded piezometers; one located in a local depression and one on a local elevation.
Initially, groundwater depths measured by two piezometers shown in Fig. 9 were 90 and 115 cm below surface. It took until 11:30 UTC before groundwater levels slowly started to rise, more than 4.5 h after the initial increase in soil moisture content was
25
HESSD
8, 111–150, 2011Soil buffer limits flash flood response to extraordinary rainfall
C. C. Brauer et al.
Title Page
Abstract Introduction
Conclusions References
Tables Figures
◭ ◮
◭ ◮
Back Close
Full Screen / Esc
Printer-friendly Version
Interactive Discussion
Discussion
P
a
per
|
Dis
cussion
P
a
per
|
Discussion
P
a
per
|
Discussio
n
P
a
per
|
intensity is not visible. At 17:30 UTC, when groundwater levels were 48 and 88 cm be-low surface, groundwater rise accelerated. This was 7.5 h after the soil moisture con-tent increase accelerated. Groundwater rise accelerated when soil moisture concon-tent increased, because less water could be stored in the unsaturated zone. In addition, rainfall intensity increased after 15:00 UTC and therefore more water was available to
5
fill the pore spaces.
Around 20:15 UTC, the soil at the local depression became completely saturated and ponding occurred. Due to the larger available storage, it took until 22:45 UTC for the soil at the local elevation to become completely saturated. Ponding was less pronounced here likely due to water flowing into the local depressions. Because ponding did not
10
occur, the groundwater level at the local elevations showed strong dynamics during and after rainfall events, while the groundwater level in the local depression remained above land surface for 6 days, with a maximum ponding depth of 11 cm. Similar ponding depths were also observed in the field during post-event field survey II, with many of the local depressions still filled.
15
During post-event field survey II water was still flowing overland from the ponds in the fields to the ditches at several places. Overland flow is usually assumed to be of little importance in relatively flat areas, but can occur in lowland areas such as The Netherlands in case of high groundwater tables and/or high rainfall intensities (Appels et al., 2010). During post-event field survey II some farmers were seen digging small
20
channels in the field to reduce ponding and transport the water to the ditches more quickly.
Uncertainty in interpreting these measurements arises mostly from sampling vari-ability. Both soil moisture and groundwater depth are highly variable in space. There-fore, these measurements do not provide the catchment representative soil moisture
25
HESSD
8, 111–150, 2011Soil buffer limits flash flood response to extraordinary rainfall
C. C. Brauer et al.
Title Page
Abstract Introduction
Conclusions References
Tables Figures
◭ ◮
◭ ◮
Back Close
Full Screen / Esc
Printer-friendly Version
Interactive Discussion
Discussion
P
a
per
|
Dis
cussion
P
a
per
|
Discussion
P
a
per
|
Discussio
n
P
a
per
|
4.3 Discharge response
Discharge showed little to no response to the first 35 mm of rainfall which were ab-sorbed in the soil. Discharge started to rise slowly 7 h after the start of the rainfall event. Within 23 h, from 26 August 04:15 UTC to 27 August 02:45 UTC, discharge in-creased from 4.4 l s−1 to the maximum observed value of 4.98 m3s−1, i.e., by more 5
than three orders of magnitude. The discharge increased from 50 l s to 4.5 m3s−1 in
7 h. The most spectacular rise took place on 26 August between 17:30 and 22:30 UTC, when discharge increased from 0.42 m3s−1
to 4.0 m3s−1
.
Discharge remained above 1 m3s−1 for 28 h and exceeded the 99% percentile
(455 l s−1) for 4 days (Fig. 3). In Fig. 9e it seems that discharge drops to its pre-event 10
level within days, but on logarithmic scale (Fig. 9d) it can be seen that this would take weeks. On 3 September (at the end of the period shown in Fig. 9) discharge was still 150 l s−1; a value which is exceeded only 10% of the time.
Between 26 August and 7 September, 184 mm of rainfall was recorded (by the au-tomatic rain gauge, with data gaps filled with gauge-adjusted radar data). In the same
15
period 92 mm was discharged, yielding a runoffratio of 50%. The other 50% has been stored in the soil (∼70 mm) or has evaporated (20–25 mm).
There are some constructions in or around the brook that become obstacles in case of high discharges. The most important structures influencing the flow regime are the culverts. When discharge exceeds the design discharge of the culverts, the excess
20
water is stored upstream of the culvert in the brook or on the floodplain. Just 100 m up-stream of the catchment outlet is a culvert with a maximum capacity of about 5 m3s−1,
which likely topped offthe discharge peak at the flume at about 5 m3s−1
.
When catchment storage increases, the dense network of drainpipes and ditches becomes more important. Before the rainfall event, groundwater levels were below the
25
HESSD
8, 111–150, 2011Soil buffer limits flash flood response to extraordinary rainfall
C. C. Brauer et al.
Title Page
Abstract Introduction
Conclusions References
Tables Figures
◭ ◮
◭ ◮
Back Close
Full Screen / Esc
Printer-friendly Version
Interactive Discussion
Discussion
P
a
per
|
Dis
cussion
P
a
per
|
Discussion
P
a
per
|
Discussio
n
P
a
per
|
to transport water, leading to an increase in discharge capacity and in discharge itself. Without this drainage network, ponding depths and the resulting damage would have been larger in the Hupsel Brook catchment.
The peak of 4.98 m3s−1 corresponds to a specific discharge of 0.77 m3s−1km−2,
or 2.8 mm h−1, which is exceptional for a small catchment with an average slope of 5
only 8‰. The limited number of years for which discharge data are available, however, prevent an accurate estimation of the return period of this peak discharge. It seems likely, however, that the return period for the discharge peak is (much) less extreme than the return period for the 24-h rainfall accumulation due to the buffering effect of the unsaturated zone.
10
4.4 Discharge accuracy
The flume at the catchment outlet is situated in a dam perpendicular to the brook with a higher level than the rim of the flume (Fig. 9). In post-event field surveys no evidence was found that water had flown over the dam. Hence all water must have passed over the flume.
15
It is not likely that water levels in the flume have risen higher than the measur-ing range of the stillmeasur-ing well. The maximum water height measured in the flume was 1.504 m, 4 mm higher than the rim, leading to a computed peak discharge of 4.98 m3s−1.
Because the flume is slightly narrower than a standard H-flume, the flume was
cali-20
brated in the Wageningen University hydraulics laboratory in 1969 and 1983 (Fig. 10). For low discharges a prototype was used and for high discharges a scale model. The flume was calibrated up to a water level of 1.22 m and corresponding discharge of 3.02 m3s−1. The obtained stage-discharge relationship was extrapolated to the
maxi-mum water level of 1.5 m, resulting in a discharge of 4.94 m3s−1
.
25
HESSD
8, 111–150, 2011Soil buffer limits flash flood response to extraordinary rainfall
C. C. Brauer et al.
Title Page
Abstract Introduction
Conclusions References
Tables Figures
◭ ◮
◭ ◮
Back Close
Full Screen / Esc
Printer-friendly Version
Interactive Discussion
Discussion
P
a
per
|
Dis
cussion
P
a
per
|
Discussion
P
a
per
|
Discussio
n
P
a
per
|
are normalized with respect to their maximum values and plotted against each other (Fig. 10). The deviations between the stage-discharge relationships of the different types of H-flumes were very small, from which we conclude that the employed extrap-olation does not introduce significant errors.
During post-event field survey I (13 h after the peak), the flume was found to be
5
partially submerged (i.e., the water level downstream of the flume was higher than the crest of the flume). When flumes are submerged, water downstream of the flume introduces an additional resistance, leading to higher stage heights in the flume at a given discharge. When measured stage heights are used to compute discharges without accounting for (partial) submergence, the discharge will be overestimated.
10
Fortunately, H-flumes are not sensitive to submergence. When the submergence ratio (water level downstream of the flume divided by stage height, both with respect to the crest) of a standard H-flume is 50%, the stage height is overestimated by only 3% (Brakensiek et al., 1979). A submergence ratio of 60% leads to a stage height overestimation of 5%. These values may differ slightly for the Hupsel flume. During
15
post-event field survey I, the submergence ratio was estimated to be 56% (hupstream=
1.23 m and hdownstream=0.7 m). This leads to an overestimation of the stage height by 4% (based on data for H-flumes) and a possible overestimation of the discharge by 10% (3.07 m3s−1 as an initial estimate and 2.80 m3s−1 after correction). During
the peak, this effect might even have been smaller. Since we lack detailed information
20
on downstream water levels, we assume that possible errors due to submergence are small enough to be neglected.
5 Synthesis of the hydrologic response
In many catchments, a close relation exists between the discharge at the outlet and the total amount of mobile water stored in the catchment (e.g., Kirchner, 2009; Teuling
25
HESSD
8, 111–150, 2011Soil buffer limits flash flood response to extraordinary rainfall
C. C. Brauer et al.
Title Page
Abstract Introduction
Conclusions References
Tables Figures
◭ ◮
◭ ◮
Back Close
Full Screen / Esc
Printer-friendly Version
Interactive Discussion
Discussion
P
a
per
|
Dis
cussion
P
a
per
|
Discussion
P
a
per
|
Discussio
n
P
a
per
|
all fluxes are known. In case of the Hupsel flash flood, the contribution of evapotranspi-ration to the water balance is negligible around the discharge peak. Rainfall measured at the meteorological station may be considered representative for the whole 6.5 km2 catchment. Hence, storageS can be calculated with respect to an arbitrary reference levelS0by integrating the difference between rainfallR and dischargeQover timet:
5
S=S0+
Zt
t=t0
(R−Q)d t. (1)
In Fig. 11 both discharge and groundwater levels are plotted against total catchment storage as calculated by Eq. (1) for the period between 25 August 18:00 UTC and 27 August 18:00 UTC.
When interpreting the lines in Fig. 11 it should be noted that water can be stored in
10
the catchment in different ways: (1) as soil moisture in the unsaturated zone, (2) as groundwater in the saturated zone, (3) as ponds in local depressions on the fields or (4) as surface water in the brook or on banks and land surface in the floodplain. The subsequent filling of these stores, along with the interaction between them, ultimately determines the catchment response during the onset and peak of the flood. We
hypoth-15
esize that the discharge dynamics at the catchment outlet reflect the following stages, each of which has a different sensitivity of discharge to storage changes:
(1)Soil moisture reservoir filling– initially the upper part of the soil is dry, and rainfall is readily absorbed in the unsaturated zone. This leads to an increase in soil moisture content, but a lack of conductivity prevents groundwater levels to rise in conjunction
20
with soil moisture. As a result, the discharge during this phase is hardly sensitive to storage changes up to a storage increase of∼30 mm.
(2)Groundwater response– the unsaturated zone is near saturation and additional rainfall readily leads to saturation of the soil matrix. Under these conditions the specific yield µ is very small (0.06 over a large part of the storage increase in Fig. 11) and
25
HESSD
8, 111–150, 2011Soil buffer limits flash flood response to extraordinary rainfall
C. C. Brauer et al.
Title Page
Abstract Introduction
Conclusions References
Tables Figures
◭ ◮
◭ ◮
Back Close
Full Screen / Esc
Printer-friendly Version
Interactive Discussion
Discussion
P
a
per
|
Dis
cussion
P
a
per
|
Discussion
P
a
per
|
Discussio
n
P
a
per
|
is moderately sensitive to changes in total catchment storage. The rapid rise of ground-water levels continues up to a storage increase of∼120–130 mm, when groundwater levels reach the surface and ponding occurs.
(3)Surface depression filling and surface runoff – when ponding occurs, two mech-anisms come into play with contrasting effects on the discharge increase. First, the
5
specific yield strongly increases (since for ponded areasµ=1), effectively reducing the increase in hydraulic heads in response to rainfall. Secondly, however, when ponds start to connect to the network of ditches, overland flow becomes an important runoff mechanism and discharge increases rapidly. This is a typical mechanism during flash floods and the moment at which overland flow is initiated determines for a large part
10
the timing of flash flood response (Marchi et al., 2010). This is also the case in the Hupsel Brook catchment. The slope of the line in Fig. 11a is very steep between to-tal catchment storage of 120 mm and 135 mm. Measured groundwater levels indicate phreatic surfaces extending to above the local height of the land surface (which was confirmed by observations during post-event field surveys).
15
(4)Backwater feedback – in the fourth phase discharge increases to above the de-sign discharge of the culverts, leading to backwater feedbacks and extensive flooding of fields upstream of the culverts (Fig. 12). Such flooding was observed during post-event field surveys I and II (Fig. 9), especially in the area with elevation below 26 m (Fig. 1). The backwater effects strongly reduce the local pressure gradients that drive
20
the flow of water through the subsurface. At the same time, they flatten the discharge peak. Figure 11 shows that high discharge levels persist during the decrease of the initial 20 mm of storage – consistent with the role of backwater.
Because initial groundwater levels, initial soil moisture contents, hydrogeology and land use vary spatially over the catchment, the timing of the different phases also
25
HESSD
8, 111–150, 2011Soil buffer limits flash flood response to extraordinary rainfall
C. C. Brauer et al.
Title Page
Abstract Introduction
Conclusions References
Tables Figures
◭ ◮
◭ ◮
Back Close
Full Screen / Esc
Printer-friendly Version
Interactive Discussion
Discussion
P
a
per
|
Dis
cussion
P
a
per
|
Discussion
P
a
per
|
Discussio
n
P
a
per
|
hydrological response of the Hupsel Brook catchment to the extraordinary rainfall of 26 August 2010 well.
The stages resemble the stages identified by Mar ´echal et al. (2009), who described a flash flood response in a karstic area. Here, a first rainfall event only caused soil sat-uration but a second caused a flash-flood due to overland flow. In addition, Mar ´echal
5
et al. (2009) reported on backwater feedbacks at locations with limited discharge ca-pacity.
We believe that because of the rapid increase in runoffduring stage 3, in combination with the extremity of the rainfall, the magnitude of the discharge peak, the local flooding and widespread surface runoff, this runoffevent is best characterized as a lowland flash
10
flood.
6 Conclusions
On 26 August 2010 the eastern part of The Netherlands was struck by a series of very heavy rainfall events lasting for more than a day. These events lead to extraordi-nary 24-h rainfall accumulations (locally exceeding 150 mm) and unprecedented peak
15
discharges.
Rainfall was measured in the Hupsel Brook catchment with rain gauges (one auto-matic and one manual), a weather radar and a microwave link. The maximum 24-h rainfall depth was 159.5 mm (measured with the automatic rain gauge, of which gaps were filled with gauge-adjusted radar data). This rainfall depth corresponds to an
esti-20
mated return period of the order of 6000 years. The temporal dynamics and accumu-lations of rainfall intensities measured by the microwave link compare well to those of gauge-adjusted radar rainfall intensities averaged over the path of the microwave link. However, some important sources of error were not taken into account.
This rainfall event lead to a catchment response that is best described as a
low-25
land flash flood, because of the extremity of the rainfall and the widespread surface runoff. Discharge at the catchment outlet increased from 4.4 l s−1
HESSD
8, 111–150, 2011Soil buffer limits flash flood response to extraordinary rainfall
C. C. Brauer et al.
Title Page
Abstract Introduction
Conclusions References
Tables Figures
◭ ◮
◭ ◮
Back Close
Full Screen / Esc
Printer-friendly Version
Interactive Discussion
Discussion
P
a
per
|
Dis
cussion
P
a
per
|
Discussion
P
a
per
|
Discussio
n
P
a
per
|
(i.e. a specific discharge of 0.77 m3s−1km−2, or 2.8 mm h−1). Although this event was
extreme, a detailed analysis has revealed that discharge has been measured relatively accurately.
The catchment response can be divided in four phases: (1) Soil moisture reser-voir filling – water is used to replenish soil moisture and discharge hardly rises. (2)
5
Groundwater response– groundwater levels rise and discharge rises slowly. (3) Sur-face depression filling and surSur-face runoff – ponds form in local depressions on the land surface, leading to surface runoffand rapid rise of discharge. (4)Backwater feedback– brook discharges exceed maximum discharge capacity of culverts in the brook. Water is stored behind the culverts, discharge does not increase anymore and local gradients
10
that drive subsurface flow are reduced.
During this extreme event some thresholds became apparent that do not play a role during average conditions. Culverts do not influence the rainfall-runoffcharacteristics much in average situations, but become an important threshold in case of high dis-charges, when discharges are topped off, surface water levels rise and groundwater
15
gradients are reduced. Often rainfall-runoffmodels are designed and calibrated with less extreme discharge data and then used to forecast peak flows. In these models, thresholds are not taken into account and as a consequence peak discharges are over-estimated. Incorporation of such thresholds in hydrological models is currently being performed and shall be reported in future work.
20
Low initial catchment storage acted as a soil buffer and likely reduced the magnitude of the hydrologic response. The first 35 mm of rainfall were stored in the soil without a significant increase in discharge. Only after 35 mm of rainfall, discharge started to rise more rapidly, leading to a lowland flash flood with an unprecedented peak discharge.
Acknowledgements. We thank Annemarie Braam (KNMI) for providing us an internal report
25
HESSD
8, 111–150, 2011Soil buffer limits flash flood response to extraordinary rainfall
C. C. Brauer et al.
Title Page
Abstract Introduction
Conclusions References
Tables Figures
◭ ◮
◭ ◮
Back Close
Full Screen / Esc
Printer-friendly Version
Interactive Discussion
Discussion
P
a
per
|
Dis
cussion
P
a
per
|
Discussion
P
a
per
|
Discussio
n
P
a
per
|
microwave link data, Deltares for groundwater and soil moisture data, Gert van den Houten (Water Board Rijn and IJssel) for the discharge data, ECMWF for ERA Interim data and Anton Dommerholt for the calibration data of the flume. We thank Jacqueline Meerink for providing photographs of the local flooding on 27 August, which helped us to assess the hydrologic response. A. J. Teuling acknowledges financial support from The Netherlands Organisation
5
for Scientific Research through Veni Grant 016.111.002. P. Hazenberg and R. Uijlenhoet are financially supported by the EU-project IMPRINTS (FP7-ENV-2008-1-226555.
References
Appels, W., Bogaart, P., and van der Zee, S.: Influence of spatial variations of microtopography and infiltration on surface runoffand field scale hydrological connectivity, Adv. Water Resour.,
10
in press, 2010. 124
Borga, M., Boscolo, P., Zanon, F., and Sangati, M.: Hydrometeorological analysis of the 29 August 2003 flash flood in the Eastern Italian Alps, J. Hydrometeorol., 8, 1049–1067, 2007. 113
Brakensiek, D., Osborn, H., and Rawls, W.: Field manual for research in agricultural hydrology,
15
vol. 224 of Agricultural Handbook, US Department of Agriculture, 1979. 127
Colenbrander, H.: The research watershed “Leerinkbeek” Netherland, in: IAHS Redbooks, vol. 66-II, pp. 558–563, 1965. 115
Delrieu, G., Ducrocq, V., Gaume, E., Nicol, J., Payrastre, O., Yates, E., Kirstetter, P.-E., An-drieu, H., Ayral, P.-A., Bouvier, C., Creutin, J.-D., Livet, M., Anquetin, S., Lang, M., Neppel, L.,
20
Obled, C., Parent-du-Ch ˆatelet, J., Saulnier, G.-M., Walpersdorf, A., and Wobrock, W.: The catastrophic flash-flood event of 8–9 September 2002 in the Gard region, France: a first case study for the C ´evennes-Vivarais Mediterranean Hydrometeorological Observatory, J. Hydrometeorol., 6, 34–52, 2005. 113
Gaume, E.: Post Flash-flood Investigations – Methodological Note, FLOODsite Report
T23-06-25
0, 2006. 117
Gaume, E. and Borga, M.: Post-flood field investigations in upland catchments after major flash floods: proposal of a methodology and illustrations, Journal of Flood Risk Management, 1, 175–189, 2008. 117
Gaume, E., Livet, M., and Desbordes, M.: Study of the hydrological processes during the
30
HESSD
8, 111–150, 2011Soil buffer limits flash flood response to extraordinary rainfall
C. C. Brauer et al.
Title Page
Abstract Introduction
Conclusions References
Tables Figures
◭ ◮
◭ ◮
Back Close
Full Screen / Esc
Printer-friendly Version
Interactive Discussion
Discussion
P
a
per
|
Dis
cussion
P
a
per
|
Discussion
P
a
per
|
Discussio
n
P
a
per
|
Gaume, E., Livet, M., Desbordes, M., and Villeneuve, J. P.: Hydrological analysis of the river Aude, France, flash flood on 12 and 13 November 1999, J. Hydrol., 286, 135–154, 2004. 113
Haylock, M., Hofstra, N., Klein Tank, A., Klok, E., Jones, P., and New, M.: A European daily high-resolution gridded dataset of surface temperature and precipitation, J. Geophys.
Res.-5
Atmos., 113, D20119, 2008. 141
Hazenberg, P., Leijnse, H., and Uijlenhoet, R.: Radar rainfall estimation of stratiform winter precipitation in the Belgian Ardennes, Water Resour. Res., in press, 2010. 119
Hooghart, J.: Vergelijking van modellen voor het onverzadigd grondwatersysteem en de ver-damping. Verslag van de 4e CHO-studiebijeenkomst in samenwerking met de Studiegroep
10
Hupselse Beek, Tech. Rep. 13, Commissie voor Hydrologisch Onderzoek TNO, in Dutch, 1984. 117
Hopmans, J. and van Immerzeel, C.: Variation in evapotranspiration and capillary rise with changing soil profile characteristics, Agr. Water Manage., 13, 295–305, 1988. 115
Hopmans, J. W. and Stricker, J. N. M.: Stochastic analysis of soil water regime in a watershed,
15
J. Hydrol., 105, 57–84, 1989. 115
Hosking, J. and Wallis, J.: Regional Frequency Analysis: an Approach Based on L-moments, Cambridge University Press, Cambridge, 1997. 145
Kew, S. F., Selten, F. M., Lenderink, G., and Hazeleger, W.: Robust assessment of future changes in extreme precipitation over the Rhine basin using a GCM, Hydrol. Earth Syst. Sci.
20
Discuss., 7, 9043–9066, doi:10.5194/hessd-7-9043-2010, 2010. 114
Kilpatrick, F. and Schneider, V.: Use of flumes in measuring discharge, vol. 3 of US Geological Survey Techniques of Water-Resources Investigations, chap. A14, US Department of the Interior, 1983. 126, 148
Kirchner, J.: Catchments as simple dynamical systems: catchment characterization,
rain-25
fall – runoff modeling, and doing hydrology backwards, Water Resour. Res., 45, W02429, doi:10.1029/2008WR006912, 2009. 127
Leijnse, H., Uijlenhoet, R., and Stricker, J. N. M.: Rainfall measurement using radio links from cellular communication networks, Water Resour. Res., 43, W03201, 2007. 116
Marchi, L., Borga, M., Preciso, E., Sangati, M., Gaume, E., Bain, V., Delrieu, G., Bonnifait, L.,
30
HESSD
8, 111–150, 2011Soil buffer limits flash flood response to extraordinary rainfall
C. C. Brauer et al.
Title Page
Abstract Introduction
Conclusions References
Tables Figures
◭ ◮
◭ ◮
Back Close
Full Screen / Esc
Printer-friendly Version
Interactive Discussion
Discussion
P
a
per
|
Dis
cussion
P
a
per
|
Discussion
P
a
per
|
Discussio
n
P
a
per
|
floods in Europe and implications for flood risk management, J. Hydrol., 394, 118–133, 2010. 129
Mar ´echal, J., Ladouche, B., and Dorfliger, N.: Hydrogeological analysis of groundwater contri-bution to the 6–8 September 2005 flash flood in Nˆımes, Houile Blanche, 88–93, in French, 2009. 130
5
Messer, H., Zinevich, A., and Alpert, P.: Environmental monitoring by wireless communication networks, Science, 312, 713, 2006. 116
Miglietta, M. M. and Regano, A.: An observational and numerical study of a flash-flood event over south-eastern Italy, Nat. Hazards Earth Syst. Sci., 8, 1417–1430, doi:10.5194/nhess-8-1417-2008, 2008. 113
10
Monincx, S., Termes, P., and Tromp, G.: Regie afvoerpieken noodzakelijk om problemen op Overijsselse Vecht te voorkomen, H2O, 23, 44–47, in Dutch, 2006. 114
Ogden, F. L., Sharif, H. O., Senarath, S. U. S., Smith, J. A., Baeck, M. L., and Richardson, J. R.: Hydrologic analysis of the Fort Collins, Colorado flash flood of 1997, J. Hydrol., 228, 82–100, 2000. 113
15
Overeem, A., Buishand, A., and Holleman, I.: Rainfall depth-duration-frequency curves and their uncertainties, J. Hydrol., 348, 124–134, 2008. 122, 145
Overeem, A., Buishand, A., and Holleman, I.: Extreme rainfall analysis and estimation of depth-duration-frequency curves using weather radar, Water Resour. Res., 45, W10424, 2009a. 116
20
Overeem, A., Holleman, I., and Buishand, A.: Derivation of a 10-year radar-based climatology of rainfall, J. Appl. Meteorol. Clim., 48, 1448–1463, 2009b. 116
Overeem, A., , Buishand, A. Holleman, I., and Uijlenhoet, R.: Extreme value modeling of areal rainfall from weather radar, Water Resour. Res., 46, W09514, 2010a. 121
Overeem, A., Leijnse, H., and Uijlenhoet, R.: Measuring urban rainfall using microwave links
25
from commercial cellular communication networks, Water Resour. Res., submitted, 2010b. 116, 122
Puente, C. E., Bierkens, M. F. P., Diaz-Granados, M. A., Dik, P. E., and L ´opez, M. M.: Practical use of analytically derived runoffmodels based on rainfall point processes, Water Resour. Res., 29, 3551–3560, 1993. 115
30
HESSD
8, 111–150, 2011Soil buffer limits flash flood response to extraordinary rainfall
C. C. Brauer et al.
Title Page
Abstract Introduction
Conclusions References
Tables Figures
◭ ◮
◭ ◮
Back Close
Full Screen / Esc
Printer-friendly Version
Interactive Discussion
Discussion
P
a
per
|
Dis
cussion
P
a
per
|
Discussion
P
a
per
|
Discussio
n
P
a
per
|
water quality, Environ. Pollut., 158, 3571–3579, 2010. 115
Schumacher, R. and Johnson, R.: Organization and environmental properties of extreme-rain-producing mesoscale convective systems, Mon. Weather Rev., 133, 961–976, 2005. 119 Schumacher, R. and Johnson, R.: Mesoscale processes contributing to extreme rainfall in
a midlatitude warm-season flash flood, Mon. Weather Rev., 136, 3964–3986, 2008. 119
5
Smith, J. A., Baeck, M. L., Steiner, M., and Miller, A. J.: Catastrophic rainfall from an ups-lope thunderstorm in the central Appalachians: the Rapidan storm of June 27, 1995, Water Resour. Res., 32, 3099–3113, 1996. 113
Stricker, J. and Brutsaert, W.: Actual evapotranspiration over a summer in the Hupsel Catch-ment, J. Hydrol., 39, 139–157, 1978. 115
10
Stricker, J. N. M. and Warmerdam, P. M. M.: Estimation of the water balance in the Hupselse Beek basin over a period of three years and a first effort to simulate the rainfall-runoff pro-cess for a complete year, in: Proceedings of the International Symposium on Hydrological Research Basins and Their Use in Water Resources Planning, 79–388, Bern, Switzerland, 1982. 115
15
Teuling, A. J., Lehner, I., Kirchner, J. W., and Seneviratne, S. I.: Catchments ad simple dy-namical systems: Experience from a Swiss prealpine catchment, Water Resour. Res., 46, W10502, 2010. 127
van der Velde, Y., de Rooij, G. H., and Torfs, P. J. J. F.: Catchment-scale non-linear groundwater-surface water interactions in densely drained lowland catchments, Hydrol. Earth Syst. Sci.,
20
13, 1867–1885, doi:10.5194/hess-13-1867-2009, 2009. 114, 115, 117
Van der Velde, Y., Rozemeijer, J., de Rooij, G., van Geer, F., and Broers, H.: Field scale measurements for separation of catchment discharge into flow route contributions, Vadose Zone J., 9, 25–35, 2010. 113, 115, 123, 138
Van Ommen, H., Dijksma, R., Hendrickx, J., Dekker, L., Hulshof, J., and van den Heuvel, M.:
25
Experimental assessment of preferential flow paths in a field soil, J. Hydrol., 105, 253–262, 1989. 115
Warmerdam, P.: Hydrological effects of drainage improvement in the Hupselse Beek catchment area in the Netherlands, Tech. Rep. 64, Department of Hydraulics and Catchment Hydrology, Agricultural University, Wageningen, The Netherlands, 1979. 114
30
HESSD
8, 111–150, 2011Soil buffer limits flash flood response to extraordinary rainfall
C. C. Brauer et al.
Title Page
Abstract Introduction
Conclusions References
Tables Figures
◭ ◮
◭ ◮
Back Close
Full Screen / Esc
Printer-friendly Version
Interactive Discussion
Discussion
P
a
per
|
Dis
cussion
P
a
per
|
Discussion
P
a
per
|
Discussio
n
P
a
per
|
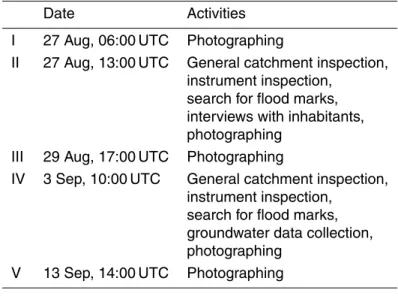
Table 1.Overview of the post-event field surveys (photos in Fig. 9).
Date Activities
I 27 Aug, 06:00 UTC Photographing
II 27 Aug, 13:00 UTC General catchment inspection, instrument inspection,
search for flood marks, interviews with inhabitants, photographing
III 29 Aug, 17:00 UTC Photographing
IV 3 Sep, 10:00 UTC General catchment inspection, instrument inspection,
search for flood marks, groundwater data collection, photographing
HESSD
8, 111–150, 2011Soil buffer limits flash flood response to extraordinary rainfall
C. C. Brauer et al.
Title Page
Abstract Introduction
Conclusions References
Tables Figures
◭ ◮
◭ ◮
Back Close
Full Screen / Esc
Printer-friendly Version
Interactive Discussion
Discussion
P
a
per
|
Dis
cussion
P
a
per
|
Discussion
P
a
per
|
Discussio
n
P
a
per
|
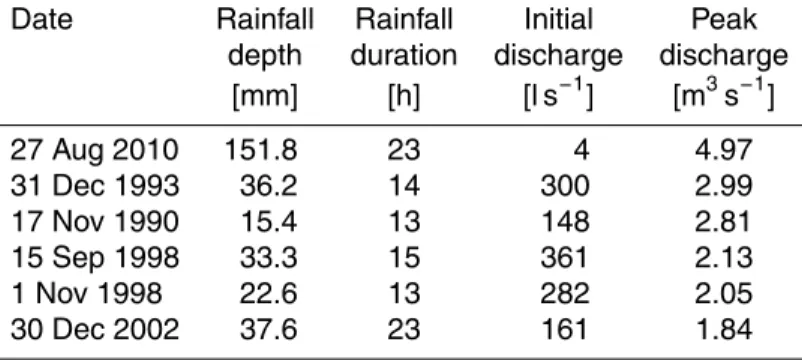
Table 2. Overview of peak discharges exceeding 1 m3s−1 since 1969. For the rainfall depth and duration, the period between initial and peak discharge is considered.
Date Rainfall Rainfall Initial Peak depth duration discharge discharge
[mm] [h] [l s−1] [m3s−1]
27 Aug 2010 151.8 23 4 4.97
31 Dec 1993 36.2 14 300 2.99
17 Nov 1990 15.4 13 148 2.81
15 Sep 1998 33.3 15 361 2.13
1 Nov 1998 22.6 13 282 2.05
HESSD
8, 111–150, 2011Soil buffer limits flash flood response to extraordinary rainfall
C. C. Brauer et al.
Title Page
Abstract Introduction
Conclusions References
Tables Figures
◭ ◮
◭ ◮
Back Close
Full Screen / Esc
Printer-friendly Version
Interactive Discussion
Discussion
P
a
per
|
Dis
cussion
P
a
per
|
Discussion
P
a
per
|
Discussio
n
P
a
per
|
Hupsel Brook Secondary ditch Tertiary ditch Field with drainpipes Meteorological station Catchment outlet
0 800 m
22-24 24-26 26-28 28-30 30-32 32-34 34-36 Surface elevation [m]
HESSD
8, 111–150, 2011Soil buffer limits flash flood response to extraordinary rainfall
C. C. Brauer et al.
Title Page
Abstract Introduction
Conclusions References
Tables Figures
◭ ◮
◭ ◮
Back Close
Full Screen / Esc
Printer-friendly Version
Interactive Discussion
Discussion
P
a
per
|
Dis
cussion
P
a
per
|
Discussion
P
a
per
|
Discussio
n
P
a
per
|
0−10 10−20 20−30 30−40 40−50 50−60 60−70 70−80 80−90 90−100 100−110 110−120 120−130 130−140 140−150
Rainfall depth [mm]
Radar
Gauge
130 5
58 3
118 0 125 9
138 2
77 5
115 0
130 5
58 3
118 0 125 9
138 2
77 5
115 0
HESSD
8, 111–150, 2011Soil buffer limits flash flood response to extraordinary rainfall
C. C. Brauer et al.
Title Page
Abstract Introduction
Conclusions References
Tables Figures
◭ ◮
◭ ◮
Back Close
Full Screen / Esc
Printer-friendly Version
Interactive Discussion
Discussion
P
a
per
|
Dis
cussion
P
a
per
|
Discussion
P
a
per
|
Discussio
n
P
a
per
|
0.0
0.2
0.4
0.6
0.8
1.0
Discharge [ l s−1]
Fraction [−]
1 2 5 10 20 50 100 500
4.4 l s
−
1
55%
19%
HESSD
8, 111–150, 2011Soil buffer limits flash flood response to extraordinary rainfall
C. C. Brauer et al.
Title Page
Abstract Introduction
Conclusions References
Tables Figures
◭ ◮
◭ ◮
Back Close
Full Screen / Esc
Printer-friendly Version
Interactive Discussion
Discussion
P
a
per
|
Dis
cussion
P
a
per
|
Discussion
P
a
per
|
Discussio
n
P
a
per
|
1005
1005
1005
1010
1010
1010
1015
1015 1015