www.the-cryosphere.net/6/453/2012/ doi:10.5194/tc-6-453-2012
© Author(s) 2012. CC Attribution 3.0 License.
The Cryosphere
Seasonal speed-up of two outlet glaciers of Austfonna, Svalbard,
inferred from continuous GPS measurements
T. Dunse1, T. V. Schuler1, J. O. Hagen1, and C. H. Reijmer2
1Department of Geosciences, University of Oslo, P.O. Box 1047, Blindern, 0316 Oslo, Norway
2Institute for Marine and Atmospheric Research Utrecht, Utrecht University, Princetonplein 5, 3584 CC Utrecht, The Netherlands
Correspondence to:T. Dunse (thorben.dunse@geo.uio.no)
Received: 2 November 2011 – Published in The Cryosphere Discuss.: 8 December 2011 Revised: 1 March 2012 – Accepted: 19 March 2012 – Published: 10 April 2012
Abstract. A large part of the ice discharge from ice caps and ice sheets occurs through spatially limited flow units that may operate in a mode of steady flow or cyclic surge be-haviour. Changes in the dynamics of distinct flow units play a key role in the mass balance of Austfonna, the largest ice cap on Svalbard. The recent net mass loss of Austfonna was dominated by calving from marine terminating outlet glaciers. Previous ice-surface velocity maps of the ice cap were derived by satellite radar interferometry (InSAR) and rely on data acquired in the mid-1990s with limited informa-tion concerning the temporal variability. Here, we present continuous Global Positioning System (GPS) observations along the central flowlines of two fast flowing outlet glaciers over 2008–2010. The data show prominent summer speed-ups with ice-surface velocities as high as 240 % of the pre-summer mean. Acceleration follows the onset of the sum-mer melt period, indicating enhanced basal motion due to input of surface meltwater into the subglacial drainage sys-tem. In 2008, multiple velocity peaks coincide with succes-sive melt periods. In 2009, the major melt was of higher amplitude than in 2008. Flow velocities appear unaffected by subsequent melt periods, suggesting a transition towards a hydraulically more efficient drainage system. The observed annual mean velocities of Duvebreen and Basin-3 exceed those from the mid-1990s by factors two and four, respec-tively, implying increased ice discharge at the calving front. Measured summer velocities up to 2 m d−1 for Basin-3 are close to those of Kronebreen, often referred to as the fastest glacier on Svalbard.
1 Introduction
Spatially limited fast-flow units are a typical feature of large ice caps and ice sheets and responsible for most of the ice flux from the interior/accumulation area towards the mar-gin/ablation area. Changes in the dynamics of these flow units have important implications for glacier mass balance. Transported towards the margin, ice is exposed to increased surface melt and, in case of marine-terminating outlets, ice-berg calving. The calving rate depends on the ice flux to-wards the calving front and the change in position of the ter-minus. Iceberg calving allows for more rapid and abrupt ice mass loss than surface melt. Its potential contribution to eu-static sea-level rise (SLR) is suggested to account for up to 2 m by the end of this century (Pfeffer et al., 2008). Yet, this contribution is excluded from the last consensus estimate, 0.18–0.6 m SLR until 2100, by the Intergovernmental Panel on Climate Change (IPCC) Fourth Assessment (Solomon et al., 2007).
Easting UTM33X (km)
620 640 660 680 700 720 740
velocity (m a-1)
0 200+
750 500 250
500
250
50m contours drainage basins flowlines stakes AWS
Easting UTM33X (km)
Nor
thing UTM33X (k
m)
620 640 660 680 700 720 740
8820 8840 8860 8880 8900
8920 Duvebreen
Basin-3
Barents Sea
Eton-breen 80°N
78°
15°E 25°E
Bråsvellbreen
a b
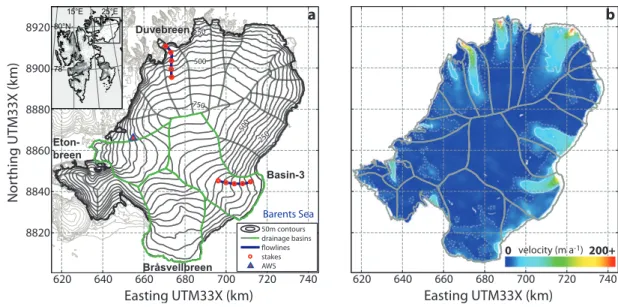
Fig. 1.Topographic and dynamic characteristics of Austfonna.(a)Surface topography of Austfonna with 50 m elevation contours according to a new DEM by Moholdt and K¨a¨ab (2012). The black rectangle in the inset indicates the location within the Svalbard archipelago. Drainage basins are outlined in solid grey, in the case of the known surge-type basins in solid green. The survey routes along the central flowlines of Duvebreen and Basin-3 are marked in solid blue, the position of stakes with red dots and the AWS on Etonbreen with a triangle.(b)Surface velocity structure of Austfonna derived from ERS-1/2 SAR scenes acquired between December 1995 and January 1996. Dashed contours indicate a velocity of 10 m a−1, solid contours are at 25 m a−1intervals. Modified from Dowdeswell et al., Iceberg calving flux and mass balance of the Austfonna ice cap on Nordaustlandet, Svalbard, J. Geophys. Res., 113, F03022, 2008. ©2008 American Geophysical Union, by permission of the American Geophysical Union.
termini (Joughin et al., 2008; Nick et al., 2009), such as caused by calving events (Thomas, 2004) or buoyancy per-turbations due to ocean tides (O’Neel et al., 2003). Velocity fluctuations may propagate up-glacier by means of longitu-dinal stress coupling (Price et al., 2008).
Excessive input of meltwater into the subglacial drainage system early in the summer melt season increases the basal water pressure, thereby weakening the ice-bed coupling and promoting high velocities in excess of those during winter (Iken and Bindschadler, 1986). While the phenomenon was first observed and studied on alpine glaciers, enhanced ice-surface velocities following ice-surface melt were also reported for the Greenland ice sheet (Zwally et al., 2002; Joughin et al., 2008; Andersen et al., 2010; Bartholomew et al., 2010; Sole et al., 2011) and polythermal Arctic glaciers (Copland et al., 2003; Nuttall and Hodgkins, 2005; Rippin et al., 2005). In polar environments, glacier acceleration usually lags the onset of summer melt. Meltwater refreezes in the snow-pack until the cold-content of the snow (and firn) is dimin-ished, thereby causing delayed runoff. Basal lubrication does not occur before a connection between the supraglacial and englacial/subglacial drainage system is established (Copland et al., 2003). Abrupt and vigorous water input may follow drainage events of supraglacial lakes, that are known to form at the surface of many Arctic glaciers during summer.
The relationship between surface melt and glacier accel-eration is not linear, but depends on the nature of the basal
hydraulic system and the response time needed to adjust for changes in water input. Sustained input of large volumes of meltwater may retard rather than enhance glacier motion, as recently observed in SW Greenland (van de Wal et al., 2008; Bartholomew et al., 2011b; Sundal et al., 2011). Model re-sults illustrate that a transition from a hydraulically ineffi-cient distributed drainage system to an effiineffi-cient channelized system can explain glacier slow-down during sustained melt periods (Schoof, 2010).
Ice-surface velocity maps of good spatial resolution can be derived from satellite radar interferometry (InSAR; e.g. Rott, 2009) or speckle/intensity tracking of SAR intensity images (Strozzi et al., 2002). A disadvantage of these methods is that suitable data is only available for limited time periods. Con-tinuous or repeated ground-based Global Positioning System (GPS) observations yield displacement rates of specific sur-face points. GPS measurements provide velocity time series at the desired temporal resolution and at high accuracy, how-ever, with limited information on the spatial variability.
net mass loss is mainly attributed to calving from the ma-rine ice margin (Dowdeswell et al., 2008; Moholdt et al., 2010). A previously published calving estimate of 2.5± 0.5 Gt a−1(Dowdeswell et al., 2008) relies on the mid 1990s surface-velocity snapshots.
In this study, we present continuous GPS measurements along the central flowlines of Duvebreen and Basin-3, two of Austfonna’s fast-flow units. The GPS records span a two-year period, and allow investigation of seasonal and two- year-to-year changes in flow velocities. Basin-3 was reported to have undergone a short-lived flow-instability or “mini-surge” in the early 1990s (Dowdeswell et al., 1999). In parallel with the GPS data, we consider the temperature record of a nearby automatic weather station to investigate a possible relation-ship between surface melt and flow dynamics. We also com-pare the recently measured flow velocities with those from the mid 1990s.
2 Survey area
2.1 The Austfonna ice cap
Austfonna is a 7800 km2ice cap (Moholdt and K¨a¨ab, 2012) centered at 79.7◦N, 24.0◦E on the island Nordaustlandet, in the northeast of Svalbard (Fig. 1a). The ice cap represents the largest ice body on the highly glacierized archipelago. It con-sists of one main dome that rises to 800 m a.s.l., where the ice thickness reaches its maximum of about 580 m (Dowdeswell et al., 1986). A main ice divide separates the northwest-ern basins, predominantly terminating on land or in narrow fjords, from the southeastern basins, that are to a large ex-tent grounded below sea level and form an almost contin-uous calving front towards the Barents Sea (Dowdeswell, 1986; Hagen et al., 1993). InSAR data acquired in the winter months of the mid 1990’s revealed that a large portion of the ice cap is moving at low velocities<10 m a−1, interrupted by spatially limited flow units characterized by ice surface velocities in the range of about 50–250 m a−1(Dowdeswell et al., 1999, 2008; Bevan et al., 2007, Fig. 1b). The lo-cation of these flow units coincides with subglacial valleys or troughs. This velocity pattern appears to be typical for many Arctic ice caps, e.g. the Devon Island Ice Cap in Arc-tic Canada (Dowdeswell et al., 2004) or the Academy of Sciences Ice Cap in the Russian Arctic (Dowdeswell et al., 2002). Model results suggest that the large ice thickness within these valleys allows for temperate basal conditions, and hence, basal motion as the dominant mechanism of ice flow (Dunse et al., 2011). Several basins are known to have surged in the past; Etonbreen and Br˚asvellbreen in the 1930s and Basin-3 around 1850–1870 (Schytt, 1969; Lefauconnier and Hagen, 1991). A submarine push-moraine in front of Basin-5, a northeastern neighbour of Basin-3, also suggests that this basin may have surged, probably within the past 100 years (Robinson and Dowdeswell, 2011). Currently
ob-served elevation changes display interior thickening at rates of up to 0.5 m a−1and marginal thinning at 1–3 m a−1 (Bam-ber et al., 2004; Moholdt et al., 2010) and can be explained by low ice flux rates within surge-type basins in their quies-cent phase (Hagen et al., 2005; Bevan et al., 2007). Bam-ber et al. (2004) suggested increased moisture flux from the adjacent Barents Sea, and hence increased accumulation, as the cause for the positive elevation changes in the accumu-lation area. However, this hypothesis is not supported by accumulation measurements using shallow ice cores, indi-cating unchanged long-term net accumulation rates over the time periods 1963–1986 and 1986–1998, respectively (Pin-glot et al., 2001). In-situ mass balance measurements over the time period 2004–2008 indicate a surface mass balance close to zero (Moholdt et al., 2010). The mean equilibrium-line altitude (ELA) equaled about 450 m a.s.l. for the north-western and 300 m a.s.l. for the southeastern basins. In 2008, the ELA was significantly lower. Yet, the net mass bal-ance of Austfonna over the period 2002–2008 was negative, −1.3±0.5 Gt a−1(Moholdt et al., 2010), due to calving and retreat of the marine ice margin at rates of several tens of me-ters per year during the past few decades (Dowdeswell et al., 2008).
Here, we focus on the central flowlines of two fast-flowing outlet glaciers along which surface velocities were deter-mined earlier by Dowdeswell et al. (1999): Duvebreen in the northwestern and Basin-3 in the southeastern section of the ice cap (Fig. 1a). When the flowlines were visited on 25 Au-gust 2008, a continuous winter snow cover persisted down to the calving termini. In 2009 the ELA was positioned higher up than in 2008, but still below average, at about 200 m a.s.l. on both Duvebreen and Basin-3. In the following, we present general features of the dynamics of the two basins and the geometries along their central flowlines. The latter is based on ground-penetrating radar (GPR) and kinematic GPS data, further described in Sect. 3.2 and Appendix A. Each flow-line is defined by five specific survey locations, equidistantly distributed over a length of 16 km (Fig. 2).
2.2 Basin-3
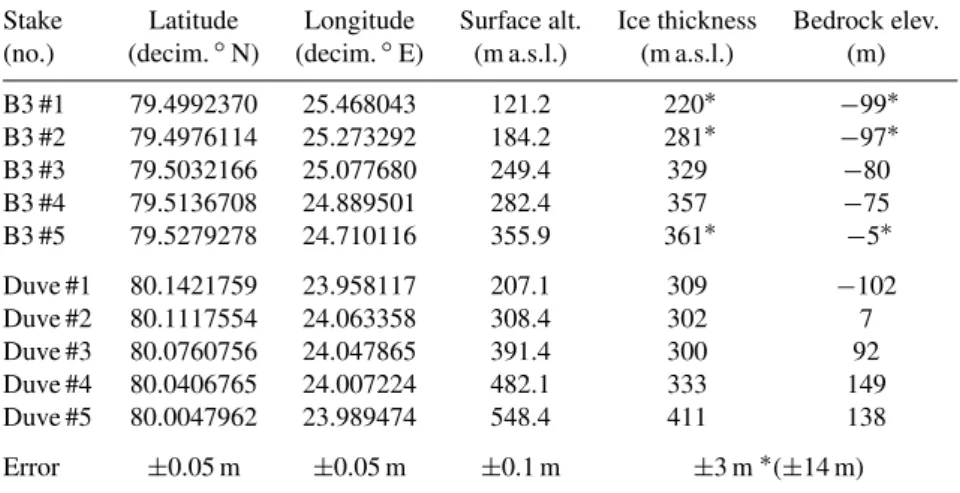
Table 1.Survey locations of stakes along the central flowlines of Basin-3 (B3 #1–5) and Duvebreen (Duve #1–5) and their glacier-geometric characteristics. Positions are measured directly and the associated absolute error given in the last row is constant. Ice thickness and hence, bedrock elevation are indirectly measured, the associated error is ice-thickness depended. Values marked by∗are interpolated values (see Sect. A).
Stake Latitude Longitude Surface alt. Ice thickness Bedrock elev. (no.) (decim.◦N) (decim.◦E) (m a.s.l.) (m a.s.l.) (m)
B3 #1 79.4992370 25.468043 121.2 220∗ −99∗
B3 #2 79.4976114 25.273292 184.2 281∗ −97∗
B3 #3 79.5032166 25.077680 249.4 329 −80
B3 #4 79.5136708 24.889501 282.4 357 −75
B3 #5 79.5279278 24.710116 355.9 361∗ −5∗
Duve #1 80.1421759 23.958117 207.1 309 −102
Duve #2 80.1117554 24.063358 308.4 302 7
Duve #3 80.0760756 24.047865 391.4 300 92
Duve #4 80.0406765 24.007224 482.1 333 149
Duve #5 80.0047962 23.989474 548.4 411 138
Error ±0.05 m ±0.05 m ±0.1 m ±3 m∗(±14 m)
0 2 4 6 8 10 12 14 16 -100
0 100 200 300 400 500 600
Distance (km)
Elev
a
tion (m a.s
.l.)
surface stakes bedrock (GPR) bedrock (interp)
-100 0 100 200 300 400 500 600
Elev
a
tion (m a.s
.l.)
a
b #5
#4
Duve #3
#2
#1 #1 #2
B3 #3 #4
#5
Fig. 2.Glacier geometry along central flowlines of Basin-3(a)and Duvebreen(b). Surface elevation (solid blue) in m a.s.l. is based on kinematic GPS measurements, GPR-derived ice thickness sub-tracted to yield bedrock elevation (solid black and dashed grey). Stake positions are marked with red dots. The lowermost stakes on both flowlines are located∼5 km upstream from the calving front.
two bedrock protrusions. The ice thickness along the pro-file gradually thickens upglacier, averaging 313 m.
Basin-3 has surged around 1850–1870 (Lefauconnier and Hagen, 1991), coincident with the Little Ice Age, when many glaciers on Svalbard reached their Holocene maximum ex-tent (Svendsen and Mangerud, 1997). Subsequently, the ter-minus retreated∼8 km from its maximum extent marked by the position of a large submarine push moraine (Robinson and Dowdeswell, 2011). The observed surface profile is rel-atively flat (Dowdeswell, 1986). This may be indicative of the early quiescent phase (Meier and Post, 1969), thus im-plying a long, multi-century surge cycle. Alternatively, the flat surface profile could be explained by a considerable con-tribution of basal motion to the overall ice flow.
Application of InSAR to SAR scenes acquired in the early 1990s revealed a distinct flow unit 5–6 km wide and topo-graphically constrained by Isdomen, a prominent subglacial hill to the north (Dowdeswell et al., 1999). Velocities in February 1992 were as high as 140 m a−1 at the terminus, whereas in January 1994, only 80 m a−1were observed. The absence of significant crevasse fields in Landsat imagery from 1973–1991 suggest that the flow unit was fairly inac-tive over that time period and fast flow initiated after 1991. Calculated balance velocities were one order of magnitude smaller than the observed surface velocities. Dowdeswell et al. (1999) thus interpreted the change in flow velocities as a short-lived flow instability or mini-surge initiated after 1991, arguing that the ice flux cannot be sustained under the present climate.
2.3 Duvebreen
and January 1994 ranged from 20–80 m a−1 along the cen-tral flowline (Dowdeswell et al., 1999).
Surface elevations along the surveyed section range from 207 m a.s.l., 4–5 km upglacier from the calving front, to 548 m a.s.l. (Table 1) with a mean surface slope of 1.22◦ (Fig. 2b). The ice thickness ranges from ∼300 m to >400 m from the lower to upper ends, with a mean of 328 m. The bedrock topography is relatively flat in the upper half, with elevations ranging from 100–160 m a.s.l. Farther downglacier, the bedrock abruptly drops, reaching depths of more than 100 m below sea level. Bedrock protru-sions of several 100 m in diameter and 20–30 m heights pro-mote local increase in ice-bed coupling and hence, compres-sive flow. Convex ice-surface undulations therefore appear slightly upglacier from bedrock protrusions (Gudmundsson, 2003). Vice-versa, concave surface elevations coincide with downglacier sloping bedrock. A very prominent surface de-pression lies upglacier from the bedrock escarpment. Field inspections in spring 2008 and SPOT-5 satellite imagery from 14 August 2008 (Korona et al., 2009) suggest that a supra-glacial lake forms within the depression during the summer melt season.
3 Methods
In spring 2008, we established a series of stakes along the central flowlines of Duvebreen and Basin-3. Each flowline was surveyed by five GPS receivers, mounted atop stakes drilled in the glacier ice at 4 km intervals, numbered #1–5 in upglacier direction (Fig. 2; Table 1). Maintenance and data retrieval took place in early May 2009 and 2010 during the annual ground-based field season and during a short visit in August 2009. The lower receivers were positioned in highly crevassed areas with a thin snow cover in May 2009, and hence weak snow bridges, prohibiting access to all receivers on Basin-3 (B3 #1–5) and the lowermost one on Duvebreen (Duve #1). Insufficient power-supply caused a gap in the ob-servations between June and August 2009.
3.1 Continuous Global Positioning System (GPS) observations
We utilized single-frequency (L1 band) GPS receivers. Pow-ered by a single 3.6 V lithium battery, the receivers operate unmaintained over time periods of 1 year or longer (van de Wal et al., 2008; den Ouden et al., 2010). The receivers switch on every hour for a period of 3 min to allow stabi-lization of the received satellite signals. Subsequently, po-sitions are computed within the receiver and the geograph-ical position and time are logged. Multi-path errors are re-duced by employing an antenna design that minimizes sig-nal reception from below. Post-processing capabilities are restricted by the limited information stored, i.e. we do not apply correction with respect to atmospheric effects such
708.025 708.03 708.035 708.04 708.045
.894 .896 .898 .900 .902 .904 .906 .908 8843.910
Easting UTM33X (km)
Nor
thing UTM33X (k
m)
hourly raw data daily mean filtered daily mean
Jun08 Oct08 Feb09 Jun09 Oct09 Feb10
100 200 300 400 500 600 700
Date (first day of month)
Hor
iz
on
tal v
elocit
y (m a-1)
daily mean filtered once filtered twice
a
b
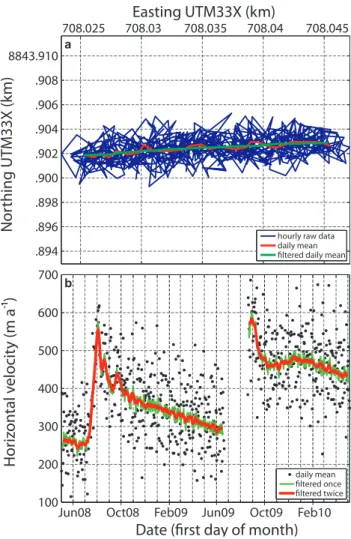
Fig. 3.Processing of continuous GPS observations. Positioning of stake Basin-3 #2 during June 2008(a): hourly GPS raw-data (blue), daily-mean values (red) and after application of a 7 day running mean (green). Flow velocities derived from displacement of GPS positions(b), utilizing daily mean (black scatters) or 7 day filtered positions with/without additional 7 day filtering of the computed velocities (red/blue solid lines).
as ionospheric and tropospheric delay, clock information or satellite configuration. Instead, the simple broadcast orbits with the WGS84 reference frame are used and a running av-erage is applied to remove high frequency noise at the cost of temporal resolution.
range of 0.1–1 m are within the uncertainty of the system’s position estimates. Thus, data averaging over multiple days is required to yield meaningful results. The cleaned raw data is converted to UTM33X and a daily mean position (at hour 1200) is assigned, if at least 12 out of 24 samples of a particular day are available. The daily averages are charac-terized by significant noise reduction, compared to the hourly raw data (Fig. 3a). A 7 day running mean is applied inde-pendently to the daily Easting and Northing. This further enhances the robustness of the position measurement, how-ever, at the cost of the temporal resolution. Daily displace-ments and hence velocities are calculated trigonometrically from the averaged positions. Considering the small horizon-tal scales discussed here, the curvature of the Earth can be neglected. Finally, the velocity record is smoothed by apply-ing a second 7-day runnapply-ing-mean (Fig. 3b).
Based on the standard deviation of the average position of a reference station in central Spitsbergen during 2006–2009, the horizontal accuracy of the system was determined to be 1.62 m (den Ouden et al., 2010). Our measurement period largely overlaps with the period investigated by den Ouden et al. (2010) and is characterized by a solar ionospheric min-imum. A larger error is expected in years with higher so-lar activity. Daily averaging has been shown to reduce the standard deviation in the position measurement to <0.5 m (den Ouden et al., 2010). Accordingly, the maximum er-ror in the displacement between consecutive days is 1 m d−1 (365 m a−1). The error in displacement between two arbi-trary daily mean positions, e.g. at the beginning and end of a 1 year period, remains unaffected and the accuracy increases significantly, i.e. to 1 m a−1. Annual velocities according to the mean of the computed daily velocities differ from an-nual velocities inferred by the begin-end method by typically less than 1 %. Exceptions can be explained with incomplete records of daily values within a certain period. This indicates that the filtering of the GPS data provides robust estimates of ice-surface velocities. Given considerable noise level on short timescales (1 day to a few weeks), we cannot exclude the presence of spurious waves, similar to those described by den Ouden et al. (2010). Consequently, we do not interpret periodic fluctuations of smaller amplitude (.30 m a−1). 3.2 Additional data
Low-frequency penetrating radar (GPR) and ground-based kinematic Global Navigation Satellite System (GNSS; GPS and GLONASS) observations were collected in spring 2008 and combined to derive glacier geometry along the flowlines. Where GPR measurements are lacking, bedrock elevations are interpolated utilizing additional in-formation from a bedrock map at 1 km horizontal resolution (Dunse et al., 2011). A detailed description of the methodol-ogy is provided in Appendix A.
The air temperature record from an automatic weather station (AWS), located in the western part of Austfonna at
510 m a.s.l., (Fig. 1a; Schuler et al., 2007) is used to derive time series of cumulative positive degree-days (PDD) over the summer months. The annual PDD is the sum of daily mean air temperatures above melting over the period of an entire melt season (counted in ◦C d) and an indicator for sur-face melt (Reeh, 1989). The temperature record is not modi-fied to account for the specific location or surface elevation of individual stakes, e.g. by application of a temperature lapse rate. Doing so, would result primarily in a shift in the abso-lute PDD values, but would not affect the timing of signifi-cant melt periods.
4 Results
4.1 Ice-surface velocities: 2008/2009 vs. 2009/2010
The GPS records span the time period from May 2008 to May 2010 and allow investigation of seasonal and interan-nual changes in ice-surface velocities. Over the measurement period, ice-surface velocities decreased with distance up-glacier along the central flowlines (Fig. 4). In 2008, a promi-nent summer speed-up occurred at all stations on Basin-3 (Fig. 4a). Subsequently, ice-surface velocities gradually de-creased from their summer maxima but maintaining rela-tively high speeds during the winter months compared to the pre-summer minimum, occurring in June. Monthly mean ve-locities in June 2009 were up to 23 % faster than those ob-served in June 2008, except for the lowermost site, where velocities did not change significantly. Due to missing data, the 2009 summer speed-up of Basin-3 was not captured, but measured velocities from late summer 2009 until May 2010 appear to be shifted to higher values, compared to the corre-sponding period of the previous year. Over the time period May 2008 to May 2009, annual mean velocities inferred by the begin-end method ranged from∼120 m a−1at B3 #5 to ∼400 m a−1at B3 #1 (Table 2). Over the subsequent period May 2009–2010, annual mean velocities increased by 21– 41 %.
At Duvebreen, ice-surface velocities maintained a rela-tively steady level over the two-year period. Short-lived sum-mer speed-ups were only noticeable at the lower locations (Fig. 4b), i.e. within a few weeks after the summer maxi-mum, velocities returned to just above pre-summer values. Annual mean velocities ranged from 40 m a−1at Duve #5 to 200 m a−1at Duve #1. In 2009/2010, the annual mean veloc-ity decreased by ca. 10 % at the lowermost stake (Duve #1), compared to 2008/2009, while velocities at the other mea-sured locations (Duve #2–4) did not change significantly. The GPS receiver at Duve #5 did not function in 2009/2010. 4.2 Summer speed-up 2008 and 2009
May08 Jul08 Sep08 Nov08 Jan09 Mar09 May09 Jul09 Sep09 Nov09 Jan10 Mar10 May10
0 100 200 300 400 500 600 700
0 50 100 150 200 250
Date (first day of month)
May08 Jul08 Sep08 Nov08 Jan09 Mar09 May09 Jul09 Sep09 Nov09 Jan10 Mar10 May10
V
elocit
y (m a
-1 )
b
V
elocit
y (m a
-1 )
a
B3 #1B3 #2 B3 #3 B3 #4 B3 #5
Duve #1 Duve #2 Duve #3 Duve #4 Duve #5
Fig. 4.Flow velocities along the central flowline of Basin-3(a)and Duvebreen(b), during May 2008–2010.
around a low, stable level. The associated monthly means and standard deviations provide a reference against which to compare maximum summer velocities. We define the onset of the summer speed-up at a particular location as the day when velocities exceed three standard deviations from the pre-summer mean. This threshold determines velocities sig-nificantly above the winter background. We have tested the resolving power of our smoothed velocity time series by in-serting an artificial speed-up event in the winter background of our recorded GPS data, assuming exponential accelera-tion and deceleraaccelera-tion. Based on 100 realizaaccelera-tions with ran-domly chosen event-lengths (2–7 days) and amplitudes (0.5– 2 m a−1), we assign a conservative timing error of±3 days
to both the onset dates and timing of velocity maxima. De-spite this uncertainty in resolving power, the 2008 summer speed-ups appeared to be initiated at the lower locations and occurred progressively later at the stations located farther up-glacier (Figs. 5 and 6). The summer maximum, however, was reached at about the same time at all locations of a particular flowline (Table 3).
Table 2.Annual mean velocities for the period May 2008–2009 and May 2009–2010 based either on all available daily values (Vmean) or the first and last day’s position at the beginning and end of the respective year (Vbe). The velocity factor,Vfac, refers to current vs. previous year’s
Vbe. At Basin-3, data is lacking between∼15 June–25 August, including both the pre-summer minimum and summer speed-up/maximum. The corresponding entry forVmeanis marked bya.
Stake Period Flow dir. Vmean Vbe Vfac
(no.) dd/mm/yyyy (◦azimuth) ( m a−1) ( m a−1)
B3 #1 04/05/2008–30/04/2009 73 416±99 403 –
B3 #2 04/05/2008–30/04/2009 88 349±66 349 –
B3 #3 05/05/2008–30/04/2009 98 265±39 264 –
B3 #4 05/05/2008–30/04/2009 118 191±26 190 –
B3 #5 05/05/2008–30/04/2009 120 118±14 117 –
B3 #1 01/05/2009–30/04/2010 71 479±86a 485 1.21
B3 #2 01/05/2009–30/04/2010 87 444±69a
B3 #3 01/05/2009–30/04/2010 97 350±49a 350 1.32
B3 #4 01/05/2009–30/04/2010 117 256±34a 255 1.34
B3 #5 01/05/2009–30/04/2010 118 168±24a 165 1.41
Duve #1 01/05/2008–30/04/2009 296 199±19 198 –
Duve #2 01/05/2008–30/04/2009 344 150±13 149 –
Duve #3 01/05/2008–30/04/2009 357 111±7 110 –
Duve #4 01/05/2008–30/04/2009 356 73±8 72 –
Duve #5 01/05/2008–30/04/2009 346 36±7 32 –
Duve #1 01/05/2009–26/04/2010 296 168±11 174 0.88
Duve #2 01/05/2009–27/04/2010 342 147±17 147 0.98
Duve #3 01/05/2009–27/04/2010 357 112±11 111 1.00
Duve #4 01/05/2009–26/04/2010 356 74±9 74 1.03
Duve #5 01/05/2009–04/05/2009 360 – – –
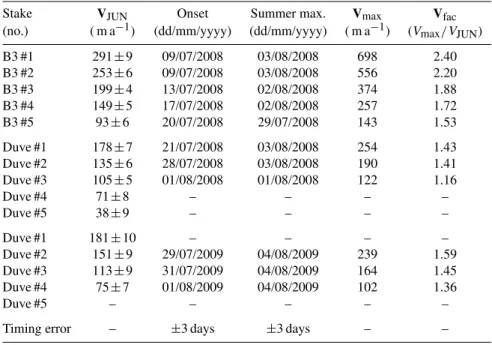
Table 3.Characteristics of the summer speed-up, following the pre-summer minimum in June,VJUN, in terms of the onset date, timing and value of measured maximum velocities,Vmax, and the normalized maximum flow enhancement relative to pre-summer velocities,Vfac.
Stake VJUN Onset Summer max. Vmax Vfac
(no.) ( m a−1) (dd/mm/yyyy) (dd/mm/yyyy) ( m a−1) (Vmax/VJUN)
B3 #1 291±9 09/07/2008 03/08/2008 698 2.40
B3 #2 253±6 09/07/2008 03/08/2008 556 2.20
B3 #3 199±4 13/07/2008 02/08/2008 374 1.88
B3 #4 149±5 17/07/2008 02/08/2008 257 1.72
B3 #5 93±6 20/07/2008 29/07/2008 143 1.53
Duve #1 178±7 21/07/2008 03/08/2008 254 1.43
Duve #2 135±6 28/07/2008 03/08/2008 190 1.41
Duve #3 105±5 01/08/2008 01/08/2008 122 1.16
Duve #4 71±8 – – – –
Duve #5 38±9 – – – –
Duve #1 181±10 – – – –
Duve #2 151±9 29/07/2009 04/08/2009 239 1.59
Duve #3 113±9 31/07/2009 04/08/2009 164 1.45
Duve #4 75±7 01/08/2009 04/08/2009 102 1.36
Duve #5 – – – – –
0 100 200 300 400 500 600 700
Date (first day of month) 0 50 100 150 200 250
Jun08 Jul08 Aug08 Sep08 Oct08
a b B3 #1 B3 #2 B3 #3 B3 #4 B3 #5 Duve #1 Duve #2 Duve #3 Duve #4 Duve #5 V elocit
y (m a
-1) 0 0.5 1 1.5 2 2.5 3 Temper a tur e (
° C
) 0 10 20 30 40 50 60 C ummula tiv
e PDD (
° C d)
Jun08 Jul08 Aug08 Sep08 Oct08
c
V
elocit
y (m a
-1)
Fig. 5.Summer speed-up along the central flowline of Basin-3(a)
and Duvebreen(b)in summer 2008. Markers indicate the occur-rence of the onset of summer speed-up and three separate velocity peaks (see also Table 3). Positive daily mean air temperature and cumulative PDD at the AWS on Etonbreen is shown in(c).
to a velocity increase of 53–140 % compared to the pre-summer mean. The relative acceleration is smallest at the uppermost station and increases farther downglacier.
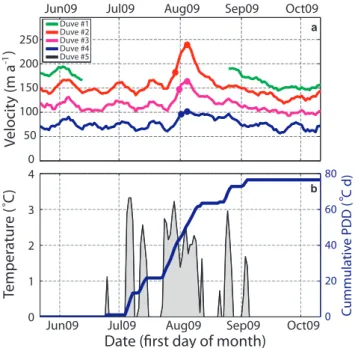
At Duvebreen, the 2008 summer speed-up was less pro-nounced (16–43 % acceleration compared to the pre-summer minimum) and only detected at the three lowermost sites along the flowline (Duve #1–3; Fig. 5b). The 2009 summer speed-up at these locations was of higher amplitude (up to 59 % at Duve #2; Table 3) and also detected farther upglacier than in 2008.
The temperature record of the AWS revealed maximum diurnal temperatures up to∼2.5◦C in summer 2008 and a cumulative PDD of 52◦C d. Throughout summer 2009, the PDD-value was significantly larger, 78◦C d, and maximum temperatures reached∼3.5◦C. The 2008 summer speed-up was characterized by 3 distinct peaks, concurrent at all loca-tions, except for the second speed-up event that followed∼2 weeks after the primary summer maxima in case of Basin-3 and ∼3 weeks in case of Duvebreen. The third and last speed-up event during summer 2008 followed∼7 weeks af-ter the primary summer maximum (Fig. 5a, b). The initial
C
ummula
tiv
e PDD (
° C d)
Jun09 Jul09 Aug09 Sep09 Oct09
0 50 100 150 200 250
Date (first day of month)
a Duve #1 Duve #2 Duve #3 Duve #4 Duve #5 0 1 2 3 4 0 20 40 60 80 b
Jun09 Jul09 Aug09 Sep09 Oct09
V
elocit
y (m a
-1)
Temper
a
tur
e (
° C
)
Fig. 6. Summer speed-up along the central flowline of Duvebreen in summer 2009(a)with markers indicating the occurrence of on-set of summer speed-up and peak velocity. Positive daily mean air temperature and cumulative PDD is shown in(b).
summer speed-up coincided with the first prolonged period with air temperatures above 0◦C in the second half of July (Fig. 5c). The two other velocity peaks coincided with a second and third period of melting that lead to a significant rise in cumulative PDD. Only one single speed-up event was observed at Duvebreen throughout summer 2009, coincident with the major melt period. A subsequent period of observed positive air temperatures does not appear to significantly en-hance flow velocities (Fig. 6).
5 Discussion
5.1 Surface-velocities fluctuations
Summer 2008 was characterized by relatively low air tem-peratures, yielding a low cumulative PDD and hence, little surface melt. Snow cover persisted over the ice cap through-out the entire summer season and is likely to have maintained high surface albedo, thereby reducing the energy available for melt. The input of small volumes of melt water to the subglacial system may not have been sufficient to establish an efficient drainage system (Iken and Bindschadler, 1986; Nienow et al., 1998). Consequently, renewed melt water input during late-summer melt periods, associated with a distinct increase in cumulative PDD, presumably promote high subglacial water pressure and enhanced hydraulic lu-brication. The asynchrony in the second speed-up event on Basin-3 and Duvebreen may be explained by different local weather situations on the northern and southern side of the ice cap, which may not be equally well represented in a sin-gle temperature record. In addition, spatially variable rain-fall may have contributed to differently enhance the water input and hence basal motion, at the two sites (Fudge et al., 2009). For both flowlines, an upglacier propagation of the onset of the 2008 summer speed-up was observed. This can be explained by a later onset of surface melt and hence de-layed local input of meltwater into the englacial/subglacial drainage system, as recently also observed on Greenland outlet glaciers (Andersen et al., 2010; Bartholomew et al., 2011a; Sole et al., 2011). Reduced meltwater production at higher elevation may explain the dampened amplitude of the velocity peaks at stakes farther upglacier (Andersen et al., 2010).
In 2009, air temperatures were significantly higher, yield-ing a cumulative PDD of 78◦C d, compared to only 52◦C d in 2008. The summer speed-up in 2009 coincided with a strong increase in cumulative PDD. The detected delay in speed-up at locations upglacier (4 days between Duve #2 & 4) is hardly significant. A second noticeable melt period in the end of August had no clear effect on the ob-served surface motion, in contrast to comparable melt peri-ods in 2008. This indicates that after the major melt period in 2009, the basal drainage system was able to accommo-date the increased input of meltwater likely associated with the warm events, without weakening the ice-bed coupling and promoting enhanced basal motion (Bartholomaus et al., 2008, 2011). Recent numerical modelling (Schoof, 2010; Pimentel and Flowers, 2011) showed that under sustained meltwater supply, the evolvement of an efficient hydrauli-cally drainage system may significantly reduce the basal wa-ter pressure and its sensitivity to changing wawa-ter inputs.
Particular for the velocity timeseries from Basin-3 is the slow and gradual decrease from the summer-2008 velocity maxima. This indicates that basal water pressures remained high and only decreased gradually. An inefficient drainage system, e.g. a layer of subglacial sediments may have re-tained a significant fraction of water throughout the winter months, thereby facilitating continuously high, but dimin-ishing deformation of water-saturated sediments (Tulaczyk
et al., 2000; Fischer and Clarke, 2001; Bougamont et al., 2011). The bedrock slope along the surveyed profile is gentle and lies below sea level along its entire length, providing lit-tle topographic resistance to basal sliding and facilitating up-glacier propagation of velocity fluctuations through longitu-dinal coupling. This may explain why the summer speed-up is noticeable at all locations, albeit at decreasing amplitude farther upglacier.
At Duvebreen, the multiple summer speed-ups in 2008 and the single one in 2009 were short-lived in nature. The sur-face velocity quickly returned to pre-summer values. This may be explained by a rapid transition from a hydraulically inefficient, distributed drainage system to a hydraulically ef-ficient, channelized system. Another explanation is provided by the specific topography, which is fundamentally different from that of Basin-3. At the uppermost 3 stakes on Duve-breen (Duve #3–5) the glacier is grounded about 100 m a.s.l. (Fig. 2). Duve #2 is located just downglacier of a steep drop into the narrow Duvefjord, where bedrock elevations reach deeper than−100 m a.s.l. (Duve #1). The steep valley walls may cause significant lateral drag upon the lower section of the glacier, i.e. below Duve #2 (Nye, 1965; Raymond, 1996). Additional basal lubrication has to compensate for the lateral drag. This may only be fulfilled in periods when the basal water pressure exceeds a certain threshold. Lateral shear may thus stabilize the terminus of Duvebreen and make the glacier less prone to terminus fluctuations and/or longitudi-nal coupling of changes in terminus dynamics. The steep bedrock topography at Duve #2 promotes the formation of closely-spaced surface crevasses, as observed in the field, fa-cilitating meltwater routing to the bed. Enhanced response to melt-induced acceleration was recently also reported for the heavily crevassed terminus of Helheim Galcier, East Green-land (Andersen et al., 2010). In 2009, surface melt and input of meltwater into the englacial/subglacial drainage system may have occurred also at higher elevation, where individ-ual crevasses have been observed, causing noticeable sum-mer speed-up also at higher stations.
the basal conditions are available. Given the fact that the out-let glaciers of Austfonna are well grounded, we regard poten-tial changes in oceanic forcing to have only minor effects on ice velocity changes. Mechanisms that are known to affect the calving rate of some outlet glaciers of Greenland, and hence also influence the backstress at, and flow velocities of the terminus, include the formation of seasonal ice m´elange (Amundson and Truffer, 2010; Howat et al., 2010) or tem-poral floatation of the terminus (Howat et al., 2007); both of which are not known to act upon Austfonna. Basin-3 surged more than 140 years ago. The observed longterm increase in velocity may be indicative for renewed surge activity, similar to a general speed-up of Variegated Glacier, Alaska, prior to its surge (Raymond, 1987).
5.2 Implications for iceberg calving
Changes in the dynamics of marine terminating glaciers have a direct impact on the iceberg discharge. The calving flux,qc, is determined by the ice flux through the calving front and the position change of the front. Following van der Veen (1996) the calving flux can be expressed as:
qc=
uc− dL
dt
·hw (1)
whereucis the depth-averaged velocity at the calving front,
dL
dt the change in front position over time (positive in case of
advance) andhandware the vertical and horizontal dimen-sions of the calving front.
Using the InSAR-derived surface velocities, Dowdeswell et al. (1999) investigated the ice flux within the flow unit of Basin-3. Estimating the cross-sectional area to 5×0.24 km2, ∼7.5 km upglacier from the marine ice margin, and assum-ing a depth-averaged velocity correspondassum-ing to 85 % of the measured surface velocity, i.e. 90 m a−1in winter 1992 and 50 m a−1 in winter 1994, the ice flux amounted to 0.1 and 0.05 Gt a−1, respectively. Dowdeswell et al. (2008) pro-vided a total calving estimate for Austfonna, distinguishing between the ice-flux through the calving front and margin-change flux contribution of individual basins. The calving flux from Basin-3 was dominated by marginal retreat, ac-counting for 0.3 Gt a−1 out of a total 0.45 Gt a−1. The ice flux through the calving front contributed 0.15 Gt a−1. The calving flux from Duvebreen was dominated by the ice-flux contribution, accounting for∼75 % of a total calving flux of 0.1 Gt a−1.
Dowdeswell et al. (1999, 2008) considered their annual ice flux estimates to represent a lower limit, because flow rates during the winter months December to February, corre-sponding to the acquisition period of the SAR data used, are usually lower than the annual average. However, our two-year record indicates that velocities in December to Febru-ary are approximately equal or, in case of Basin-3 over the period 2009–2010, even slightly larger than the corre-sponding annual average (Fig. 4). Mean-annual velocities
2009/2010 of 479 m a−1 at B3 #1 and 444 m a−1 at B3 #2 (Table 2), about 4–5 km and 8–9 km from the marine mar-gin, indicate a more than four-fold velocity increase com-pared to those used to derive previous ice flux estimates. Ap-plied to the fluxgate defined by Dowdeswell et al. (1999), the ice flux within Basin-3 increased from 0.1 Gt a−1in 1992 to 0.45 Gt a−1in 2009/2010, indicating that the ice flux contri-bution may have surpassed the contricontri-bution from marginal retreat. The flow velocities along the central flowline of Du-vebreen doubled from 20–80 m a−1in the mid-1990s to 35– 200 m a−1 in 2008–2010, also suggesting an increased ice-flux contribution to the total calving ice-flux. New data on the marine outline is required to assess the total calving flux.
6 Conclusions
In 2008, the observed summer speed-up of both Basin-3 and Duvebreen appears closely linked to positive diurnal air temperatures/cumulative PDD, a proxy for surface melt and potential input of meltwater into the englacial/subglacial drainage system. In 2009, GPS observations only cover the speed-up of Duvebreen. Summer 2009 was significantly warmer than summer 2008 with a pronounced principle melt period (late July to early August) and the relationship be-tween ice-surface velocity and air temperature is more com-plex. Meltwater volumes produced later in the melt season do not lead to positive excursions in glacier flow. This indicates that a hydraulically effective drainage system has established in the course of the principle melt period and increased melt-water input can therefore be accommodated without raising basal water pressure and enhancing basal lubrication.
Annual mean and mean winter flow velocities of Duve-breen over the period 2008–2010 were twice as high as those inferred for winter in the 1990s. The spatial velocity pat-tern and the characteristics of summer speed-up appear to be controlled by the distinct topography with the lower part of the glacier flowing over an escarpment and being channelled into a deep and narrow fjord. Likewise, Basin-3 has accel-erated by about a factor of four compared to the 1990s and also showed an acceleration of 30–40 % from 2008/2009 to 2009/2010. Velocities measured during summer 2008 reach up to 700 m a−1(2 m d−1) within 5 km from the calving front and are almost as high as those reported from Kronebreen, often referred to as the fastest tidewater glacier on Sval-bard, with annual mean velocities up to 550 m a−1(1.5 m d−1; Lefauconnier et al., 1994) and recent summer maxima of 900 m a−1(2.5 m d−1) measured at the calving front (Rolstad et al., 2009).
observations along the central flowline and spatial continu-ous satellite observations are currently analyzed to further elucidate the dynamic state of Basin-3.
Appendix A
Derivation of glacier geometry along flowlines
To derive the glacier geometry along the flowlines, we com-bine surface elevation profiles from ground-based kinematic GNSS with low-frequency GPR measurements of ice thick-ness. Kinematic GNSS observations were logged at a rate of 1 Hz (approx. every 5.5 m) and differentially post-processed using a stationary GNSS as reference, yielding an accuracy of typically better than 5 cm in horizontal position and 10 cm in height (Eiken et al., 1997). GPR (VIRL-6) measurements were triggered every 2 m by means of an odometer. Navi-gation data were recorded simultaneously with the GPR data using a GPS Garmin II Plus receiver (Vasilenko et al., 2010). The radar transmitter generates pulses of 25 ns duration with a center frequency of 20 MHz, resulting in a system reso-lution of approximately 2 m (assuming a radio-wave veloc-ity of 0.168±0.0005 m ns−1, typical for cold ice). The pre-cision of the ice thickness measurements was estimated to ∼1.6 m, based on the standard deviation in ice thickness at more than 34 000 crossover points from the entire Austfonna survey (personal communication G. Moholdt, Department of Geosciences, University of Oslo, Oslo, Norway, 2011). The precision represents the error in ice thickness due to the un-certainty in the time measurement (digitization of bedrock reflection). The accuracy in ice thickness is determined when adding an absolute error of about 0.3 % (3 mm per meter ice) to the precision value. This absolute error is re-lated to the uncertainty of radio-wave velocity. For an ice thickness of 350 m this corresponds to an error of about 1 m (2000 ns×0.0005 m ns−1) yielding an accuracy of the GPR-derived ice thickness of about 2.6 m.
To link kinematic GPS and GPR measurements along the flowline, linear segments between consecutive stake posi-tions have been taken as benchmark distance. A correction factor, specific for each dataset and leg (typically between 0.98 and 1) is then applied to all distance increments so that the cumulative distance along the measured tracks matches the benchmark distance. Both datasets are resampled at 10 m intervals to allow subtraction of ice thickness from surface el-evation to derive bedrock elel-evation. Gaps in the GPR record are padded by extracting values from an ice thickness map at 1 km horizontal resolution (Dunse et al., 2011). Values were extracted for positions corresponding to 1 km intervals along the flowlines and corrected for a mean bias, determined from the overlapping sections (mean and standard deviation of−16.61±11.59 m in the case of Basin-3;−1.11±7.80 m in the case of Duvebreen).
Acknowledgements. This study is a contribution to the Interna-tional Polar Year project GLACIODYN funded by the Norwegian Research Council (grant 176076/S30). The final stage was supported by funding to the ice2sea project from the European Union 7th Framework Programme, grant number 226375, ice2sea contribution number 029. T. Dunse was supported by an Arctic field grant through the Svalbard Science Forum (field work). We thank G. Moholdt and M. Sund for assistance in retreiving the GPS data. E. Vasilenko and F. Navarro are greatly acknowledged for collecting low-frequency GPR data along the flowlines and extracting bedrock information. We thank editor I. M. Howat and reviewers M. King, G. S. Hamilton, P. Christoffersen and one anonymous reviewer for thorough and encouraging reviews that helped to improve this paper.
Edited by: I. M. Howat
References
Amundson, J. M. and Truffer, M.: A unifying frame-work for iceberg-calving models, J. Glaciol., 56, 822–830, doi:10.3189/002214310794457173, 2010.
Andersen, M. L., Larsen, T. B., Nettles, M., Elosegui, P., van As, D., Hamilton, G. S., Stearns, L. A., Davis, J. L., Ahlstrøm, A. P., de Juan, J., Ekstr¨om, G., Stenseng, L., Khan, S. A., Forsberg, R., and Dahl-Jensen, D.: Spatial and temporal melt variability at Helheim Glacier, East Greenland, and its effect on ice dynamics, J. Geophys. Res.-earth Surface, 115, F04041, doi:10.1029/2010JF001760, 2010.
Bamber, J., Krabill, W., Raper, V., and Dowdeswell, J.: Anamolous recent growth of part of a large Arctic ice cap: Austfonna, Svalbard, Geophys. Res. Lett., 31, L12402, doi:10.1029/2004GL019667, 2004.
Bartholomaus, T. C., Anderson, R. S., and Anderson, S. P.: Re-sponse of glacier basal motion to transient water storage, Nature Geosci., 1, 33–37, doi:10.1038/ngeo.2007.52, 2008.
Bartholomaus, T., Anderson, R., and Anderson, S.: Growth and collapse of the distributed subglacial hydrologic system of Ken-nicott Glacier, Alaska, USA, and its effects on basal motion, JG, 57, 985–1002, 2011.
Bartholomew, I., Nienow, P., Mair, D., Hubbard, A., King, M. A., and Sole, A.: Seasonal evolution of subglacial drainage and ac-celeration in a Greenland outlet glacier, Nature Geosci., 3, 408– 411, doi:10.1038/NGEO863, 2010.
Bartholomew, I., Nienow, P., Sole, A., Mair, D., Cowton, T., King, M., and Palmer, S.: Seasonal variations in Greenland Ice Sheet motion: Inland extent and behaviour at higher elevations, Earth Planet. Sci. Lett., 307, 271–278, doi:10.1016/j.epsl.2011.04.014, 2011a.
Bartholomew, I., Nienow, P., Sole, A., Mair, D., Cowton, T., Palmer, S., and Wadham, J.: Supraglacial forcing of subglacial drainage in the ablation zone of the Greenland ice sheet, Geophys. Res. Lett., 38, L08502, doi:10.1029/2011GL047063, 2011b. Bevan, S., Luckman, A., and Murray, T.: Positive mass balance
dur-ing the late 20th century on Austfonna, Svalbard revealed usdur-ing satellite interferometry, Ann. Glaciol., 46, 117–122, 2007. Bougamont, M., Price, S., Christoffersen, P., and Payne, A. J.:
model with plastic bed and simplified hydrology, J. Geophys. Res., 116, F04018, doi:10.1029/2011JF002025, 2011.
Clarke, G.: Fast glacier flow – ice streams, surging, and tidewater glaciers, J. Geophys. Res.-Solid Earth and Planets, 92, 8835– 8841, 1987.
Clarke, G., Collins, S., and Thompson, D.: Flow, thermal structure, and subglacial conditions of a surge-type glacier, Can. J. Earth Sci., 21, 232–240, 1984.
Copland, L., Sharp, M. J., and Nienow, P. W.: Links between short-term velocity variations and the subglacial hydrology of a pre-dominantly cold polythermal glacier, J. Glaciol., 49, 337–348, 2003.
den Ouden, M. A. G., Reijmer, C. H., Pohjola, V., van de Wal, R. S. W., Oerlemans, J., and Boot, W.: Stand-alone single-frequency GPS ice velocity observations on Nordenski¨oldbreen, Svalbard, The Cryosphere, 4, 593–604, doi:10.5194/tc-4-593-2010, 2010. Dowdeswell, J.: Drainage-basin characteristics of Nordaustlandet
ice caps, Svalbard, J. Glaciol., 32, 31–38, 1986.
Dowdeswell, J., Drewry, D., Cooper, A., Gorman, M., Liestøl, O., and Orheim, O.: Digital mapping of the Nordaustlandet ice caps from airborne geophysical investigations, Ann. Glaciol., 8, 51– 58, 1986.
Dowdeswell, J. A., Unwin, B., Nuttall, A. M., and Wingham, D. J.: Velocity structure, flow instability and mass flux on a large Arc-tic ice cap from satellite radar interferometry, Earth Planet. Sci. Lett., 167, 131–140, 1999.
Dowdeswell, J. A., Bassford, R. P., Gorman, M. R., Williams, M., Glazovsky, A. F., Macheret, Y. Y., Shepherd, A. P., Vasilenko, Y. V., Savatyuguin, L. M., Hubberten, H. W., and Miller, H.: Form and flow of the Academy of Sciences Ice Cap, Severnaya Zemlya, Russian High Arctic, J. Geophys. Res.-solid Earth, 107, 2076, doi:10.1029/2000JB000129, 2002.
Dowdeswell, J. A., Benham, T. J., Gorman, M. R., Burgess, D., and Sharp, M. J.: Form and flow of the Devon Island Ice Cap, Canadian Arctic, J. Geophys. Res.-earth Surface, 109, F02002, doi:10.1029/2003JF000095, 2004.
Dowdeswell, J. A., Benham, T. J., Strozzi, T., and Hagen, J. O.: Ice-berg calving flux and mass balance of the Austfonna ice cap on Nordaustlandet, Svalbard, J. Geophys. Res.-Earth Surface, 113, F03022, doi:10.1029/2007JF000905, 2008.
Dunse, T., Greve, R., Schuler, T. V., and Hagen, J. O.: Permanent fast flow versus cyclic surge behaviour: numerical simulations of the Austfonna ice cap, Svalbard, J. Glaciol., 57, 247–259, 2011. Eiken, T., Hagen, J. O., and Melvold, K.: Kinematic GPS survey of geometry changes on Svalbard glaciers, Ann. Glaciol., 24, 157– 163, 1997.
Fischer, U. H. and Clarke, G. K. C.: Review of subglacial hydro-mechanical coupling: Trapridge Glacier, Yukon Territory, Canada, Quaternary International, 86, Int Union Quaternary As-soc, doi:10.1016/S1040-6182(01)00049-0, 2001.
Fudge, T. J., Harper, J. T., Humphrey, N. F., and Pfeffer, W. T.: Rapid glacier sliding, reverse ice motion and subglacial water pressure during an autumn rainstorm, Ann. Glaciol., 50, 101– 108, 2009.
Gudmundsson, G. H.: Transmission of basal variability to a glacier surface, J. Geophys. Res.-solid Earth, 108, 2253, doi:10.1029/2002JB002107, 2003.
Hagen, J., Liestøl, O., Roland, E., and Jørgensen, T.: Glacier Atlas of Svalbard and Jan Mayen, Norsk Polarinstitutt, Oslo, Norway,
1993.
Hagen, J., Eiken, T., Kohler, J., and Melvold, K.: Geometry changes on Svalbard glaciers: mass-balance or dynamic response?, Ann. Glaciol., 42, 255–261, 2005.
Howat, I. M., Joughin, I., and Scambos, T. A.: Rapid changes in ice discharge from Greenland outlet glaciers, Science, 315, 1559– 1561, doi:10.1126/science.1138478, 2007.
Howat, I. M., Box, J. E., Ahn, Y., Herrington, A., and McFad-den, E. M.: Seasonal variability in the dynamics of marine-terminating outlet glaciers in Greenland, J. Glaciol., 56, 601– 613, 2010.
Iken, A.: The Effect of the Subglacial Water-pressure On the Slid-ing Velocity of A Glacier In An Idealized Numerical-model, J. Glaciol., 27, 407–421, 1981.
Iken, A. and Bindschadler, R. A.: Combined Measurements of Subglacial Water-pressure and Surface Velocity of Findelen-gletscher, Switzerland – Conclusions About Drainage System and Sliding Mechanism, J. Glaciol., 32, 101–119, 1986. Joughin, I., Das, S. B., King, M. A., Smith, B. E., Howat, I. M.,
and Moon, T.: Seasonal speedup along the western flank of the Greenland Ice Sheet, Science, 320, 781–783, 2008.
Kamb, B., B., Engelhardt, H., Fahnenstock, M. A., Humphrey, N., Meier, M., and Stone, D.: Mechanical and Hydrologic Ba-sis For the Rapid Motion of A Large Tidewater Glacier .2. In-terpretation, J. Geophys. Res.-solid Earth, 99, 15231–15244, doi:10.1029/94JB00467, 1994.
Korona, J., Berthier, E., Bernard, M., R´emy, F., and Thouvenot, E.: SPIRIT. SPOT 5 stereoscopic survey of Polar Ice: Reference Im-ages and Topographies during the fourth International Polar Year (2007–2009), ISPRS J. Photogrammetry and Remote Sensing, 64, 204–212, doi:10.1016/j.isprsjprs.2008.10.005, 2009. Lefauconnier, B. and Hagen, J.: Surging and Calving Glaciers in
Eastern Svalbard, Norsk Polarinstitutt, Oslo, Norway, 1991. Lefauconnier, B., Hagen, J., and Rudant, J.: Flow Speed and
Calv-ing Rate of Kongsbreen Glacier, Svalbard, UsCalv-ing Spot Images, Polar Research, 13, 59–65, 1994.
L¨uthi, M., Funk, M., Iken, A., Gogineni, S., and Truffer, M.: Mech-anisms of fast flow in Jakobshavn Isbrae, West Greenland: Part III. Measurements of ice deformation, temperature and cross-borehole conductivity in cross-boreholes to the bedrock, J. Glaciol., 48, 369–385, doi:10.3189/172756502781831322, 2002. Meier, M. and Post, A.: What are glacier surges, Canadian Journal
of Earth Sciences, 6, 807–817, 1969.
Meier, M. and Post, A.: Fast tidewater glaciers, J. Geophys. Res.-Solid Earth and Planets, 92, 9051–9058, 1987.
Moholdt, G. and K¨a¨ab, A.: A new DEM of the Austfonna ice cap by combining differential SAR interferometry with ICESat laser altimetry, Polar Res., in press, 2012.
Moholdt, G., Hagen, J. O., Eiken, T., and Schuler, T. V.: Geometric changes and mass balance of the Austfonna ice cap, Svalbard, The Cryosphere, 4, 21–34, doi:10.5194/tc-4-21-2010, 2010. Nick, F., Vieli, A., Howat, I., and Joughin, I.: Large-scale changes
in Greenland outlet glacier dynamics triggered at the terminus, Nature Geosci., 2, 110–114, 2009.
Nuttall, A. M. and Hodgkins, R.: Temporal variations in flow ve-locity at Finsterwalderbreen, a Svalbard surge-type glacier, Ann. Glaciol., 42, 71–76, 2005.
Nye, J.: The flow of a glacier in a channel of rectangular, elliptic or parabolic cross-section, J. Glaciol., 5, 661–699, 1965.
O’Neel, S., Echelmeyer, K. A., and Motyka, R.: Short-term varia-tions in calving of a tidewater glacier: LeConte Glacier, Alaska, USA, J. Glaciol., 49, 587–598, 2003.
Pfeffer, W. T., Harper, J. T., and O’Neel, S.: Kinematic constraints on glacier contributions to 21st-century sea-level rise, Science, 321, 1340–1343, 2008.
Pimentel, S. and Flowers, G. E.: A numerical study of hydro-logically driven glacier dynamics and subglacial flooding, Pro-ceedings of the Royal Society A-mathematical Physical and En-gineering Sciences, 467, 537–558, doi:10.1098/rspa.2010.0211, 2011.
Pinglot, J., Hagen, J., Melvold, K., Eiken, T., and Vincent, C.: A mean net accumulation pattern derived from radioactive layers and radar soundings on Austfonna, Nordaustlandet, Svalbard, J. Glaciol., 47, 555–566, 2001.
Price, S. F., Payne, A. J., Catania, G. A., and Neumann, T. A.: Seasonal acceleration of inland ice via longitudinal coupling to marginal ice, J. Glaciol., 54, 213–219, 2008.
Raymond, C.: How do glaciers surge – a review, J. Geophys. Res.-Solid Earth and Planets, 92, 9121–9134, 1987.
Raymond, C.: Shear margins in glaciers and ice sheets, J. Glaciol., 42, 90–102, 1996.
Reeh, N.: Parameterization of melt rate and surface temperature on the Greenland ice sheet, Polarforschung, 59, 113–128, 1989. Rippin, D. M., Willis, I. C., Arnold, N. S., Hodson, A. J., and
Brinkhaus, M.: Spatial and temporal variations in surface veloc-ity and basal drag across the tongue of the polythermal glacier midre Lovenbreen, Svalbard, J. Glaciol., 51, 588–600, 2005. Robinson, P. and Dowdeswell, J.: Submarine landforms and the
behavior of a surging ice cap since the last glacial maximum: The open-marine setting of eastern Austfonna, Svalbard, Marine Geology, 286, 82–94, doi:10.1016/j.margeo.2011.06.004, 2011. Rolstad, C., Chapuis, A., and Norland, R.: Electromagnetic
inter-ference in ground-based interferometric radar data from Krone-breen (Svalbard) calving front due to multipath scattering and tidal cycles, J. Glaciol., 55, 943–945, 2009.
Rott, H.: Advances in interferometric synthetic aperture radar (In-SAR) in earth system science, Progress In Physical Geography, 33, 769–791, 2009.
Schoof, C.: Ice-sheet acceleration driven by melt supply variability, Nature, 468, 803–806, 2010.
Schuler, T., Loe, E., Taurisano, A., Eiken, T., Hagen, J., and Kohler, J.: Calibrating a surface mass-balance model for Austfonna ice cap, Svalbard, Ann. Glaciol., 46, 241–248, 2007.
Schytt, V.: Some comments on glacier surges in eastern Svalbard, Canadian Journal of Earth Sciences, 6, 867–871, 1969.
Sole, A. J., Mair, D. W. F., Nienow, P. W., Bartholomew, I. D., King, M. A., Burke, M. J., and Joughin, I.: Seasonal speedup of a Greenland marine-terminating outlet glacier forced by surface melt-induced changes in subglacial hydrology, J. Geophys. Res.-earth Surface, 116, F03014, doi:10.1029/2010JF001948, 2011. Solomon, S., Qin, D., Manning, M., Chen, Z., Marquis, M.,
Av-eryt, K., Tignor, M., and Miller, H.L. (Eds.): Climate Change 2007: The Physical Science Basis. Contribution of Working Group I to the Fourth Assessment Report of the Intergovernmen-tal Panel on Climate Change, Cambridge University Press, Cam-bridge, United Kingdom and New York, NY, USA, available at: http://www.worldcat.org/isbn/0521705967, 2007.
Strozzi, T., Luckman, A., Murray, T., Wegm¨uller, U., and Werner, C. L.: Glacier motion estimation using SAR offset-tracking pro-cedures, Ieee Transactions On Geoscience and Remote Sensing, 40, 2384–2391, 2002.
Sundal, A. V., Shepherd, A., Nienow, P., Hanna, E., Palmer, S., and Huybrechts, P.: Melt-induced speed-up of Greenland ice sheet offset by efficient subglacial drainage, Nature, 469, 521–524, 2011.
Svendsen, J. I. and Mangerud, J.: Holocene glacial and climatic variations on Spitsbergen, Svalbard, Holocene, 7, 45–57, 1997. Thomas, R. H.: Force-perturbation analysis of recent thinning and
acceleration of Jakobshavn Isbræ, Greenland, J. Glaciol., 50, 57– 66, 2004.
Tulaczyk, S., Kamb, W. B., and Engelhardt, H. F.: Basal mechanics of Ice Stream B, West Antarctica 1. Till mechanics, J. Geophys. Res.-Solid Earth, 105, 463–481, 2000.
van de Wal, R. S. W., Boot, W., van den Broeke, M. R., Smeets, C. J. P. P., Reijmer, C. H., Donker, J. J. A., and Oerlemans, J.: Large and rapid melt-induced velocity changes in the ablation zone of the Greenland Ice Sheet, Science, 321, 111–113, 2008.
van der Veen, C.: Tidewater calving, J. Glaciol., 42, 375–385, 1996. Vasilenko, E., Navarro, F., Dunse, T., Eiken, T., and Hagen, J.: New low-frequency radio-echo soundings of Austfonna ice cap, Sval-bard, in: The Dynamics and Mass Budget of Arctic Glaciers. Extended abstracts. Workshop and GLACIODYN (IPY) meet-ing, 16–19 February 2009, Kananaskis, Canada., edited by: Ahlstrøm, A. and Sharp, M., vol. 127 of Danmarks og Grønlands geologiske undersøkelse rappor, GEUS, Copenhagen: IASC Working Group on Arctic Glaciology, 2010.