Article
J. Braz. Chem. Soc., Vol. 22, No. 1, 49-57, 2011. Printed in Brazil - ©2011 Sociedade Brasileira de Química
0103 - 5053 $6.00+0.00
A
*e-mail: [email protected]
Sensitive Determination of Perphenazine in Pharmaceuticals and Human Serum by
Flow Injection Chemiluminescence Method using [Ru(phen)
3]
2+-Ce(IV) System and
a Chemometrical Optimization Approach
B. Rezaei* and A. Mokhtari
Department of Chemistry, Isfahan University of Technology, Isfahan 84156-83111 I. R. Iran
Este artigo descreve um método de quimioluminescência (CL) simples, rápido e sensível para a determinação de perfenazina usando sistema de injeção em luxo (FI). Todas as variáveis que podem afetar a resposta do método CL foram otimizadas empregando planejamento composto central (CCD) para o planejamento experimental e metodologia de superfície de resposta (RSM) para a modelagem. A otimização usando CCD comparativamente ao método univariado mostrou uma melhora signiicativa na sensibilidade. Sob condições experimentais ótimas, uma ampla região linear foi obtida entre a concentração do analito e a altura do pico, dentro do intervalo de 1,2 a 1.300 ng mL-1 com coeiciente de correlação de 0,9978. O limite de detecção foi de 0,4 ng mL-1
(S/N = 3) e o desvio padrão relativo para 6 repetições de uma solução contendo 70,5 ng mL-1
foi menor que 4%. Esse método foi aplicado com sucesso na quantiicação de perfenazina em formulações farmacêuticas e em soro humano com adequadas recuperações (95,3-104,0%). A frequência analítica foi de 100 ± 5 amostras por hora.
This paper describes a simple, rapid and sensitive chemiluminescence (CL) method for the determination of perphenazine by low injection (FI) system. All variables that can affect the CL response were optimized by employing central composite design (CCD) for the experimental design and response surface methodology (RSM) for the modeling. Optimization by means of CCD method with respect to conventional single factor at a time method showed a signiicant improvement in the sensitivity. Under the optimum experimental conditions, a wide linear relationship between analyte concentration and peak height was obtained within the range 1.2-1,300 ng mL–1 with correlation
coeficient of 0.9978. The limit of detection was 0.4 ng mL–1 (S/N = 3) and the relative standard
deviation for 6 repeated measurements of a solution containing 70.5 ng mL–1 was lower than 4%.
This method was successfully applied for the quantiication of perphenazine in pharmaceutical formulations and human serum with good recoveries (95.3-104.0%). Sample throughput was 100 ± 5 samples per hour.
Keywords: low injection, chemiluminescence, perphenazine, central composite design
Introduction
Perphenazine belongs to the phenothiazine family of drugs. Because of its neuroleptic and antidepressive actions, it is often prescribed for the treatment of psychotic patients such as schizophrenia and schizoaffective psychoses in order to decrease restlessness, aggressiveness and impulsive behavior. Also it is found to be effectual in the treatment of Parkinson’s disease.1 The monitoring of the perphenazine is important for quality assurance in pharmaceutical industry and for obtaining optimum therapeutic concentrations in body fluids to minimize the risk of toxicity. The
therapeutic range and toxic threshold of perphenazine in serum were reported 4-30 and 50-100 ng mL–1 respectively.2 Therefore, it is important to develop simple and sensitive methods for the determination of this drug. A wide variety of analytical techniques are available for the determination of perphenazine in pharmaceutical preparations and biological samples, such as HPLC,2-6 mass spectrometry,7-10 spectrophotometry,11-13 electrochemistry,14 electrophoresis15,16 and luorescence.17
to [Ru(bpy)3]3+, which is following by reduction with an analyte species to produce CL emission.20,21 Many phenothiazines are tertiary amines which can reduce [Ru(bpy)3]3+ and produce intense emission. This behavior has been found in the case of promazine, chlorpromazine, trilupromazine, thioridazine, and triluoperazine.22 The luminescence properties of [Ru(phen)3]2+ are similar to [Ru(bpy)3]2+, moreover [Ru(phen)
3]
2+ shows greater sensitivity.23
CL systems have also been used for the determination of perphenazine. These methods are based on the CL systems including permanganate in sulphuric acid,24 luminal-KMnO4,25 luminal-ferricyanide26,27 and Ce(IV)-HNO
3. 28 In experimentation, we attempt to monitor the effects of certain inputs or material on the subject matter of interest. The advantages of the experimental design are many. One major advantage is the reduction in the number of experiments, and a second is the possibility of studying the interactions among the various factors. A signiicant interaction implies that changes in one factor may be dependent on the level of the other factor. If this happens, interpretation of the results has to be done cautiously to avoid inaccurate general statements on the individual factors.29
In this work, a sensitive low-injection CL method has been presented for the determination of perphenazine. It is based on the reaction of the perphenazine with [Ru(phen)3]2+ and Ce(IV) in sulfuric acid medium. In the method described, the system and chemical variables were optimized by using a univariate procedure, moreover low rate along with chemical variables were also optimized by using response surface methodology (RSM) and central composite design (CCD). The results from univariate optimization and RSM were compared to each other. In comparison with the above-mentioned CL methods for the analysis of perphenazine, the present method shows greater sensitivity with wider linear dynamic range. This method can be applied for the determination of perphenazine in pharmaceuticals and human serum with satisfactory results.
Experimental
Reagents and preparation of solutions
All solutions were prepared by using reagent grade chemicals and doubly distilled water. Perphenazine standard solution (0.440 mg mL–1) was daily prepared by dissolving of 44.0 mg perphenazine hydrochloride (Hallochem Pharma, China) in 100.0 mL water. It was stored in a refrigerator and protected from light. Working solutions were prepared by appropriately diluting
the stock solution when used. [Ru(phen)3]2+ solution (10.0×10⁻³ mol L–1) was prepared by dissolving 0.3640 g of dichlorotris(1,10-phenanthroline) ruthenium(II) hydrate (Sigma-Aldrich, Steinheim, Germany) in water and diluting to the mark in a 50.0 mL volumetric lask. Ce(IV) solutions (0.2×10⁻³-4.0×10⁻³ mol L–1 were prepared by dissolving proper amount of ceric ammonium nitrate (Riedel-de Haën, Germany) in proper volumes of 1.0 mol L–1 H
2SO4 and diluting to the mark with distilled water in 50.0 mL volumetric lasks. Acetonitrile was HPLC-grade (Caledon, Canada). Perphenazine tablets and ampoules were obtained from Darupakhsh Co., Iran, and serum samples were taken from the Health Center of Isfahan University of Technology (Iran).
Apparatus
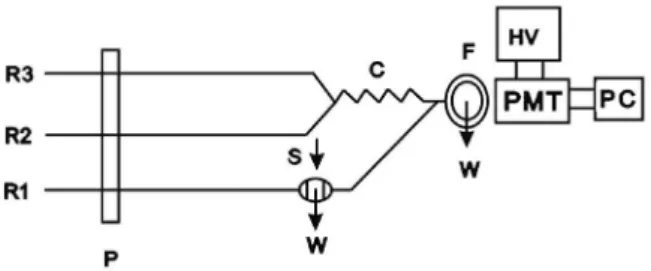
A schematic diagram of the low system is shown in Figure 1. The CL signal was measured with a CL analyzer with PMT (Model R212, Hamamatsu, Japan) and low pass filter whose output was connected to data processing system. A 12-channels peristaltic pump (Desaga, Model PLG, USA) with three silicon rubber tubes (1.0 mm i.d.) was used. PTFE mixing joints and PTFE tubing (1.0 mm i.d.) were used for the connections. The low cell was U shape with 0.6 mL inner volume and 0.5 cm distance from the PMT. Sample solutions were injected using a six position rotary valve.
Experimental procedure
As shown in Figure 1, channels containing carrier H2O (R1), Ce(IV) solution in sulfuric acid (R2) and Ru(II) solution (R3) were pumped at 3.2 mL min–1 (for each channel) via a peristaltic pump. At joint S, an aliquot (420 µL) of standard solution of perphenazine was injected into the carrier stream by a sample injection valve. R2 and R3 solutions were mixed through 10 cm reaction coil (silicon tube, 1.0 mm i.d.) and then mixed with
perphenazine exactly in front of PMT to produce peak-like CL emission that is monitored on a computer to smooth the signal and to determine the peak height.
Preparation of perphenazine tablets
Ten tablets (2 mg per tablet) were weighed and powdered. An accurately weighed portion of the powder, equivalent to 2.0 mg of active ingredient, was transferred into a 100.0 mL calibrated lask containing 50 mL water and the mixture was sonicated for 10 min. Thereafter the volume was adjusted to 100 mL with water and the suspension was iltered. The sample solution was diluted with water, prior to determination step, to obtain the appropriate concentration for analysis.
Preparation of perphenazine injection
Contents of ive ampoules (5 mg mL–1) were transferred into a small beaker. According to manufacturer’s speciication, an aliquot (1 mL) of the drug was diluted serially to obtain the appropriate concentration for analysis.
Procedure for spiked serum
For serum samples only a deproteination process was carried out by using acetonitrile as a sample pretreatment, an extraction procedure was not necessary.30 An aliquot of standard solution of perphenazine was added to 1.0 mL of serum sample in a centrifuge tube and mixed for 2 min. A volume of 2 mL of acetonitrile was added and centrifuged at 4000 rpm for 15 min. The protein-free supernatant was transferred into a small conical lask and evaporated to dryness under a stream of nitrogen at room temperature. The dry residue was dissolved in 25.0 mL of water. A blank value was determined by treating drug-free serum in the same way. The absolute recovery was determined by comparing the representative peak height of serum sample with the peak height of the standard drug at the same concentration.
Results and Discussion
Method is based on rapid reduction of [Ru(phen)3]3+ produced in the reaction between [Ru(phen)3]2+and acidic Ce(IV) by perphenazine that it produces strong CL.
Single factor at a time optimization
Initial preliminary experiments using the classical single factor at a time method served to detect the variables and
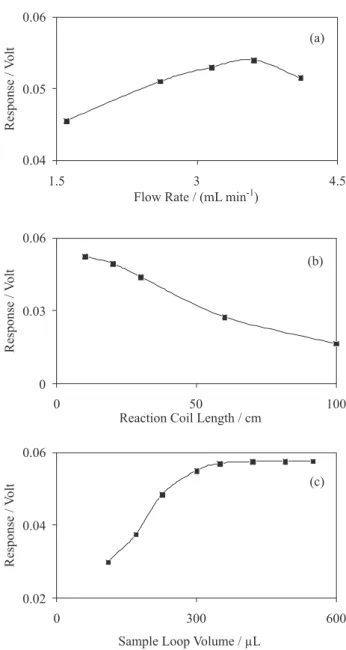
their respective working ranges that have inluence on the CL intensity. Optimization results of manifold variables have been shown in Figure 2. For achieving a fast and sensitive method, decreasing the material consumption and preventing of peak broadening, optimum values for the manifold variables were selected as follows: 3.2 mL min–1 (for each channel), 10 cm and 420 µL for the low rate, reaction coil length and sample injection volume, respectively.
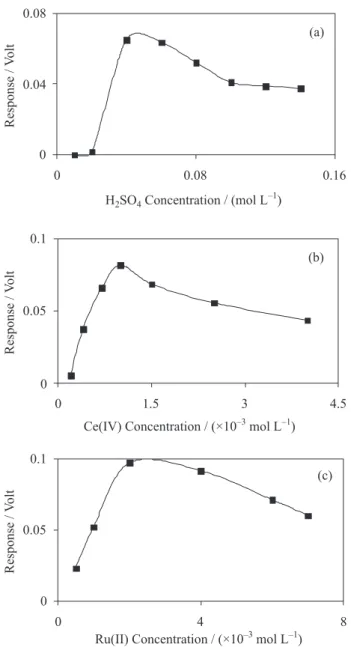
Single factor at a time optimization of the chemical variables was also performed at optimum condition of manifold variables. Results are shown in Figure 3. According to the results, 1.0×10⁻³, 2.0×10⁻³ and 0.04 mol L–1 were selected as optimum concentrations for Ce(IV), Ru(II) and H2SO4, respectively.
Figure 2. Single factor using a time optimization of manifold variables; a) low rate, b) reaction coil length, c) sample loop volume. Experiments were performed at 880 ng mL–1 of perphenazine, 1.0×10⁻³ mol L–1 of Ru(II) and 2.0×10⁻³ mol L–1 of Ce(IV) in 0.08 mol L–1 of H
Experimental design and response surface modeling
All computations were performed using Matlab (The Math-Works Inc., Natick, MA, USA).
After detecting respective working ranges of the variables, three chemical variables including concentrations of Ru(II), Ce(IV) and H2SO4 along with low rate were studied using CCD. As it can be seen in Figure 2, some manifold variables (injection volume and reaction coil) almost have linear changes in the range which they were studied. Therefore optimum conditions of these manifolds obtained by single factor at a time method were used in the multivariate optimization of chemical variables (optimum conditions of these two manifolds supposed to be the same
in both single factor at a time and multivariate methods). In the optimization step, concentration of perphenazine was 880 ng mL–1, similarly to that used in the single factor at a time method.
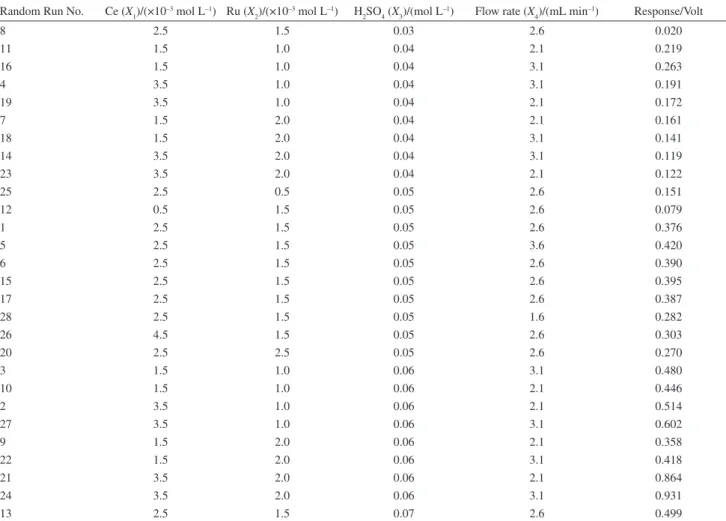
CCD including four factors and ive levels for each factor (α = 2) was designed for the experiments. The coded
levels of the variables together with their real experimental values are given in Table 1 and experiments are listed in Table 2.
In order to describe the way in which the variables are related and the way in which they influence the response, response surface methodology (RSM)24 was used to assemble the model. Therefore, the data obtained from the set of conditions employed by the CCD were it to the following parametric equation (full second order polynomial).
ICL= b0 + b1X1 +b2X2 + b3X3 + b4X4+ b5X1X2 + b6X1X3 + b7X1X4 + b8X2X3 +b9X2X4 b10X3X4 + b11X12 + b
12X2 2 + b13X32 + b
14X4
2 (1)
Where ICL (CL intensity) is the response, b0 is the intercept, Xs are the four variables, b1-b4 are the linear parameters, b5-b10 represents the interaction parameters and b11-b14 are the quadratic parameters. Table 3 gives the estimates of 15 parameters, contained in equation 1 obtained by the matrix least squares.
The signiicance of regression was tested by the p value and found to be highly signiicant. Analysis of variance (ANOVA) of the results showed that Ce(IV) and H2SO4 concentrations along with interaction between them were important terms and they had a statistically signiicant effect on the CL Intensity (p < 0.05 at a 95% conidence level).
Analysis of the residuals from the regression model and the lack of it test revealed that the second order polynomial model, tentatively assumed, would be an adequate description of the surface over the region studied. The operational optimum was determined using a grid method on equation 1, while gradually varying factor levels from –2 to +2. The levels corresponding to the maximum response
Table 1. Factor levels and their respective actual values used in the CCD
Coded levels
Ce(IV)/ (×10–3 mol L–1)
Ru(II)/ (×10–3 mol L–1)
H2SO4/ (mol L–1)
Flow Rate/ (mL min–1)
–α 0.5 0.5 0.03 1.6
–1 1.5 1.0 0.04 2.1
0 2.5 1.5 0.05 2.6
+1 3.5 2.0 0.06 3.1
+α 4.5 2.5 0.07 3.6
selected as optimum levels.24 The optimum levels and their respective actual values are shown in Table 4.
Typical CL proiles for three different concentrations including 880.0, 440.0 and 44.0 ng mL–1 of perphenazine at optimum conditions obtained using RSM (Figure 4a) and optimum conditions obtained using single factor at a time method (Figure 4b) were compared to each other. As it can be seen in Figure 4, optimization using RSM method with respect to conventional single factor at a time method shows a signiicant improvement in the sensitivity (approximately nine times).
The results obtained by experimental design procedure were better than single factor at a time method. The main reason could be due to interaction between variables. The portion of these interactions in multivariate optimization methods could be calculated and employed in optimization of variables. But in the univariate optimization of variables, effect of these interactions could not be determined. Therefore optimum conditions obtained by single factor at a time method will be different from real optimum conditions when interactions between variables are important.
Table 2. Design matrix designed by CCD and responses obtained for each experiment
Random Run No. Ce (X1)/(×10–3 mol L–1) Ru (X 2)/(×10
–3 mol L–1) H
2SO4 (X3)/(mol L
–1) Flow rate (X
4)/(mL min
–1) Response/Volt
8 2.5 1.5 0.03 2.6 0.020
11 1.5 1.0 0.04 2.1 0.219
16 1.5 1.0 0.04 3.1 0.263
4 3.5 1.0 0.04 3.1 0.191
19 3.5 1.0 0.04 2.1 0.172
7 1.5 2.0 0.04 2.1 0.161
18 1.5 2.0 0.04 3.1 0.141
14 3.5 2.0 0.04 3.1 0.119
23 3.5 2.0 0.04 2.1 0.122
25 2.5 0.5 0.05 2.6 0.151
12 0.5 1.5 0.05 2.6 0.079
1 2.5 1.5 0.05 2.6 0.376
5 2.5 1.5 0.05 3.6 0.420
6 2.5 1.5 0.05 2.6 0.390
15 2.5 1.5 0.05 2.6 0.395
17 2.5 1.5 0.05 2.6 0.387
28 2.5 1.5 0.05 1.6 0.282
26 4.5 1.5 0.05 2.6 0.303
20 2.5 2.5 0.05 2.6 0.270
3 1.5 1.0 0.06 3.1 0.480
10 1.5 1.0 0.06 2.1 0.446
2 3.5 1.0 0.06 2.1 0.514
27 3.5 1.0 0.06 3.1 0.602
9 1.5 2.0 0.06 2.1 0.358
22 1.5 2.0 0.06 3.1 0.418
21 3.5 2.0 0.06 2.1 0.864
24 3.5 2.0 0.06 3.1 0.931
13 2.5 1.5 0.07 2.6 0.499
Table 3. Regression results and analysis of variance of RSM
Source Parameter Parameter Estimate
P Value
Intercept b0 0.773 0.0000
Ce(IV) A b1 0.123 0.0172
Ru(II) B b2 0.038 0.4087
H2SO4 C b3 0.349 < 0.0001
Flow D b4 0.047 0.3192
AB b5 0.110 0.0660
AC b6 0.174 0.0074
AD b7 0.006 0.9165
BC b8 0.105 0.0798
BD b9 –0.011 0.8480
CD b10 0.027 0.6316
AA b11 –0.057 0.2244
BB b12 –0.048 0.3091
CC b13 –0.023 0.6129
DD b14 0.023 0.6250
Model 0.0009
R2 0.92
Adjusted R2 0.85
(r2 = 0.9978), in that C
Perphenazine is concentration of perphenazine (ng mL–1). The limit of detection was 0.4 ng mL–1 (S/N = 3) and relative standard deviation for 6 replicates determination of a solution containing 70.5 ng mL–1 of perphenazine was < 4%. Sample throughput was 100 ± 5 samples per hour.
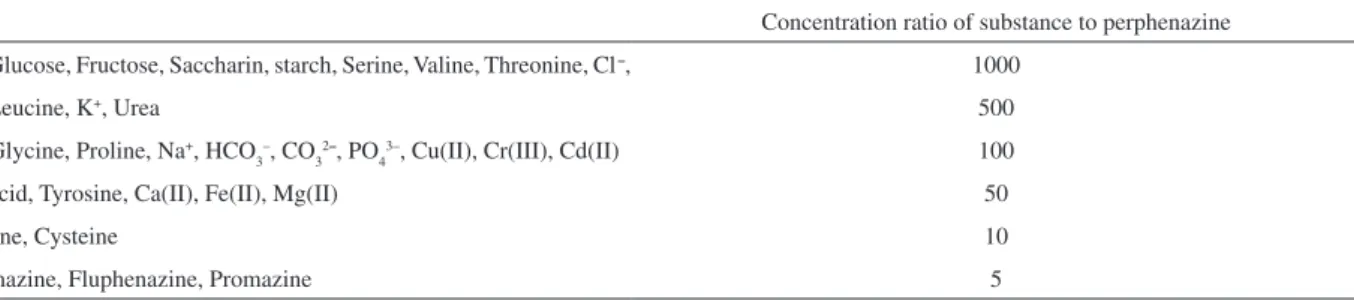
Inluence of interfering substances
In order to validate based on the possible analytical application of the method, interference effect of some common ions, excipients in pharmaceutical preparation and some amino acids commonly present in human serum were studied by recovering 44.0 ng mL–1 of perphenazine in presence of each substance. The tolerance of each substance was taken as the largest amount yielding an error lower than 3σ in the analytical signal of 44.0 ng mL–1 perphenazine (σ is the standard deviation in signal for 10 times
replication of 44.0 ng mL–1). It was found that the presence of the common excipients of pharmaceuticals and some amino acids did not interfere in the determination of the studied drug, indicating high accuracy and suitability for determination of perphenazine in human serum and quality assurance in drug formulations. Results are shown in Table 5.
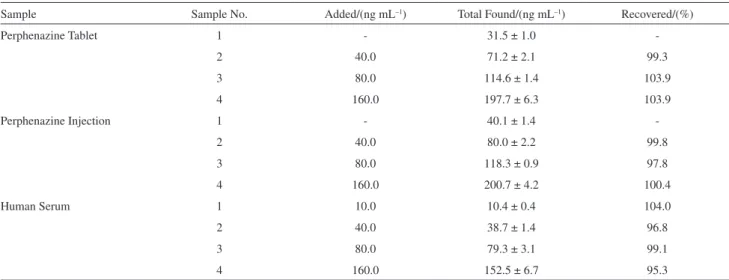
Application
In order to evaluate the applicability of the proposed method, two perphenazine drugs and spiked human serum were analyzed to determine their perphenazine contents. Table 6 shows the results of the recovery studies of perphenazine from drugs and spiked serum. Results show good reproducibility and accuracy of the method. The proposed method was further applied to the analysis of certain dosage forms containing perphenazine. Results in Table 7 are in agreement with those obtained by the oficial method.31 Statistical analysis of the results using student
t-test and the variance ratio F-test showed no signiicant difference between the performance of the two methods based on accuracy and precision.
Table 4. The optimum levels and their respective actual values obtained by response surface modeling
Variable Coded Level Actual Level
Ce(IV) +1.48 3.98×10⁻³ mol L–1
Ru(II) +0.92 1.96×10⁻³ mol L–1
H2SO4 +2.00 0.07 mol L–1
Flow Rate +0.76 3.22 mL min–1
Figure 4. Comparison between optimizations using conventional single factor at a time and RSM methods; a) Optimization using RSM, b) Optimization using single factor at a time; I: 880.0, II: 440.0, III: 44.0 ng mL–1.
Analytical features
T h e r e s u l t s s h o w t h a t a r e l a t i v e l y w i d e linear dynamic range is obtained in the range of 1.2-1,300 ng mL–1 which its linear equation was: ICL = 0.0011(± 0.0000) CPerphenazine – 0.0003 (± 0.0001),
Table 5. Effect of foreign substances on the determination of 44 ng mL–1 perphenazine
Substance Concentration ratio of substance to perphenazine
Sucrose, Glucose, Fructose, Saccharin, starch, Serine, Valine, Threonine, Cl–, 1000
Lactose, Leucine, K+, Urea 500
Alanine, Glycine, Proline, Na+,HCO 3
–, CO 3
2–, PO
4
3–, Cu(II), Cr(III), Cd(II) 100
Aspartic acid, Tyrosine, Ca(II), Fe(II), Mg(II) 50
Tryptophane, Cysteine 10
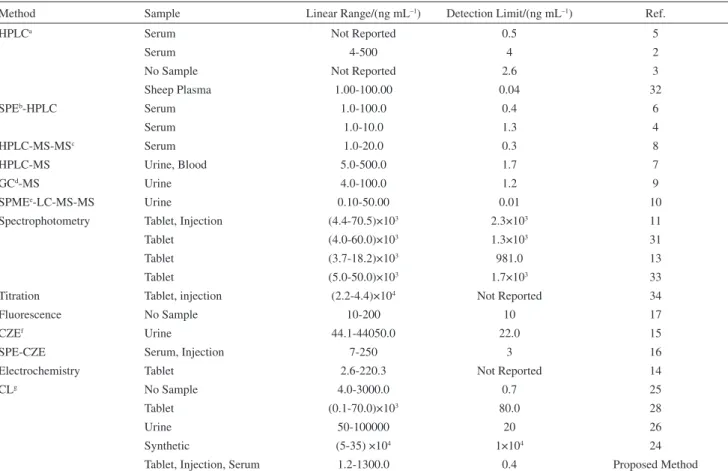
Response characteristics
In the Table 8, response characteristics of the proposed method are compared with recently reported methods. In comparison with CL methods,24-26,28 the proposed method is sensitive with a wide linear dynamic range, moreover it has been applied for the quantiication of perphenazine in human serum and pharmaceuticals. Some of the sensitive methods in Table 8, besides chemical information for perphenazine, provide multianalyte information about related species, compounds and metabolites presented in the sample. However they have a complex, time consuming and expensive instrumentation and some of them use a preconcentration method before the measurement.4-10,16,32 The proposed system is an easy, cheap and fast analytical tool for obtaining of preliminary chemical information about perphenazine, prior the use of more complex instrumental techniques.
Possible CL mechanism
Some CL pathways might be proposed for the [Ru(phen)3]+2 - Ce(IV) - perphenazine CL system, involving
the formation of Ce(III)*, oxidation products in excited state (such as sulphone derivative) and [Ru(phen)3]2+*. To explore the possible CL mechanism, some experiments performed and following results were obtained. (i) A weak CL response was recorded when [Ru(phen)3]2+ solution was mixed with acidic Ce(IV) solution. Enhancement in CL response was detected when perphenazine solution was injected into the mixed solution of [Ru(phen)3]2+ and acidic Ce(IV). (ii) Fluorescence spectrum of Perphenazine (λ
ex = 253 nm) was scanned using spectroluorometer (Jasco, model FP-750) using batch mode. Perphenazine had a maximum emission wavelength at 460 nm (Figure 5a). This peak was disappeared when Ce(IV) solution was added into the cuvette and new peak appeared at 375 nm (Figure 5b). These are due to oxidation of perphenazine and formation of Ce(III) that is a well known luorescent ion.35 Fluorescence emission spectrum of [Ru(phen)
3] 2+ (λ
ex = 450 nm), had a maximum at 582 nm (Figure 5c). (iii) CL spectra of mixtures including Ce(IV)-perphenazine (Figure 6a), Ce(IV)-[Ru(phen)3]2+ (Figure 6b) and Ce(IV)-[Ru(phen)3]2+-perphenazine (Figure 6c) were obtained using spectrofluorometer (Jasco, model FP-750). No detectable CL response obtained for the irst mixture. This suggests that oxidation products and Ce(III)* are not main emitters. Moreover both spectra of second and third mixtures had the same maximum emission wavelength at 581 nm which is same as maximum fluorescence emission of [Ru(phen)3]2+. This indicated that the CL spectra were independent of perphenazine and the emitter is [Ru(phen)3]2+*.
Perphenazine is a tertiary amine and from previous studies, the oxidation of tertiary amines is understood to produce a short-lived radical cation. The α-carbon is then
deprotonated, yielding a strongly reducing intermediate.
Table 6. Determination of perphenazine in commercial formulations and human serum
Sample Sample No. Added/(ng mL–1) Total Found/(ng mL–1) Recovered/(%)
Perphenazine Tablet 1 - 31.5 ± 1.0
-2 40.0 71.2 ± 2.1 99.3
3 80.0 114.6 ± 1.4 103.9
4 160.0 197.7 ± 6.3 103.9
Perphenazine Injection 1 - 40.1 ± 1.4
-2 40.0 80.0 ± 2.2 99.8
3 80.0 118.3 ± 0.9 97.8
4 160.0 200.7 ± 4.2 100.4
Human Serum 1 10.0 10.4 ± 0.4 104.0
2 40.0 38.7 ± 1.4 96.8
3 80.0 79.3 ± 3.1 99.1
4 160.0 152.5 ± 6.7 95.3
Table 7. Analysis of some dosage forms containing perphenazine using the proposed and oficial methods
Drug Claimed Recovery
Proposed Methoda
Oficial Methoda 31
Perphenazine Injection/(mg mL–1)
5 5.01 ± 0.17 5.08 ± 0.07
Perphenazine Tablet/mg
2 1.97 ± 0.06 1.99 ± 0.03
This reduces the [Ru(phen)3]3+ (produced by oxidant) to the excited state that subsequently emits light.30,36-38
According to the above discussion, the following mechanism is proposed for the CL reaction of perphenazine. [Ru(phen)3]2+ + Ce(IV) → Ce(III) + [Ru(phen)
3] 3+
Perphenazine + Ce(IV) → Ce(III) + Perphenazine+• Perphenazine+•→ Perphenazine• + H+
[Ru(phen)3]3+ + Perphenazine• + H
2O → [Ru(phen)3] 2+* + Perphenazine fragments
[Ru(phen)3]2+* → [Ru(phen) 3]
2+ + hν Table 8. Comparison between recently reported methods and proposed method
Method Sample Linear Range/(ng mL–1) Detection Limit/(ng mL–1) Ref.
HPLCa Serum Not Reported 0.5 5
Serum 4-500 4 2
No Sample Not Reported 2.6 3
Sheep Plasma 1.00-100.00 0.04 32
SPEb-HPLC Serum 1.0-100.0 0.4 6
Serum 1.0-10.0 1.3 4
HPLC-MS-MSc Serum 1.0-20.0 0.3 8
HPLC-MS Urine, Blood 5.0-500.0 1.7 7
GCd-MS Urine 4.0-100.0 1.2 9
SPMEe-LC-MS-MS Urine 0.10-50.00 0.01 10
Spectrophotometry Tablet, Injection (4.4-70.5)×103 2.3×10³ 11
Tablet (4.0-60.0)×103 1.3×10³ 31
Tablet (3.7-18.2)×103 981.0 13
Tablet (5.0-50.0)×103 1.7×10³ 33
Titration Tablet, injection (2.2-4.4)×104 Not Reported 34
Fluorescence No Sample 10-200 10 17
CZEf Urine 44.1-44050.0 22.0 15
SPE-CZE Serum, Injection 7-250 3 16
Electrochemistry Tablet 2.6-220.3 Not Reported 14
CLg No Sample 4.0-3000.0 0.7 25
Tablet (0.1-70.0)×103 80.0 28
Urine 50-100000 20 26
Synthetic (5-35) ×104 1×10⁴ 24
Tablet, Injection, Serum 1.2-1300.0 0.4 Proposed Method
aHigh performance liquid chromatography; bSolid phase extraction; cMass spectrometry; dGas chromatography; eSolid-phase micro extraction; fCapillary zone electrophoresis; gChemiluminescence.
Figure 5. The luorescence spectrum of a) Perphenazine (20.0 µg mL–1) at λ
ex = 253 nm, b) Perphenazine (2 mL 20.0 µg mL
–1) and Ce(IV) (200 µL (3.0×10⁻³ mol L–1 in 0.08 mol L–1 of H
2SO4)) , at λex = 253 nm, c) [Ru(phen)3]2+ (1.0×10⁻³ mol L–1 ), at λ
ex = 450 nm. The weak peak at 450 nm is due to Rayleigh scattering of [Ru(phen)3]2+.
Figure 6. The CL spectrum of a) Ce(IV) – perphenazine, b) Ce(IV) – [Ru(phen)3]2+, c) Ce(IV) – [Ru(phen)
3]
2+ - perphenazine. Conditions: a) 2 mL perphenazine (20.0 µg mL–1) and 200 µL Ce(IV) (3.0×10⁻³ mol L–1 in 0.08 mol L–1 of H
2SO4), b) 2 mL [Ru(phen)3]
2+ (1.0×10⁻³ mol L–1) and 200 µL Ce(IV) (3.0×10⁻³ mol L–1 in 0.08 mol L–1 of H
2SO4), c) 2 mL [Ru(phen)3]2+ (1.0×10⁻³ mol L–1 ), 200 µL perphenazine (20 µg mL–1) and 200 µL Ce(IV) (3.0×10⁻³ mol L–1 in 0.08 mol L–1 of H
Conclusions
A new CL method was proposed for the low injection quantiication of perphenazine. The method is simple, sensitive and rapid with wide linear dynamic range between 1.2 and 1,300 ng mL–1 and has been used to determine perphenazine in pharmaceuticals and human serum. Moreover some common sugars, amino acids and ions did not present any signiicant interference effects in the quantiication of perphenazine. Therefore high accuracy and precision determination of perphenazine could be performed in human serum and drug formulations by the proposed method. Because of interaction between CL variables, experimental design is useful and important part in CL detections but it simply disregarded in many CL measurements. One future trend might be the combination of the proposed CL system ([Ru(phen)3]2+ and acidic Ce(IV)) which was used previously for the determination of some other phenothiazines,22 with liquid chromatography equipment, developing a proper technique for the determination of phenothiazines in various matrixes and pharmaceuticals.
Acknowledgments
The authors thank to the Research Council and Center of Excellency in Sensor of Isfahan University of Technology (IUT) for supporting of this work.
References
1. Zeng, B.; Yang, Y.; Ding, X.; Zhao, F.; Talanta2003, 61, 819. 2. Tanaka, E.; Nakamura, T.; Terada, M.; Shinozuka, T.;
Hashimoto, C.; Kurihara, K.; Honda, K; J. Chromatogr., B
2007, 854, 116.
3. Diehl, G.; Karst, U.; J. Chromatogr., A2000, 890, 281. 4. Hrdlicka, A.; Durdova, Z.; Hadasova, E.; J. Liq. Chromatogr.
Relat. Technol.1997, 20, 935.
5. Foglia, J. P.; Sorisio, D.; Kirshner, M. A.; Mulsant, B. H.; Perel, J. M.;J. Chromatogr., B 1995, 668, 291.
6. Helle, R.; Petersen, A.; Ther. Drug Monit. 2001, 23, 157. 7. Josefsson, M.; Kronstrand, R.; Andersson, J.; Roma, M.;
J. Chromatogr., B2003, 789, 151.
8. Kirchherr, H.; Velten, W. N. K.; J. Chromatogr., B2006, 843, 100.
9. Ventura, R.; Casasampere, M.; Berges, R.; Moran, J. F.; Segura, J.; J. Chromatogr., B2002, 769, 79.
10. Kumazawa, T.; Seno, H.; Suzuki, K. W.; Hattori, H.; Ishii, A.; Sato, K.; Suzuki, O.; J. Mass Spectrom.2000, 35, 1091. 11. Wang, R. Y.; Lu, Y. T.; Spectrochim. Acta, Part A2005, 61, 791.
12. Carreto, M. L.; Lunar, L.; Rubio, S.; Bendito, D. P.; Anal. Chim. Acta1997, 349, 33.
13. Markopoulou, C. K.; Malliou, E. T.; Koundourellis, J. E.; J. Pharm. Biomed. Anal.2005, 37, 249.
14. Zeng, S. B.; Yang, Y.; Ding, X.; Zhao, F.; Talanta2003, 61, 819. 15. Liu, D.; Jin, W.; J. Chromatogr., B2003, 789, 411.
16. Malecek, J.; Hadasova, E.; Havel, J.;J. Capillary Electrophor. Microchip Technol.1999, 6, 151.
17. White, V. R.; Frings, C. S.; Villafranca, J. E.; Fitzgerald, J. M.;
Anal. Chem.1976, 48, 1314.
18. Fletcher, P.; Andrew, K. N.; Calokerinos, A. C.; Forbes S.; Worsfold, P. J.; Luminescence2001, 16, 1.
19. Fahnrich, K. A.; Pravda, M.; Guilbault, G. G.; Talanta2001,
54, 531.
20. Gerardi, R. D.; Barnett, N. W.; Lewis, S. W.; Anal. Chim. Acta
1999, 378, 1.
21. Gorman, B. A.; Francis, P. S.; Barnett, N. W.; Analyst2006,
131, 616.
22. Choi, H. N.; Cho, S. H.; Park, Y. J.; Lee, D. W.; Lee, W. Y.;
Anal. Chim. Acta2005, 541, 49.
23. Han, H. Y.; He, Z. K.; Zeng, Y. E.; Fresenius J. Anal. Chem.
1999, 364, 782.
24. Sultan, S. M.; Abdennabi, A. M. S.; Almuaibed, A. M.; Talanta
1999, 49, 1051.
25. Li, Y.; Niu, W.; Lu, J.; Talanta2007, 71, 1124. 26. Niu, W.; Nie, F.; Lu, J.; Anal. Sci.2006, 22, 971.
27. Niu, W.; Feng, N.; Nie, F.; Lu, J.; Anal. Bioanal. Chem. 2006,
385, 153.
28. Han, X.; Tang, Y.; Yu, C.; Zheng, X.; Jin, Q.; Anal. Lett. 2005,
38, 1933.
29. http://www.fao.org/Wairdocs/ILRI/x5546E/x5546e0a.htm, accessed in February 2009.
30. Aly, F. A.; Al-Tamimi, S. A.; Alwarthan, A.; Talanta2001, 53, 885.
31. Regulska, E.; Tarasiewicz, M.; Tarasiewicz, H. P.; J. Pharm. Biomed. Anal. 2002, 27, 335.
32. Pedernera, C.; Ruiz, J. L.; Castells, G.; Manteca, X.; Cristofol, C.; J. Chromatogr., B2007, 854, 308.
33. Kojo, A.; Calatayud, J. M.; Talanta1995, 42, 909.
34. Farhadi, K.;Shamsipur, M.; Acta Chim. Slov. 2003, 50, 395. 35. Campiglio,A.; Analyst 1998, 123, 1571.
36. Thongpoon, C.; Liawruangrath, B.; Liawruangrath, S.; Wheatley, R. A.; Townshend, A.; Anal. Chim. Acta2005, 553, 123.
37. Greenway, G. M.; Dolman, S. J. L.; Analyst1999, 124, 759. 38. Chen, X.; Yi, C.; Li, M.; Lu, X.; Li, Z.; Li, P.; Wang, X.; Anal.
Chim. Acta2002, 466, 79.