Article
J. Braz. Chem. Soc., Vol. 22, No. 1, 38-48, 2011. Printed in Brazil - ©2011 Sociedade Brasileira de Química 0103 - 5053 $6.00+0.00
A
*e-mail: [email protected]
Quantitative Determination of Some Water-Soluble B Vitamins by Kinetic
Analytical Method Based on the Perturbation of an Oscillatory Reaction
Jelena P. Maksimović,a Ljiljana Z. Kolar-Anić,a Slobodan R. Anić,a
Dragana D. Ribiča and Nataša D. Pejić*,b
aFaculty of Physical Chemistry, University of Belgrade, Studentski trg 12-16, P.O. Box 47,
11000 Belgrade, Serbia
bDepartment of Physical Chemistry, Faculty of Pharmacy, University of Belgrade,
Vojvode Stepe 450, 11000 Belgrade, Serbia
Um novo procedimento para a determinação da cinética de algumas vitaminas solúveis em água
do grupo B (tiamina (B1), ribolavina (B2), niacina (B3) e piridoxina (B6)), pelas perturbações da
concentração do sistema químico oscilatório de Bray-Liebhafsky (BL), na presença de íons iodeto e de hidrogênio é proposto e validado. O método usa um eletrodo de Pt para o monitoramento potenciométrico das perturbações de concentração da matriz BL em um estado estacionário de não equilíbrio, estável, próximo ao ponto de bifurcação. O método proposto baseia-se na relação
linear entre as diferenças de potencial máximas, ∆Em, causadas pelas quantidades adicionais
conhecidas da espécie B. Sob condições analíticas ótimas, curvas de calibração lineares foram obtidas no intervalo de 0,01-1,0; 0,016-0,128; 5,0-50,0 e 0,05-2,5 mmol com limites de detecção de 0,01; 0,018; 2,6 e 0,03 mmol, assim como velocidade analítica de 30, 5, 12 e 20 determinações
por hora, para B1, B2, B3 e B6, respectivamente. A abordagem técnica usada também proporciona
um método simples, efetivo e conveniente para o ensaio de formulações farmacêuticas contendo
B1 em conjunto com outros princípios ativos como a nicotinamida e vitamina B12, bem como B3.
A novel procedure for kinetic determination of some water-soluble vitamins of the B-group
(thiamine (B1), ribolavin (B2), niacin (B3) and pyridoxine (B6)) by the concentration perturbations
of the Bray-Liebhafsky (BL) oscillatory chemical system involving the catalytic decomposition of hydrogen peroxide in the presence of both hydrogen and iodate ions is proposed and validated. The method uses a Pt electrode for potentiometric monitoring of the concentration perturbations of the BL matrix in a stable non-equilibrium stationary state close to the bifurcation point. The
proposed method relies on the linear relationship between maximal potential displacements, ∆Em,
caused by the additional known quantities of a B species. Under the optimal established analytical conditions, linear calibration curves were obtained over the range of 0.01-1.0, 0.016-0.128,
5.0-50.0 and 0.05-2.5 µmol with the limits of detection of 0.01, 0.018, 2.6 and 0.03 µmol, as
well as analytical throughput of 30, 5, 12 and 20 determinations per hour, for B1, B2, B3 and B6,
respectively. The used technical approach also provides simple, effective and convenient method
to assay the pharmaceutical formulations containing B1 together with other active principles such
as nicotinamide and vitamin B12 as well as B3.
Keywords: pulse perturbations, Bray-Liebhafsky oscillatory reaction, kinetic determination, water-soluble B vitamins, pharmaceutical preparations
Introduction
A considerable number of publications in which B vitamins were determined individually and simultaneously in pharmaceutical dosage forms using many methods that were developed with largely linear range and lower
detection limit including kinetic analytical method having H2O2-KSCN-CuSO4 and Mn(II)-BrO3−-diacetone-H
2SO4
oscillatory reaction systems as matrices,1,2 were found.
oscillatory reaction system is its application to analytical chemistry, as well as its particularly analytical use to determine various biologically and pharmaceutically important compounds1-14 which could be of beneit to life
sciences in the future. As an analytical method it has been recognized more and more to be useful and convenient.1-22
In this ield, the using of analyte pulse perturbation (APP) technique in both oscillatory21 and stable steady state in
vicinity of bifurcation point,7-13 the uses of the largest
Lyapunov exponent22 and the high-sensitive oscillating
chemical system17 make the technique almost perfect
and consequently favorable to use it in the really routine analysis.
The irst above-mentioned method21 is based on the
relationship between the concentrations of analyte and the response of the matrix in the oscillatory state with respect to the main characters of oscillations, such as amplitude, period and others. For both analyzed vitamin B6 (pyridoxine)1 and vitamin B
2,2 the amplitude of the
second response cycle as well as the change of the oscillating period (∆t), were correlated with the amount
of analyte added. In the second method7-13 based on
perturbing the matrix that was in a stable stationary state in the vicinity of a bifurcation point, only relationship between the maximal potential displacement (∆Em) in
the moment of perturbation and the logarithm of analyte concentrations would be analyzed. When using the matrix that is in a stable steady state, it is not necessary to test oscillatory phases nor to perturb the matrix always in the same selected oscillatory phase point, which turns out to be a very delicate moment. Compared with the matrix being in the oscillatory state, the regeneration of the matrix being in the stable non-equilibrium stationary state (stable steady state) is considerably shorter.
This paper describes the method for the quantitative determination of some water-soluble B vitamins in the BL matrix generated in continuously fed well stirred tank reactor (CSTR)23-26 by electrode potential measurements.
For this purpose, the BL matrix,27,28 in a stable steady state
near a bifurcation point is perturbed with variable amounts of vitamins, which results in substantial changes in the potential of the matrix dynamic state that are relevant to the concentration of an analyte. In particular, the aim of this work is to demonstrate that the mentioned kinetic method can be successfully applied for quantitative determination of the mentioned vitamins in bulk drug and pharmaceutical formulations.
We need to underline that some other methods have been reported for the determination of the vitamin B-group.29-34 The wide linear range (of about two order
of magnitude; occasionally more than two) and low
detection limit (ca.10−6-10−7 mol L−1, occasionally down
to 10−8 mol L−1) of the above-mentioned methods satisfy
the requirements of most determinations. However, the determination of water-soluble vitamins has always been an unpleasant problem mostly due to instability of these substances and complexity of the matrices in which they usually exist. In addition, some of the proposed analytical methods are cumbersome, time-consuming or not enough accurate. Therefore, rapid methods based on a relatively simple and inexpesive equipment is desirable. In this sense, the described kinetic analytical method for quantitative determination of vitamins provides a promising alternative to some instrumental methods due to its low cost instrumentation and rapid detection procedure. The main advantage of the proposed method is its simplicity of operation, in fact, it requires no derivatization reaction nor any time-consuming extraction procedure. In addition, our method involved neither sophisticate instruments nor uncommon expensive reagents. As results, it can be implemented with the modular equipment available at any laboratory.
Experimental
Reagents and solutions
Only analytically graded reagents without further puriication were used for preparing of the solutions. Potassium iodate and sulfuric acid were obtained from Merck (Darmstadt, Germany), while hydrogen peroxide from Fluka (Buchs, Steinheim, Switzerlend). Thiamine (> 99%) and pyridoxine hydrochloride (> 98%) were obtained from Fluka, BioChemika (Buchs,
Switzerland), ribolavin (> 98%) from Acros Organics
(New Jersey, Belgium) and niacin (> 98%) from Alfa
Aesar (Karlsruhe, Germany). Stock solutions of feed substances (KIO3, H2SO4 and H2O2) as well as analytes (vitamins of B-group) were prepared in de-ionized water with the speciic resistance of 18 MΩ cm (Milli-Q,
Millipore, Bedford, MA, USA).
Standard stock solutions of vitamins B1, B6 and B3 were prepared at a concentration 1.0 × 10⁻¹ mol L−1 (B
1 and B6)
and 1 mol L−1 (B
3) by dissolving 0.8432 g, 0.4229 g and
3.0533 g, respectively of the pure substances in a 25 mL volumetric lask with water. Just because vitamin B2 has poor solubility and a slow soluble speed, a vitamin B2 solution (2.65 × 10⁻⁴ mol L−1) was prepared by dissolving
0.0997 g of B2 in a 1000 mL volumetric lask with water under ultrasonication (Bandelin Sonorex, Germany) for 5 min and thermostated at 60 °C for the same time in order
in brown volumetric lasks and stored in refrigerator in the dark. Prior to injection, stock solutions of each analyte were appropriately diluted with water before being used as working solutions.
Three pharmaceutical formulations containing vitamins B-group, vitamin B1 tablets (sample 1) and vitamin B3 tablets (sample 3) that were obtained from Now Foods, Bloomingdale, IL, 60108, USA as well as vitamin B-complex tablets (sample 2) was obtained from Srbolek, Belgrade, Serbia, bought in Serbian pharmacies, and analyzed by the procedure proposed.
Samples 1 and 3 contain 100 mg of thiamine and 500 mg of niacin, respectively. B-complex vitamin tablet (sample 2) contain 12.3 mg of B1, 5 mg of B6, 0.05 mg of vitamin B12, 0.4 mg of folic acid, 20 mg of nicotinamide and excipients. Aqueous stock solutions of the following substances (compounds) or excipients were also prepared for interference study: ascorbic acid, folic acid, citric acid, uric acid, carbamide, glucose, saccharine, fructose and starch.
Apparatus
The instrumental set-up used to implement the BL reaction, as the matrix, for the determination of analytes is shown schematically by Pejićet al.10 The oscillating
assembly is composed of a 50 mL glass CSTR vessel (Metrohm model 876-20, Herisau, Switzerland) wrapped in a water recirculation jacket connected to a thermostat (series U8, MLW Freital, Germany) with an accuracy of
± 0.1 °C. For homogenization of the reaction mixture,
a magnetic stirrer (Combimag RET, Staufen, Germany) was used. Peristaltic pumps (manuel/RS 232-controlled peristaltic pumps, Type 110, Ole Dich Instrumentmakers, Hvidovre, Denmark) controlled the lows (inlow and outlow) of reactants. Three of the channels were used to deliver the reactants (aqueous solutions of potassium iodate, sulfuric acid and hydrogen peroxide) and one channel of the other pump was used to remove the surplus volume of the reaction mixture through a U-shaped glass tube. In this way, the volume of the reaction mixture, keeps constant at 22.2 ± 0.2 mL.
A Pt electrode (Metrohm model 6.0301.100, Herisau, Switzerland) was used as the working electrode and a double-junction Ag/AgCl electrode (Metrohm model 6.0726.100) as the reference electrode against which all potential were recorded. An electrochemical analytical device (PC-Multilab EH4 16-bit ADC) connected with a personal computer was used to record the potential potential-time curves of the BL matrix. Signals were recorded as a function of time with time step 1.0 s.
Perturbation of the BL matrix was performed by manual injections. The analyte was introduced using micropipettes (Brand, Wertheim, Germany). A 50 µL shot was estimated to last about 0.5 s. The intensity of the perturbation corresponded to the total amount (in micromoles) of analyte injected in the 50 µL aliquot of standard samples.
Preparation of samples from tablets
To determine the vitamins from B-groups in the pharmaceutical preparation (sample 1, 2 and 3), ten tablets of each pharmaceutical were weighted, pulverized and the average mass of one tablet was evaluated. The sample solution was prepared by quantitatively transferring the average mass of one tablet, equivalent to 0.3809 g (sample 1), 0.3509 g (sample 2) and 0.9108 g (sample 3) in a 25-mL volumetric lasks as well as diluting to the volumes with water (samples 1 and 3); for sample 2, about 20 mL of water were added, the dispersion was shaken for 10 min in ultrasonic bath, the solutions were diluted to volumes with water and inally iltered through the ilter paper Whatman No. 1. Perturbations of the matrix were performed with suitable aliquot of the solution.
Procedure for determination of analytes
The start-up procedure was performed in the following way. First, thermostated (T = 56.0 ± 0.1°C) and protected
from light, the reaction vessel was illed up with the three separate inlows of the reactants, 5.90 × 10⁻² mol L−1
KIO3, 6.47 × 10⁻² mol L−1 H
2SO4 and 1.50 × 10⁻¹ mol L−1
H2O2, at the maximal low rate (12 mL min−1). Under these
conditions, within 3.5 min, about twice the volume of the reaction mixture becomes charged. Then, the inlows were stopped, the stirrer was turned on 900 rpm, and the excess of the reaction mixture was sucked out through the U-shaped glass tube, to achieve the actual reaction mixture volume 22.2 ± 0.2 mL. Hence, the reaction commenced under the
bath conditions. After two bath oscillations (after about 20 min) the inlows were turned on at the required speciic low rate 2.95 × 10⁻² min−1 and the inlow concentration of
sulfuric acid was varied in an interval, 6.47 × 10⁻² mol L−1
≤[H2SO4]≤ 9.00 × 10⁻² mol L−1. In this way, we examined
9.00 × 10⁻² mol L−1). Thus, after two bath oscillations
obtained under the above-mentioned conditions, the inlow concentration of sulfuric acid was immediately adjusted to the selected operation value. In this way, the validity of the preparatory procedure and the used chemicals was conirmed before the experiments. The preparatory procedure in all cases took about 40 min.
Results and Discussion
Effect of inlow concentration of sulfuric acid
The selection of the BL reaction,27,28,35-41 as the matrix,
for quantitative determination of vitamins B-group results from our profound understanding of its mechanism35,36,41
as well as from previous positive practice.7-13 The BL
reaction involves the catalytic decomposition of H2O2 in the presence of both H+ and IO
3− ions, and proceeds
through a very complex mechanism involving a number of iodine-containing intermediates such as I−, I
2, HIO
and HIO2.27,28,35-46 Thus, when BL reaction was run
in an open reactor such as CSTR, the range of non-monotonic dynamic behaviors increased dramatically and besides non-equilibrium stationary states and simple periodic oscillations, the complex oscillations, bursts and deterministic chaos26-28,47 were found as well. Moreover,
certain dynamic states exhibit extreme sensitivity that can be exploited for quantitative analysis.
For analytical purposes the appropriate dynamic state, that will be perturbed, ought to be selected; the location of the actual bifurcation point in the parameter phase space, which may vary slightly for different setups in different laboratories, is an analytical start point. With this aim, the investigation of dynamic behaviors of the BL system as a function of the control parameter (bifurcation analysis) must be performed before the actual analysis, but only once.
Under the CSTR conditions characterized by constant parameters such as inlow concentrations of [KIO3] = 5.90 ×
10−2 mol L−1 and [H
2O2] = 1.50 × 10⁻² mol L−1, temperature
T = 56.0 °C and speciic low rate, jo = 2.95 × 10⁻² min−1,
we examined the dynamics of the BL system by varying the inlow concentration of sulfuric acid from [H2SO4] =
6.47 × 10⁻² mol L−1 to [H
2SO4] = 9.00 × 10⁻² mol L−1. The
bifurcation diagram (Figure 1), showing the envelope of the simple periodic oscillations (for inlow concentration of sulfuric acid in the range 6.47 × 10⁻² mol L−1≤[H
2SO4]≤
7.46 × 10⁻² mol L−1 (zone I)) as well as stable stationary
states (for inlow concentration of sulfuric acid: 8.02 ×
10−2 mol L−1≤[H
2SO4]≤ 9.00 × 10⁻² mol L−1 (zone III))
is presented in Figure 1. Also, for inlow concentration of
sulfuric acid in the range 7.61 × 10⁻² mol L−1≤[H 2SO4]≤
7.88 × 10⁻² mol L−1 (zone II) a region of mode oscillations
was provided. The bifurcation point is found at [H2SO4] =
7.95 ×10⁻² mol L−1. Determination of a type of bifurcation
point does not have to be performed for the application of the analytical procedure. However, it is important for sensitivity of the system on perturbation, and it is interesting from scientiic point of view.48
Sensitivity of BL matrix to the perturbation
As can be seen from Figure 1, different dynamic states of BL matrix can be achieved with respect to inlow concentration of sulfuric acid as the control parameter. We chose to perform perturbations only in the stable non-equilibrium stationary states. As a rule, distance from the bifurcation point decreases the sensitivity to analytes examined.9-13 Therefore, around the found bifurcation
point we analyzed sensitivity of several stable stationary states, indicated by arrows in Figure 1, by perturbations of the matrix with the standard solutions of vitamin B1 and vitamin B3 in order to ind the maximum response to the analytes, i.e., the optimal injection point. In
particular, we perturbed the stationary states that were realized for the inlow concentration of sulfuric acid,
[H2SO4] = 8.16 × 10⁻² mol L−1, 8.44 × 10⁻² mol L−1 and
9.00 × 10⁻² mol L−1 (Figure 2). As can be seen from Figure 2,
the maximum response of the considered matrix system to selected concentration of B1 and B3 was obtained at
[H2SO4] = 8.44 × 10⁻² mol L−1. Consequently, the dynamic
Figure 1. Bifurcation diagrams showing transition from the stable
stationary state (solid circles - region III) to the large-amplitude oscillations (open circles - region I) through deterministic chaos formed of aperiodic mixed mode large (open circles) and small amplitude (triangle) oscillations (region II). Open circles and triangles denote minimal and maximal potentials in oscillations, whereas dash doted lines show the region of boundary between different dynamic structures: stable stationary states (III), periodic oscillatory states (I) and deterministic chaos (II). The bifurcation between stable and unstable steady state occurs at inlow concentration CH
2SO4 = 7.95 × 10
state at this acidity was chosen as optimal injection point for B1 and B3, as well as in the cases of the other examined analytes (vitamin B2 and vitamin B6).
The influence of a dynamic state obtained for inlow concentration [H2SO4] = 8.44 × 10⁻² mol L−1,
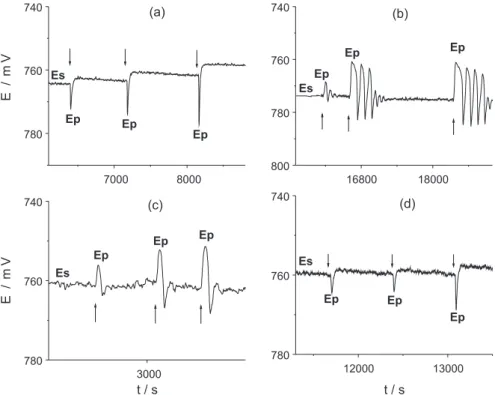
on the sensitivity of the matrix after perturbations is illustrated in Figure 3. The typical dynamic proiles obtained before and after perturbation of matrix system by the standard solutions of B1 (Figure 3a), B2 (Figure 3b), B3 (Figure 3c) and B6 (Figure 3d) under the above
described experimental conditions, are presented. Matrix response behavior was investigated by injecting examined analytes into the reaction mixture, when BL reaction was operated under the conditions where stable nonequlibrium stationary states endured. Thus, before perturbation, the system was in a stable stationary state, and the corresponding potential denoted as Es was constant. Injection of vitamin of B-group causes an abrupt change in potential. The potential value denoted as Ep is maximal (for B1 and B6) or minimal (for VB2 and VB3) value of the potential that is being reached. The change in potential (analytical signal) is deined as maximal potential displacement, ∆Em = Ep− Es.
Determination of vitamins of B-group
Under the selected experimental conditions described above, the response of the matrix to the perturbation was measured by employing the change in potential, ∆Em =
Ep− Es. For the examined compounds, as recommended
by ICH,49 a calibration was established over ive analyte
levels in triplicate. The igures of merit for the calibration graphs (regression equations and regression factor), in addition to other parameters of analytical interest (limit of detection (LOD), limit of quantiication (LOQ) and relative standard deviation (RSD) are all summarized in Figure 2. Inluence of inlow concentration of sulfuric acid on the
analytical signal. Curves a andbcorrespond to B1 and B3, respectively. In the cases a and b the amounts of B1 and B3 are 0.15 and 30 µmol, respectively.
Figure 3. Typical potentiometric responses of the BL matrix obtained after perturbations of the system being in the stable stationary state with different
Table 1. In accordance with ICH guidelines,49 the LOD
is deined as concentration of analyte that was produced signal-to-noise ratio of 3, where LOQ was assessed at a minimum signal-to-noise ratio of 10. These limits were experimentally veriied by three injections of analyte at the LOD and LOQ amounts that all give acceptable precision and accuracy under the ICH guidelines. The uncertainty of the estimated values (expressed as relative standard deviation, RSD) of the analyte concentrations arises from uncertainties in the estimated values of maximal potential shift, and it is propagated through all of the analysis using technique found in Bevington and Robinson.50
In the case of vitamins B1 and B6, ∆Em is linearly
proportional to the logarithm of the analyte concentrations. For vitamin B3, ∆Em is linearly proportional to the analyte
concentrations whereas in the case of vitamin B2, the calibration data obey the second-order polynomial equation (Table 1). Although the mentioned quantitative determination can be performed at all three tested inlow concentration of sulfuric acid, the determination at inlow of the acidity [H2SO4] = 8.44 × 10⁻² mol L−1
has a wider linear range, higher instrumental sensitivity (the slope obtained from the regression curve) and higher precision (Table 1). This is an additional reason why mentioned inlow concentration of sulfuric acid was used as the optimum acidity value for quantitative determinations of vitamins B-group.
Sample throughput (sample determinations per hour)
is required by the time needed for the system to recover to the initial stationary state after each perturbation. The proposed analytical procedure provided under the selected experimental conditions has an analytical throughput of 30, 5, 12 and 20 determinations per hour,
for vitamins B1, B2, B3 and B6, respectively, when sample volume of 50 µL was used.
In literature we can ind the quantitative determination of vitamins B6 and B2 based on the perturbation response of the oscillatory matrix. For vitamin B6 determination, the present method is characterized by lower limit of detection (0.025 µmol) and higher sample throughput (20
samples per hour) than the method based on perturbation
H2O2-KSCN-CuSO4-NaOH oscillatory reaction,1 although
the range of linearity of about two orders of magnitude is comparable with the mentioned method. On the other hand, the limit of vitamin B2 determination achieved in our study (0.018 µmol) is higher than that reported in oscillating
matrix Mn(II)-BrO3−-diacetone-H
2SO4.2 On the other hand,
using this matrix system that involves no important kinds of active oxygen, such as superoxide radical, requires UV irradiation setup for B2 determination; this fact makes the method based on perturbation of this matrix less convinient related to BL matrix in which oxygen is the product of reaction. In addition, here used method has important advantage over the mentioned methods1,2 that requires the
relationship between different oscillation characteristics and perturbation concentrations in the selected oscillatory phase point: (i) procedure is simplified and (ii) time
required for a full analysis is shortened considerably. Under the above experimental conditions, dynamic behaviors of the BL matrix, after perturbations with vitamins B2 and B3, are different from the ones obtained with vitamins B1 and B6; injection of B2 and B3 vitamins causes an abrupt decrease of the potentials to the values denoted as Ep (Figure 3). This sudden response was followed by oscillatory return to the initial stationary state (Figure 4). As can be seen from Figures 4a and 4b, the number of full cycles that appear after perturbation of stable steady state is proportional to the concentration of the examined species. Therefore, we may deine typical period,tp as the moment in which the BL matrix reverts to Table 1. Analytical parameters of thiamin (B1), ribolavin (B2), niacin (B3) and pyridoxine (B6)
Vitamin Acidity-inlow concentration/(mol L−1)
Linear range/µmol Regression equationa rb LODc/µmol LOQd/µmol RSDe/(%)
B1 0.0816 0.009-0.7 Y = 16.4 + 6.7 log X 0.9954 0.008 0.03 5.0
0.0844 0.01-1.0 Y = 17.6 + 8.4 log X 0.9986 0.01 0.035 4.4
0.0900 0.05-1.0 Y = 12.9 + 7.6 log X 0.9923 0.03 0.11 4.0
B2 0.0844 0.016-0.128 Y= 3.1 − 337.0 X +1409.5 X2 0.9985 0.018 0.05 4.5
B3 0.0816 5-40 Y = −8.9 − 0.2 X 0.9911 1.2 3.8 2.0
0.0844 5-50 Y = −0.91 − 0.43 X 0.9988 2.6 8.9 1.2
0.0900 5-50 Y = −2.7 − 0.35 X 0.9971 2.3 7.7 2.3
B6 0.0844 0.05-2.5 Y = 11.1 + 5.9 log X 0.9981 0.03 0.11 5.2
the initial stationary state (Figure 4a and 4b), or some new stationary state which is characterized by slightly different potential related to potential of initial state. Characteristic period, tp – t0, where t0 is the moment in which analyte was injected, (Figure 4), depends on perturbation intensity.10,12
Thus, the response to the vitamins B2 and B3 could be evaluated in one more manner, that is, by using the method based on the relationship between characteristic periods tp – t0 and intensity of the perturbations. After the complete analysis we concluded that this method compared to the previous one, has a comparable dynamic linear range, lower precision and a higher detection limit.
Although the chemical reaction between examined analytes and matrix system is not necessary to be known for the application of analytical procedure, some discussion about it can be done.
The perturbations of the matrix system by B1, can be explained in different manners because there are, at least, three reactions between analyte and matrix ingredients that could occur.51-53 The B
1 can be oxidized with both H2O2 and
I251 and react with iodide anion to form thiamine hydroiodide
(THI2)52 as well as a helical chain structure.53 Having in mind
that in acidic media, the protonated thiamin (TH2+) is the
electroactive species,54 the B
1 reduction through interactions
with iodide anions is crucial52 immediately after perturbation
of the BL matrix with B1. Therefore, after perturbation we see, at the beginning, the sudden decrease of iodide concentration by following equation:
TH2++2 I−→ THI
2
In addition, having in mind that potentiometric behavior of B6 is similar to the one for B1, as well as knowing that B6 can react with hydriodic acid,55 we assumed that introduced
B6 in BL matrix also irst react with iodide ion.
In order to clarify the complex mechanism of interaction between both vitamins B2 and B3, and the matrix, in
preliminary experimental examinations, we tested whether analytes reacted with the reactants of the BL matrix. Thus, potential vs. time curves were recorded by using the CSTR
and the folloving media: H2SO4, KIO3, H2O2, H2SO4 + KIO3, H2SO4 + H2O2, and KIO3 + H2O2. In the case of vitamins B2, only signiicant effect was obtained by injecting the vitamin B2 into CSTR containing sulfuric acid alone what can be ascribed to its electrochemical behavior. This suggests that B2 does not react directly with both hydrogen peroxide and iodate nor with the intermediates formed in the BL reaction. According to the obtained experimental results and knowing that reduced form of vitamin B2 (B2red) can be oxidized with O2 through a complex mechanism resulting in oxidized ribolavin (B2ox) and hydrogen peroxide,56 we conclude that
the main active specie in our system is hydrogen peroxide that is got from ribolavin peroxide. Having this in mind, as well as that in BL reaction a continuous production of oxygen occurs,57,58 we suggest that following reactions play
an crucial role in the examined system:
+ O2 +H+ → + H2O2 (1)
H2O2 + HIO → I− + O
2 + H2O + H+ (2)
Thus, the hydrogen peroxide produced by a complex (reaction 1) can react with hypoiodous acid (reaction 2) changing the ratio between iodine intermediates ([HOI]ss and [I−]
ss) that was established in the stationary state before
perturbations. The given explanation is also in accordance with the results obtained after perturbation of the Mn(II)−
BrO3−−diacetone−H
2SO4 matrix system with B2.2 Since in
this oscillatory system there is no oxygen, direct interaction between B2 and matrix is not found.
As we mentioned, the analytical igure of merit for the determination of vitamin B2 achieved in our study is worse than that reported in literature.2 Thus, the oscillating
matrix Mn(II)-BrO3−-diacetone-H
2SO4 modiied with active
oxygen (O2•−→ H
2O2)2 exhibits very high sensitivity for
vitamin B2 rather than BL matrix being in a stable non-equilibrium steady state. It is not easy to explain why and how to raise the sensitivity of analogous Belousov-Zhabotinskii oscillating reaction, since the mechanism of both matrixes, to which vitamin B2 is added, is extremely complex as well as kinetically different. There is no doubt that the H2O2 plays a very important role in both cases. Just due to the formation of H2O2 caused by UV illumination of vitamin B2 the effective concentration of the internal bromine species are change2 and the strong perturbation
can be observed. We do not know what would happen if the same procedure was applied for determination of vitamin B2 in the BL matrix. In addition, the sensitivity of matrix depends on operating phase point; the determination of vitamin B2 in the BL matrix is performed in a point where reinitiation of oscilatory state is found. It cannot be easily compared with excitability found in other cases.
In the case of vitamins B3 the above described experiments were also evaluated. A potentiometrically recordable response to B3 injections was observed in the mixture of KIO3 + H2O2, in H2O2 alone as well as in the mixture H2SO4 + KIO3, known as Dushman reaction.59 According
to the obtained experimental results and assuming that, B3 similarly to nicotinamide nucleotides can be oxidized by hypoiodous acid under acidic conditions through a mechanism dominated by the kinetics of the halogenation of pyridine,60,61 we suggest that B
3 oxidation through
interactions with hypoiodous acid denote the irst step after perturbation. Consequently, the ratio between iodine intermediates ([HOI]ss and [I−]
ss), established in the stationary
state before perturbations is altered resulting in sudden increase of iodide concentration determined by very fast iodine hydrolysis.
Py + IOH2+→ Py/I+ +H 2O
I2 +H2O HIO + I− +H+
where Py and Py/I, denotes pyridine unit of nicotinamide and iodinated Py unit, respectively.60
Effect of foreign species
An interference study was carried out with aim to determine vitamin B1 in real samples (pharmaceutical formulations). Thus, a systematic study of the effects of
potentially interfering foreign species frequently existing with thiamine in pharmaceuticals, on the monitoring of these vitamins was undertaken. This study was carried out through measuring the response of vitamin B1 alone and in the presence of some typical active principles, such as other vitamins B group, folic acid, ascorbic acid as well as some typical excipients (starch, glucose, sucrose and talc). In addition, the potential interference of metal cations commonly presented in several drugs, such as Cu(II), Mn(II), Mg(II), Zn(II) and Fe(III) was evaluated. The analytical signal of solutions containing a ixed amount of 6.0 × 10⁻³ mol L−1 B
1 was compared with the analytical
signal of these solutions spiked with different known concentrations of possible interfering agents. The tolerance limit was taken as ± 5% change in analytical signal. The
species examined were found to interfere above tolerable ratios (TR) that are deined as number of micromoles of the interferent to the number of micromoles examined analyte.
The mentioned excipients under experimental conditions do not react with matrix system nor with to examined vitamins and no potential shifts were obtained when they were injected in matrix for concentrations of excipients a twenty-times higher than those of thiamine or niacin.
For vitamin B1 determination, the following species, when present in amounts for which tolerable ration (TR) is shown in brackets, do not interfere: B2 [20], B12[15],
B6 [12], Ca2+ [5], nicotinamide [5], K+ [4], Cl− [4],
citric acid [4], Zn2+[3], B
3[3], ascorbic acid [3], HIO3[1.5],
Na+[1.5], Cu2+[1], Fe3+[1], Mn2+[0.7], Mg2+[0.7], I−[0.6],
uric acid [0.3], carbamide [0.3], Br−[0.2], and folic acid [0.1].
Some other possible interference of retinol palmitate (vitamin A) and tocopherol acetate (vitamin E) can not affect because of their insolubility in aqueous solutions.
We would like to note strong interference of folic acid, as well as Mn2+, Mg2+ and Fe3+ ions that can be components
of some mineral preparations, which all make the proposed method less convenient for quantitative determination of the examined vitamins in this kind of sample.
Analysis of active components (thiamine and niacin) in pharmaceutical dosage forms
a normal dose of B1 (12.3 mg per serving), as well as to
the sample with a massive dose (500 mg per serving) of
niacin (Table 2).The amounts of both thiamine and niacin obtained by the proposed method are in good agreement with those claimed by the manufactures (average RSD in the range 1.4-5.3%, Table 2). In order to study the reliability and suitability of the proposed method, the additional recovery experiments were carried out with the examined pharmaceuticals from those listed in Table 2. In the cases of thiamine determination (sample 1 and 2) as well as niacin determination (sample 3), the standard addition methods were performed by accurate additions of 0.05 µmol and
0.16 µmol of B1 (sample 1 and 2), as well as 20 µmol of
B3 (sample 3) in the dilute samples. The Table 2 shows the results obtained; it can be seen that the average recovery varies from 100.7 to 103.2% indicating that the developed method was free from interference, and provided accurate results. In addition, the contents of B1 and B3 in vitamin B1,B complex and B3 tablets were determined by using the methods of titrimetry in Yugoslav Pharmacopoeia.62
The obtained results are given in Table 2. It is shown that the results obtained by the proposed method agree with those obtained by the pharmacopoeia method; it is a useful method for quantitative analysis of B1 and B3 in pharmaceutical formulations.
In addition, the method employing the characteristic period tp – t0 for determination of vitamin B3 was used to analyze this compound in sample 3. This method tested did not provide acceptable results. The method employing maximal potential displacement was the more appropriate, probably as a results of the pharmaceutical containing some excipient that might interact briely with the matrix, in such a way that its effect was obvious in the time for which the matrix reverts to the initial stationary state, but not in the potential displacement.
Conclusions
Our results demonstrate suitability of the use of the oscillatory reaction matrix in a stable non-equilibrium stationary state near a bifurcation point, for the determination of some water-soluble vitamins (B1, B2, B3 and B6) in bulk drug, as well as thiamin and niacin in pharmaceuticals. The developed kinetic method is simple and cheap; it operates without any derivatization reaction and shows good analytical features. The results are accurate and precise, and there are advantages in terms of short time required for each assay. For vitamin B1 determination, the main limitation of the proposed method is a strong interference with folic acid having concentration larger than 6 × 10⁻⁴ mol L−1, as well as ions (Mn2+, Mg2+
and Fe3+) that can be components of some mineral
preparations if their concentration exceed approximately 6 × 10⁻³ mol L−1. Therefore, it may be applicable for
vitamin B1 determination in pharmaceuticals that contain sufficiently low concentrations of these substances, as it is in our case. On the other hand, for vitamin B3 determination, only samples with relatively high dose of this vitamin may be analyzed by the proposed method. Anyway, it is demonstrated that the proposed method is very appropriate for routine analysis of pharmaceuticals, without any pretreatment of the samples, apart from its dissolution, and the proposed method could also be used for their quality control.
Acknowledgments
The present investigations were partially supported by The Ministry of Sciences and Environmental Protection of Serbia, under Project 142025.
Table 2. Determination of both thiamine and niacin in the commercial vitamin B1 and B3 tablets as well as thiamine in vitamin B complex (B1, B6 and
B12) tablets
Samplea Claimed/ mg
Concentration found/ (meanb ± S.D.c)
R.S.D.d/ (%)
RCVe/ (%)
Concentration found by reference methodf/
(mean ± R.S.D.) B1
1 100 100.7 ± 5.3 5.3 100.7 97.0 ± 3.2
2 12.3 12.7 ± 0.6 4.8 103.2 12.1 ± 4.0
B3
3 500 500.9 ± 7.0 1.4 101.9 498.0 ± 2.1
aSamples 1 and 3 of Vitamin B tablets were produced by Now Foods, Blodmingdale, USA as well as sample 2 of vitamin B complex tablet was produced by Srbolek, Belgrade, Serbia. Samples containing: thiamine and excipients (sample 1); thiamin (12.3 mg), pyridoxine (5 mg), B12 (0.05 mg), folic acid (0.4 mg), nicotinamide (20 mg) and excipients (sample 2); niacin (500 mg) and excipients (sample 3); bMean concentration (in mg) of six determination; cAverage standard deviation; dAverage relative standard deviation; ePerformed as accurate addition of 0.05 and 0.16 µmol of B
References
1. Jiménez-Prieto, R.; Silva, M.; Pérez-Bendito, D.; Talanta1997,
44, 1463.
2. Ke, Y; Wanhong, M.; Ruxiu, C.; Yhixin, L.; Nanqin, G.; Anal. Chim. Acta2000, 413, 115.
3. Jiménez-Prieto, R.; Silva, M.; Pérez-Bendito, D.; Analyst1997,
122, 287.
4. Gan, N.; Cai, R.; Lin, Z.; Anal. Chim. Acta2002, 466, 257. 5. Gao, Z.; Ren, J.; Yang, W.; Liu, H.; Jang, H.; J. Pharm. Biomed.
Anal. 2003, 32, 393.
6. Wang, J.; Yang, S. T.; Cai, R. X.; Lin, Z. X.; Liu, Z. H.; Talanta 2005, 65, 799.
7. Vukojević, V; Pejić, N.; Stanisavljev, D.; Anić, S.; Kolar-Anić, Lj.; Analyst1999, 124, 147.
8. Pejić, N.; Anić, S.; Kuntić, V.; Vukojević, V.; Kolar-Anić, Lj.;
Microchim. Acta2003, 143, 261.
9. Pejić, N.; Blagojević, S.; Anić, S.; Vukojević, V.; Kolar-Anić, lj.; Anal. Bioanal. Chem. 2005, 381, 775.
10. Pejić, N.; Kolar-Anić, Lj.; Anić, S.; Stanisavljev, D.; J. Pharm. Biomed. Anal. 2006, 41, 610.
11. Pejić, N.; Blagojević, S.; Anić, S.; Vukojević, V.; Mijatović, M.;
Ćirić, J.; Marković, Z.; Marković, S.; Kolar-Anić, Lj.; Anal. Chim. Acta2007, 582, 367.
12. Pejić, N; Blagojević, S.; Vukelić, J.; Kolar-Anić, Lj.; Anić, S.;
Bull. Chem. Soc. Jpn. 2007, 80, 1942.
13. Pejić, N.;. Blagojević, S.; Anić, S.; Kolar−Anić, Lj.; Anal. Bioanal. Chem. 2007, 389, 2009.
14. Gao, J.; Zhao, G.; Zhang, Z.; Zhao, J.; Yang, W.; Microchim. Acta2007, 157, 35.
15. Jimenez-Prieto, R.; Silva, M.; Perez-Bendito, D.; Analyst1998,
23, 1R.
16. Gao, J.; Pakistan J. Biol. Sci.2005, 8, 512.
17. Gao, J.; Chen, H.; Dai, H.; Lv, D.; Ren, J.; Wang, L.; Yang, W.;
Anal. Chim. Acta2006, 571, 150.
18. Gao, J.; Wang, L.; Yang, W.; Yang, F.; J. Braz. Chem. Soc. 2006, 17, 458.
19. Hu, G.; Chen, P.; Wang, W.; Hu, L.; Song, J:; Qiu, L.; Song, J.;
Electrochim. Acta2007, 52, 7996.
20. Gao, J.; Ren, J.; Yang, W.; Liu, X.; Zang, H.; Li, Q.; Deng, H.;
J. Electoanal. Chem.2002, 520, 157.
21. Jiménez-Prieto, R.; Silva, M.; Pérez-Bendito, D.; Anal. Chem. 1995, 67, 729.
22. Strizhak, P. E.; Didenko, O. Z.; Ivashchenko, T. S.; Anal. Chim. Acta2001, 428, 15.
23. Gray, P.; Scott, S. In Chemical Oscillations and Instabilities: Nonlinear Chemical Kinetics, Oxford University Press: Oxford, 1990.
24. Vukojević, V.; Anić, S.; Kolar-Anić, Lj.; J. Phys. Chem. 2000,
104, 10731.
25. Chopin-Dumas, J.; C. R.Acad. Sc. Paris C1978, 287, 553.
26. Milošević, M; Pejić, N.; Čupić, Ž.; Anić, S.; Kolar-Anić, Lj.;
Materials Science Forum2005, 494, 369.
27. Bray, W. C.; J. Am. Chem. Soc. 1921, 43, 1262.
28. Bray, W. C.; Liebhafsky, H.A.; J. Am. Chem. Soc. 1931, 53, 38.
29. Markopoulou, C. K.; Kagkadis, K. A.; Koundourellis, J. E.;
J. Pharm. Biomed. Anal.2002, 30, 1403.
30. Teixeira, M. F. S.; Segnini, A.; Moraes, F. C.; Marcolino-Júnior, L. H.; Fatibello-Filho, O.; Cavalheiro, E. T. G.; J. Braz. Chem. Soc. 2003, 14, 316.
31. Feng, F.; Wang, K.; Chen, Z.; Chen, Q.; Lin, J.; Huang, S.; Anal. Chim. Acta2004, 527, 187.
32. Portela, J. G.; Costa, A. C. S.; Teixeira, L. S. G.; J. Pharm. Biomed. Anal. 2004, 34, 543.
33. Ivanović, D.; Popović, A.; Radulović, D.; Medenica, M.;
J. Pharm. Biomed. Anal.1999, 18, 999.
34. Zhang, C.; Zhou, G.; Zhang, Z.; Aizawa, M.; Anal. Chim. Acta 1999, 394, 165.
35. Schmitz, G.; J. Chim. Phys.1987, 84, 957.
36. Kolar-Anić, Lj.; Schmitz, G.; J. Chem. Soc., Faraday Trans.
1992, 88, 2343.
37. Kolar-Anić, Lj.; Čupić, Ž.; Anić, S.; Schmitz, G.; J. Chem. Soc., Faraday Trans. 1997, 93, 2147.
38. Schmitz, G.; Phys. Chem. Chem. Phys. 2000, 2, 4041. 39. Anić, S.; Kolar-Anić, Lj.; J. Chem. Soc., Faraday Trans. I1988,
84, 3413.
40. Anić, S.; Kolar-Anić, Lj.; Stanisavljev, D.; Begović, N.; Mitić, D.; React. Kinet. Catal. Lett. 1991, 43, 155.
41. Kolar-Anić, Lj.; Mišljenović, Đ.; Anić, S.; Nicolis, G.; React. Kinet. Catal.Lett. 1995, 54, 35.
42. Field, R. J.; Burger, M., eds.; Oscillations and Traveling Waves in Chemical System, Wiley: New York, 1985.
43. Edelson, D.; Noyes, R.; J. Phys. Chem. 1979, 83, 212.
44. Ševćík, P.; Adamćíková, Lj.; Chem. Phys. Lett. 1997, 267, 307. 45. Anić, S.; Kolar-Anić, Lj.; Ber. Bunsenges. Phys. Chem. 1987,
90, 1084.
46. Treindl, L.; Noyes, R.; J. Phys. Chem.1993, 97, 11354.
47. Kolar-Anić, Lj.; Vukojević, V.; Pejić, N.; Grozdić, T.; Anić S. In
Experimental Chaos; Boccaletti, S.; Gluckman, B. J.; Kurths, J.;
Pecora, L.; Meucci, R.; Yordanov, Q., eds.; American Institute of Physics, AIP Conference Proceedings: Melville, New York, 2004.
48. Pejić, N.; Maksimović, J.; Ribić, D.; Kolar-Anić, Lj.; Russ. J. Phys. Chem. 2009, 83, 1490.
49. International Conference on Harmonization (ICH); ICH Harmonized Tripartite Guideline Validation of Analytical
Procedures: Text and Methodologies, Q2(R1), 2005.
50. Bevington, P. R.; Robinson, D. K.; Data Reduction and Error Analysis for The Physical Sciences, 3rd ed., McGraw-Hill: New
York, 2003.
51. Holman, W.; Biochem. J.1944, 38, 388.
53. Aoki, K.; Hu, N.; Tokuno, T.; Adeyemo, A.; Williams, G.; Inorg. Chim. Acta1999, 290, 145.
54. Sutton, J.; Shabangi, M.; J. Electroanal. Chem. 2004, 571, 283. 55. Mc Casland, G.; Gottwald, L.; Furst, A.; J. Org. Chem. 1961,
26, 3541.
56. Massey, V.; Biochem. Soc. Trans. 2000, 28, 283.
57. Kissimonova, K.; Valent, I.; Adamičikova, L.; Ševčik, P.; Chem. Phys. Lett. 2001, 341, 345.
58. Schmitz, G.; Phys. Chem. Chem. Phys. 1999, 1, 4605. 59. Dushman, S.; J. Phys. Chem. 1904, 8, 453.
60. Prüz, W.; Kissner, R.; Koppenol, W.; Rüegger, H.; Arch. Biochem. Biophys. 2000, 380, 181.
61. Ingold, C. In Structure and Mechanism in Organic Chemistry; Cornell University Press: London, 1953.
62. Jugoslovenska Farmakopeja; Ph. Jug. V, Federal Health Protection Institute: Belgrade, 2000.
Submitted: July 7, 2009

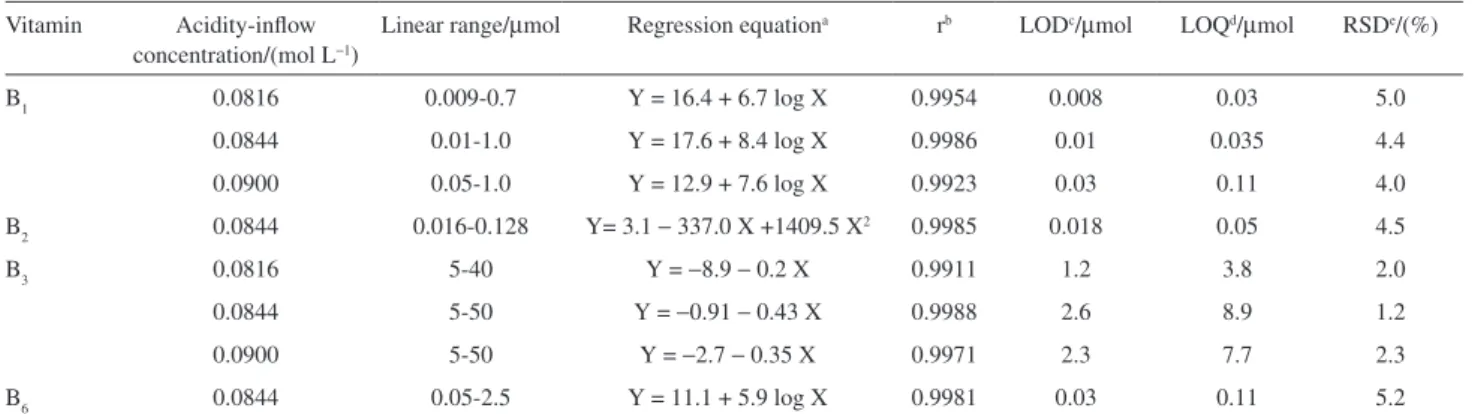
![Figure 4. The typical period, t p − t 0 in the system (a) BL−B 2 and (b) BL−B 3 observed when inlow concentration of sulfuric acid was [H 2 SO 4 ] = 8.44 × 10 −2 mol L −1 ; the moment in which analyte was injected is denoted by t 0](https://thumb-eu.123doks.com/thumbv2/123dok_br/18995737.462134/7.892.455.797.479.643/figure-typical-observed-concentration-sulfuric-analyte-injected-denoted.webp)

