Article
J. Braz. Chem. Soc., Vol. 22, No. 2, 239-247, 2011. Printed in Brazil - ©2011 Sociedade Brasileira de Química
0103 - 5053 $6.00+0.00
A
*e-mail: [email protected]
Voltammetry of Irbesartan Drug in Pharmaceutical Formulations and Human
Blood: Quantiication and Pharmacokinetic Studies
Hanaa S. El-Desoky,* Mohamed M. Ghoneim and Allia. D. Habazy
Analytical & Electrochemistry Research Unit, Chemistry Department, Faculty of Science, Tanta University, 31527 Tanta, Egypt
Voltamogramas cíclicos de ‘irbesatan’ em um eletrodo de gota pendente de mercúrio no tampão Britton-Robinson com valores de pH menores do que 4,5 exibiram um único pico catódico irreversível envolvendo dois elétrons, correspondendo à redução-saturação da ligação dupla C=N de sua unidade tetrazólia. Na faixa de pH 4,5-5,5, os voltamogramas exibiram dois picos catódicos irreversíveis (1º e 2º picos) com corrente de pico menor porém com alturas relativas iguais, as quais foram atribuídas à redução do grupo C=N das formas ácida e básica de ‘irbesatan’, respectivamente. Um método voltamétrico de onda quadrada com redissolução anódica adsortiva foi desenvolvido para a quantiicação de ibsertan total em solução. O método desenvolvido foi aplicado com sucesso na quantiicação de ‘ibsertan’ em formulações farmacêuticas e soro humano enriquecido sem a necessidade de pré-tratamento de amostras e/ou etapas lentas de extração antes da análise. Foram obtidas interferências insigniicantes de seu ingrediente ativo “hidroclorotiazida”, excipientes, íons metálicos comuns e drogas co-administradas. Limites de detecção de 9,0x10⁻¹⁰ e 2,1x10⁻⁹ mol L-1
e limites de quantiicação de 3,0x10⁻⁹ e 7,0x10⁻⁹ mol L-1 de ‘irbesartan’ total em padrão e em soro
humano enriquecido foram alcançadas, respectivamente, pelo método voltamétrico desenvolvido. Além disto, parâmetros fármacocinéticos de ‘irbesartan’ em plasma de voluntários saudáveis obtidos após a administração oral de uma única dose de tabletes Aprovel® também foram estimados.
Cyclic voltammograms of irbesartan at the hanging mercury dropping electrode in the Britton-Robinson buffer of pH values lower than 4.5 exhibited a single 2-electron irreversible cathodic peak corresponding to the reduction-saturation of the C=N double bond of its tetrazolyl moiety. Over the pH range 4.5-5.5, the voltammograms exhibited two irreversible cathodic peaks (1st and
2nd peaks) of lower peak current but of relatively equal heights which were attributed to reduction
of the C=N group of the acidic and basic forms of irbesartan, respectively. A validated square-wave adsorptive cathodic stripping voltammetric method was developed for quantiication of irbesartan in the bulk form. The developed stripping voltammetric method was successfully applied for quantitation of irbesartan in pharmaceutical formulations and spiked human serum, without the necessity for samples pretreatment and/or time-consuming extraction steps prior to the analysis. Insigniicant interferences from its active ingredient “hydrochlorothiazide”, excipients, common metal ions and co-administrated drugs were obtained during the analysis. Limits of detection of 9.0x10⁻¹⁰ and 2.1x10⁻⁹ mol L-1 and limits of quantitation of 3.0x10⁻⁹ and 7.0x10⁻⁹ mol L-1 irbesartan
in the bulk form and in spiked human serum were achieved, respectively, by the developed stripping voltammetric method. Moreover, pharmacokinetic parameters of irbesartan in plasma of healthy volunteers following an oral administration of a single dose of Aprovel® tablets were also estimated.
Keywords: irbesartan, tablets, human blood, stripping voltammetry, pharmacokinetics
Introduction
Irbesartan, (Scheme 1), 2-butyl-3-[2-(1H-tetrazole-5-yl) (1,1-biphenyl)-4-yl]methyl]-1,3-diazaspiro[4,4]non-1-en-4-one, is the irst member of a chemical class of a non-peptide
angiotensin II receptor antagonists (ARAII). Irbesartan and other ARAII receptor antagonists are used for the treatment
of hypertension, diabetic nephropathy and heart failure.1
Irbesartan is metabolized mainly by glucuronidation
(primarily on thetetrazole ring), hydroxylation, and additional
oxidation to the inactive irbesartan glucuronide conjugate
150 mg single dose of irbesartan, peak plasma concentration
of irbesartan (1.5 ± 0.29 µg mL-1) in human blood are attained
at 1.5-2 h after dosing. The terminal elimination half-life of
irbesartan averaged 11-15 h.1-3
Many analytical methods were reported in the literature for determination of irbesartan in pharmaceutical formulations or in biological luids. These include high performance
liquid chromatography (HPLC),4-10 high-performance
thin-layer chromatography (HPTLC),11 liquid
chromatography-mass spectrometry (LC-MS),12 spectrophotometry,13-18
capillary electrophoresis19 and voltammetry.20,21 Almost all
the reported methods have some drawbacks, lack in some validation parameters and necessitate time-consuming liquid-liquid extraction steps prior to the analysis. On the other hand, in most of the reported HPLC methods for routine clinical analysis, a high-throughput analysis with expensive
solid-phase extraction8-11 is always not advantageous as
such equipment and techniques are not available in most of the laboratories. Moreover, the two reported voltammetric
methods20,21 did not offer a suficient sensitive quantiication
limit of irbesartan especially in pharmacokinetic studies.
The irst method20 has been described for determination of
irbesartan in formulation using differential-pulse and square-wave voltammetric techniques at hanging mercury dropping electrode (HMDE) and in spiked human serum using
square-wave voltammetric technique (LOD = 6.14×10⁻⁶ mol L-1
(2.63 µg mL-1)) but not in real plasma samples. Whereas,
the second method21 has been described for determination
of irbesartan in bulk form and formulation at the HMDE using DC, differential pulse, square wave, and first harmonic alternating current voltammetry. Quantitation limits of 1.33×10⁻⁶ mol L-1 (0.57 µg mL-1), 1.70×10⁻⁶ mol L-1
(0.73 µg mL-1), 1.24×10⁻⁶ mol L-1 (0.53 µg mL-1) and
8.63×10⁻⁷ mol L-1 (0.37 µg mL-1) irbesartan in bulk form
were achieved, respectively. Because of the typical plasma concentrations reported in literature for healthy volunteers following administration of a single oral dose
of 150 mg irbesartan were in the range (0.047 ± 0.025 to
1.502 ± 0.29 µg mL-1)3 the reported voltammetric methods
are considered not eficient enough for the assay of irbesartan
at different therapeutic dose levels for pharmacokinetic studies as well as therapeutic drug monitoring. Besides, the electrochemical behavior of irbesartan studied on the mercury electrode by means of the two reported voltammetric
methods20,21 still required more clariication. Pharmacokinetic
parameters of irbesartan in human blood have also never been determined by any voltammetry method.
The aim of the present work was to develop a much sensitive square-wave adsorptive cathodic stripping voltammetric method for quantification of irbesartan in pharmaceutical formulations (in the absence and presence of the co-formulated drug ‘hydrochlorothiazide’) and human blood. Determination of pharmacokinetic parameters of irbesartan in human blood by means of the developed stripping voltammetric method was also a main aim of the present study. Besides, the electroreduction mechanism of irbesartan at the mercury electrode and
determination of its pka were also demonstrated.
Experimental
Materials
Bulk irbesartan and its pharmaceutical products
namely “Aprovel tablets” that claimed to contain 150 mg
irbesartan per tablet (Sanoi Pharma, Bristol-Myers Squibb
SNC, Paris, France) and “Co-Aprovel tablets” containing
300 mg irbesartan and 12.5 mg hydrochlorothiazide per
tablet (Sanoi Pharma Bristol-Myers Squibb SNC, Paris, France), were investigated in the present work.
Solutions
Bulk irbesartan solutions
A standard stock solution (1.0x10⁻³ mol L-1) of bulk
irbesartan was prepared in methanol (Merck). Desired
working solutions (1.0×10⁻⁸-1.0×10⁻⁴ mol L-1) were
prepared by appropriate dilutions with methanol.
Tablet solutions
Ten Aprovel tablets (150 mg irbesartan per tablet) and
ten Co-Aprovel tablets (a binary mixture labeled to contain
300 mg irbesartan and 12.5 mg hydrochlorothiazide per
tablet) were weighed separately and the average mass per
tablet was determined, and then grounded to ine powders. A weighed portion of each of the homogeneous powders
equivalent to 1.0×10⁻³ mol L-1 irbesartan was accurately
transferred into 100 mL volume calibrated lask containing 70 mL methanol (Merck). The content of each lask was sonicated for about 10 min and then illed up with methanol. Each of the prepared solutions was then iltered through
0.45 µm Milli-pore ilter (Gelman, Germany). Convenient concentrations of irbesartan were then obtained by accurate dilution of the obtained solutions with methanol.
Spiked serum solutions
Serum samples of two healthy volunteers were mixed and then stored at −20 ºC until analysis. Into each of 10 centrifugation tubes (3 mL polypropylene microcentrifuge tubes) containing a certain concentration of irbesartan, 100 µL volume of the human serum was transferred, then mixed well with 1 mL of methanol to denature and precipitate of proteins. The solutions were centrifuged using an Eppendorf centrifuge (Hamburg, Germany) for 3 min at 14000 rpm to separate out the precipitated proteins. The clear supernatant layers of these solutions were iltered through 0.45 µm Milli-pore ilters to produce protein-free human serum samples spiked with various concentrations
of irbesartan (1.0×10⁻⁸-1.0×10⁻⁴ mol L-1).
Supporting electrolytes
A series of the Britton-Robinson (B-R) universal buffer
of pH 2-11 and acetate buffer of pH 3.8-6.3were prepared
in de-ionized water and used as supporting electrolytes. All the chemicals used were of analytical-reagent grade quality. A pH-meter (Crison, Barcelona, Spain) was used for the pH measurements.
Pharmacokinetic studies
Two healthy male volunteers (45-50 years old) took part in this study. Both were healthy, since they had normal heart, liver and kidney functions. Subjects were caffeine and alcohol free for at least 12 h before the administration of the drug. The two volunteers gave their written informed consent prior to anticipating in the study (at Ramadan
SpecializedHospital, Tanta City, Egypt). Each subject
received a single 150 mg oral dose of irbesartan (Aprovel®
tablet) in the morning, after an overnight fast. Blood samples (100 µL each) were obtained at 0 (pre-dose), 0.5, 1, 1.5, 2, 3, 4, 8, 12 and 24 h after the oral administration. The blood samples were centrifuged immediately at 3000 rpm for 15 min and then the plasma fractions were rapidly separated and stored in coded polypropylene tubes at
−20 °C until the assay. Following separation of proteins by
methanol and then separation by centrifugation, the plasma samples were analyzed using the developed SW-AdCSV.
Apparatus
Computer-controlled Potentiostats Models 263A
and 394-PAR (Princeton Applied Research, Oak Ridge,
USA) with the software 270/250-PAR were used for
the voltammetric measurements. An electrode assembly (303A-PAR) incorporated with a micro-electrolysis cell and a three-electrode coniguration system comprising of a
HMDE as a working electrode (area of HMDE = 0.026 cm2),
an Ag/AgCl/KCls reference electrode and a platinum wire
auxiliary electrode, was used.
Procedure
A known volume of the analyte solution was pipetted into 10 mL volume calibrated lask and then illed up with the supporting electrolyte of the selected pH value. This solution was introduced quantitatively into the electrolysis cell, and then deoxygenated with pure nitrogen gas for about 5 min in the irst cycle and for 30 s in each successive cycle, while a stream of nitrogen gas was kept over the solution during the measurements. In stripping voltammetric analysis, preconcentration of irbesartan onto the surface of HMDE was performed by adsorptive accumulation at
–0.3 V (vs. Ag/AgCl/KCls) for 110 s while stirring the
solution at 400 rpm. After equilibrium time of 5 s allowed for the solution to become quiescent, the voltammograms
were recordedbyscanning the potential towards negative
direction using square-wave potential waveform.
Results and Discussion
Electroreduction of irbesartan
Cyclic voltammograms of 1.0×10⁻⁴ mol L-1 irbesartan
solution in the B-R universal buffers of pH values lower than 4.5 exhibited a single 2-electron irreversible cathodic peak. As the pH of the medium has increased, the peak current has sharply decreased, Figure 1. In buffers of pH values 4.5-5.5, this peak splits into two peaks (1st and 2nd splitting peaks) with
lower current but of relatively equal heights. At pH values
higher than 5.5 the 2nd splitting peak disappeared completely
and the voltammograms exhibited again a single irreversible cathodic peak. Irbesartan molecule possesses imidazole and tetrazolyl groups; the imidazole group is known to be electro-inactive at the mercury electrode in aqueous media; however it is reducible at a platinum electrode in
non-aqueous media.22 On the other hand, the N=N group in
most organic compounds is known to be reduced much easier
than C=N one.23-25 So, considering the reduction potentials of
irbesartan over the entire pH range, the reduction behavior of irbesartan on HMDE may be attributed to saturation of the azomethine group C=N in tetrazolyl moiety of irbesartan
molecule26 not to the N=N group which is in contradictory
Plot of the peak current of the single cathodic peak (pH
values lower than 4.5) and the 1st splitting one (pH 4.5-8)
versus pH recalls a dissociation curve (Z-shaped curve), Figure 2, which may be due to the presence of irbesartan
species in an acid (AH)-base (A–) equilibrium.27 Also
angiotensin II receptor antagonist compounds have
acid-base and tautomerism properties27,28 due to the tetrazole
functional groups (pKa of tetrazole = 4.89).29 The pH value
corresponding to the half-height of the plot of ipversus pH
(Figure 2) or to the peak of δip/δpH versus pHplot (Figure 2,
inset) equals the pKa of irbesartan (pH = pKa = 4.7). This
value agrees well with those reported in the literature for pKa
of irbesartan (4.5-4.7 ± 0.06)7,27 and different angiotensin II
receptor antagonists (4.0 ± 0.9)27 which is attributed to the
deprotonation of the tetrazolyl group.
On the other hand, on the increase of pH of the medium the peak potential of the single peak (pH values lower than 4.5) shifts towards more negative values. This behavior conirmed the involvement of protons in the electrode reaction in solutions of pH values lower than 4.5 and that the proton-transfer reaction precedes the electron transfer
process.30 Whereas, the peak potentials of 1st and 2nd
splitting peaks are pH-independent. A rectilinear plot of the
peak potentialEpversus pH for the single peak (pH values
lower than 4.5) was obtained; its corresponding regression
equation was: Ep(V) = 0.053 pH + 1.15 (r = 0.997 and n = 6).
The irreversible nature of the reduction process of irbesartan was conirmed by the shift of the peak potential
(Ep) of its single cathodic peak (pH values lower than 4.5)
to more negative values with the increase of scan rate (25
to 500 mV s-1).31,32 Plot of peak potential (E
p) of the single
cathodic peak in solution of pH 2.1 versus logarithm of scan
rate (v) was linear; its corresponding regression equation
was: Ep(V) = 0.027 log v + 0.32 (r = 0.999 and n = 5).
According to Nicholson and Greef31,32 values of αn
a of 1.10
and α of 0.55 (for na = 2) were estimated from slope value
of the obtained Ep versus log v plot (59/2αna = 27 mV),
conirming the irreversible nature of the electrode process of irbesartan at the HMDE.
According to the foregoing results the electro-reduction of the C=N center of irbesartan molecule on the mercury electrode in solutions of pH values lower than 4.5 (reaction i) and at pH values of 4.5 and higher (reactions ii and iii) can be expressed as illustrated in Scheme 2.
In solutions of pH values 4.5 and higher irbesartan molecule was found to be in an acid-base equilibrium
(pKa = 4.7). Both the acidic (AH) and basic (A–) forms are
electro-active. Thus, the electrode reaction of irbesartan over the pH range 4.5 and higher takes place via two steps
attributed to reduction of both the acidic form (1st splitting
peak) and basic one (2nd splitting peak). However, the 2nd
peak disappeared at pH higher than 5.5 which may be due to the intense electron density of its tetrazole ring; its reduction peak is dificult to appear in the accessible potential range.
Adsorptive behavior of irbesartan
Cyclic voltammogram of 1.0×10⁻⁶ mol L-1 irbesartan at
100 mV s-1 in the B-R universal buffer of pH 4 and in the
acetate buffer of pH 4 recorded following its preconcentration onto the HMDE by adsorptive accumulation under open
Figure 1. Cyclic voltammograms of 1.0×10⁻⁴ mol L-1 irbesartan in the B-R universal buffer of different pH values containing 10% (v/v) methanol; scan rate = 200 mV s-1.
circuit conditions (e.g., Figure 3, curve a) exhibited a low peak current magnitude. On recording the cyclic voltammogram of the same solution following preconcentration of irbesartan onto the HMDE by adsorptive accumulation at −0.3 V (versus Ag/AgCl/KCls) for 30 s (Figure 3, 1st cycle b and
2nd cycle c) the peak current magnitude (i
p) was enhanced
in the 1st cycle (Figure 3, curve b) indicating its adsorption
onto surface of the HMDE.
On the other side, the peak current magnitude increased
linearly upon the increase of scan rate ν (25 to 500 mV s-1).
Linear plots of log ipversus log ν were obtained with slope
values of 0.80 and 0.95 in the B-R universal and acetate buffers of pH 4, respectively. The latter is very close to the expected theoretical value (1.0) for an ideal reaction
of surface species.33
The electrode surface coverage (Γo mol cm-2) in the
acetate buffer of pH 4 was calculated using the equation
Γo = Q/nFA, where Q is the charge consumed by the
surface process as estimated by the integration of the area under peak of cyclic voltammogram, n is the number of electrons consumed in the reduction process (n = 2), F is the Faraday’s constant (96,487 C) and A is the electrode
surface area (0.026 cm2). On dividing the number of
coulombs transferred, 0.7966 µC, by the conversion factor
nFA (5017.324×106 µC), a monolayer surface coverage
of 1.59×10⁻¹⁰ mol cm-2 was estimated. Each adsorbed
irbesartan molecule therefore occupied an area of 1.04 nm2.
Quantiication studies
Optimization of SW-AdCS voltammetric method
Based on the adsorption behavior of irbesartan onto the mercury electrode surface, square-wave adsorptive cathodic stripping voltammetry (SW-AdCSV) method was optimized for its trace quantitation in the bulk form. SW-AdCS voltammograms of bulk irbesartan in the B-R universal buffer (pH 2 to 7) and in acetate buffer (pH 3.8 to 6.3) recorded
Scheme 2. Electrode reaction of irbesartanat the HMDE.
following its preconcentration onto the HMDE by adsorptive accumulation for 30 s at −0.4 V exhibited a well-deined single irreversible cathodic peak. A better enhanced peak current magnitude was achieved in the acetate buffer of pH 4. Therefore, acetate buffer of pH 4 was chosen as a supporting electrolyte for the rest of the analytical study.
Effect of preconcentration potential (Eacc.) of 0.0 to –1.0 V
(versus Ag/AgCl /KCls) on the SW-AdCSV peak current
magnitude of 1.0×10⁻⁷ mol L-1 irbesartan was examined in
the acetate buffer of pH 4 following its preconcentration onto the HMDE by adsorptive accumulation for 30 s. At a preconcentration potential of –0.3 V a better enhanced peak current magnitude was achieved; therefore it was chosen for further studies. Inluence of the pulse parameters
namely: frequency f (10 to 120 Hz), scan increment ∆Es
(2 to 12 mV) and pulse-amplitude a (10 to 100 mV) on the
SW-AdCSV peak current magnitude of 1.0×10⁻⁷ mol L-1
irbesartan in the acetate buffer of pH 4 recorded following preconcentration by adsorptive accumulation onto the
HMDE at Eacc. = –0.3 V for 30 s was examined. A better
developed and symmetrical voltammetric peak was obtained
at the following pulse parameters: f = 120 Hz, ∆Es = 12 mV
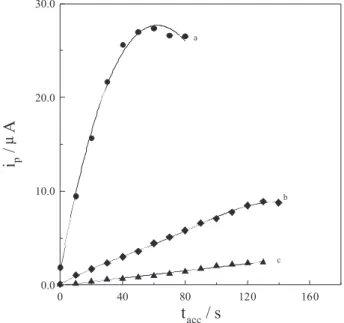
and, a = 25 mV. Also effect of varying the preconcentration
time (tacc.) on the voltammetric peak current magnitude
of various concentrations of bulk irbesartan (1.0×10⁻⁶,
1.0×10⁻⁷ and 1.0×10⁻⁸ mol L-1) in the acetate buffer of pH 4
was evaluated. As shown in Figure (4), for 1.0×10⁻⁶ and
1.0×10⁻⁷ mol L-1 bulk irbesartan, theresponse was linear up
to 40 and 110 s, respectively, and then leveled off. While
for 1.0×10⁻⁸ mol L-1 irbesartan, as the accumulation time
was increased, linearity was prevailed over all the tested accumulation time. The inluence of the rest time was also considered and a time period of 5 s was chosen. On the other hand, the square-wave signal was found to increase
as the area of the HMDE was increased (0.01 to 0.026 cm2);
therefore, the present study was carried out at a HMDE
area of 0.026 cm2. The results revealed that the optimal
conditions of the developed SW-AdCSV method which generated a well-shaped and a better enhanced peak current
magnitude were: Eacc = –0.3 V, tacc.≤ 110 s (depending on the
sensitivity required), f = 120 Hz, ∆Es = 12 mV, a = 25 mV
and the acetate buffer of pH 4 as a supporting electrolyte. Using the developed SW-AdCSV method for assay of standard solutions of various concentrations of irbesartan, a linear calibration curve was obtained over
the concentration range of 3.0×10⁻⁹ to 5.0×10⁻⁷ mol L-1
irbesartan; the corresponding regression equation was:
ip(µA) = 66.58 C (µmol L-1) + 1.76 (r = 0.991 and n = 6).
Limits of detection (LOD) and quantitation (LOQ) of 9×10⁻¹⁰ mol L-1 (3.86×10⁻⁴ µg mL-1)and 3×10⁻⁹ mol L-1
(1.28×10⁻³ µg mL-1) of bulk irbesartan, respectively, were
estimated using the expression: k SD / b,34 where k = 3 for
LOD and 10 for LOQ, SD is the standard deviation of the blank and b is the slope of the calibration curve.
Interferences validation method
The interferences from excipients in determination
of irbesartan35 by the developed analytical method were
evaluated. This was performed by analysis of 1.0×10⁻⁸ mol L-1
bulk irbesartan solution by the developed SW-AdCSV in the absence and in presence of the common excipients (such as microcrystalline cellulose, croscarmellose sodium, lactose monohydrate, hypromellose, silicon dioxide, magnesium stearate, titanium dioxide (E 171), macrogol, carnauba wax, pregelatinized starch and poloxamer 188). The differences in main percentage recoveries (%R) and the relative standard deviations (RSD%) obtained by means of the developed SW-AdCSV method were insigniicant,
since %R ± RSD in the absence of excipients and in their
presence were 99.43 ± 1.38 and 98.66 ± 2.24, respectively.
The results suggested the successful determination of irbesartan by the developed SW-AdCSV method with insigniicant interferences from excipients.
Reproducibility, accuracy and precision
These were examined by performing three replicate analysis of standard solutions of bulk irbesartan by the developed SW-AdCSV method over one day (intra-day
assay) and for three successive days (inter-day assay).35 The
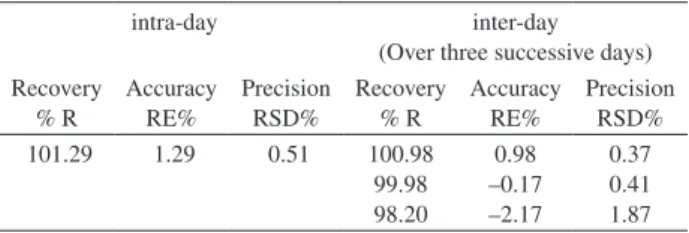
mean percentage recovery (%R) was calculated as a percent of the nominal concentrations in the standard solutions. Accuracy was expressed as relative error (RE%) while precision was assessed from the relative standard deviation in percentage (RSD%) of the mean recovery. The mean percentage recoveries (%R) and relative standard deviations (RSD%) shown in Table (1), indicated the high precision and accuracy of the developed SW-AdCSV method for assay of irbesartan.
Robustness andinter-laboratory precision
In regard to the robustness35 of measurements by the
developed SW-AdCSV method, inluence of small variation of some of the neck operational conditions including pH (3.8 to 4.2) of the medium, preconcentration potential (–0.35 to –0.45 V) and time (100 to 120 s), on %R and RSD% of
5×10⁻⁸ mol L-1 bulk irbesartan was studied. The obtained
mean %R ± RSD (101.02 ± 0.31 to 98.55 ± 0.88) indicated insigniicant effect within the studied range of variation of the optimum operational conditions, and consequently the developed SW-AdCSV method was reliable for assay of bulk irbesartan and it could be considered robust.
The inter-laboratory precision35 of measurements by the
developed SW-AdCSV method was examined by assay of
5.0×10⁻⁸ mol L-1 irbesartan using two PAR- Potentiostats-
Models 263A (Lab 1) and 273 (Lab 2) under the same operational conditions at different elapsed times by two different analysts. The mean percentage recoveries obtained at Lab 1 (99.85 ± 0.2) to Lab 2 (97.58 ± 0.87) were found reproducible.
Applications
Analysis of Aprovel® and Co-Aprovel ® tablets
The developed SW-AdCSV method was successfully
applied for analysis of irbesartan in “Aprovel®” and
in “Co-Aprovel®” tablets, without the necessity for
extraction of the drug prior to the analysis using both the
calibration curve and standard addition methods.36 It is
worth mentioning that no peak due to hydrochlorothiazide
alone has been detected under the optimum operational conditions. Mean percentage recoveries obtained for
analysis of 5.0×10⁻⁸ mol L-1 irbesartan in standard solutions
of Aprovel® and Co-Aprovel® tablets by the developed
SW-AdCSV method were statistically compared with
that obtained by a reported HPTLC method11 (Table 2).
The calculated F-value did not exceed the theoretical
one (Table 2), indicating the insigniicant difference in
reproducibility37 of the developed analytical method and
that of the reported HPTLC one.11 Also, insigniicant
difference was noticed between the described SW-AdCSV
method and the reported one11 regarding accuracy and
precision as revealed by t-test37 (Table 2). These results
conirmed that the developed SW-AdCSV method can be applied successfully for analysis of irbesartan in formulations without interferences either from excipients or co-formulated drug “hydrochlorothiazide”.
Analysis of spiked human serum
A quantitative assay of irbesartan spiked in human serum was carried out successfully by the developed SW-AdCSV methods without the necessity for sample pretreatments and/or time-consuming extraction steps prior to the analysis. SW-AdCS voltammograms of various concentrations of irbesartan spiked in human serum (Figure 5) indicated no interfering peaks from endogenous human serum constituents in analysis of irbesartan. Linear relationship
of SW-AdCS voltammetric peak current magnitudes (ip)
with concentrations of irbesartan spiked in human serum
over the range 7.0×10⁻⁹-2.0×10⁻⁷ mol L-1 was obtained
(Figure 5, inset); its corresponding regression equation
was: ip (µA) = 51.70 C (µmol L–1) + 0.81 (n = 11, r = 0.987)
Limits of detection (LOD) and quantitation (LOQ) of
2.1×10⁻⁹ mol L-1 (8.99x10⁻⁴ µg mL-1) and 7.0×10⁻⁹ mol L-1
(2.99×10⁻³ µg mL-1) irbesartan spiked in human serum was
achieved by means of the developed SW-AdCSV method. The results indicated the reliability of the developed
Table 1. Analytical precision and accuracy of determination of 1.0×10⁻⁷ mol L-1 bulk irbesartan by the developed SW-AdCSV method (n = 3)
intra-day inter-day
(Over three successive days) Recovery % R Accuracy RE% Precision RSD% Recovery % R Accuracy RE% Precision RSD% 101.29 1.29 0.51 100.98
99.98 98.20 0.98 –0.17 –2.17 0.37 0.41 1.87
Table 2. Assay of 5.0×10⁻⁸mol L-1 standard solutions of irbesartan in “Aprovel®tablets” (150 mg irbesartan / tablet) and “Co-Aprovel®
tablets” (300 mg irbesartan + 12.5 mg hydrochlorothiazide) by means of the developed SW-AdCSV and by a reported HPTLC11 methods (n = 4)
Sample (% R ± RSD) F-valuea
and t-testa SW-AdCSV HPTLC11
Aprovel® tablets (A)
(B)
99.73 ± 0.78 99.32 ± 0.75
99.54 ± 0.87 98.47 ± 0.96
1.24 and 1.21 1.78 and 0.58 Co-Aprovel ® tablets
(A) (B)
99.82 ± 0.57 99.59 ± 0.88
99.43 ± 0.74 99.68 ± 0.64
method for assay of irbesartan in human serum and offer the possibility to assay the drug in real plasma samples at different therapeutic dose levels for pharmacokinetic studies as well as therapeutic drug monitoring.
On the other side, several co-administrated drugs (e.g.,
aspirin, ibuprofen, metronidazole, hydrochlorothiazide,
paracetamol and caffeine) or metal ions (e.g., Cu2+, Cd2+,
Pb2+, Ca2+, Mg2+, Al3+, Cd2+, Fe3+, Na+ and K+) did not cause
any interference with analysis of the drug by means of the developed SW-AdCSV method.
Pharmacokinetic studies
A pharmacokinetic study was performed on the plasma samples of two healthy human volunteers following
administration of a single oral dose of Aprovel® tablet.
Peaks of irbesartan in plasma samples as recorded by SW-AdCSV method were of good shape and no additional peak had interfered with that of the analyte. The plasma
concentration vs. time proiles obtained by means of the
developed SW-AdCSV method is shown in Figure 6. The following parameters were assessed for the period of 0-24 h: area under the plasma concentration-time curves from
time zero to the last measurable sample time (AUC0-24) and
to ininity (AUC0-∞); maximum plasma concentration (Cmax);
time of the maximum concentration (tmax); elimination
constant (Kel) and elimination half-life time (t1/2), Table 3.
The pharmacokinetic parameters obtained by the developed SW-AdCSV method was in good agreement with those
previously reported.1-3
Table 3. Pharmacokinetic parameters estimated for two male volunteers (a and b) following an oral administration of a single dose of Aprovel® tablet (150 mg irbesartan) by means of the developed SW-AdCSV method Parameter (unit) Estimated valuesa
(a) (b) Cmax (µg mL-1)
tmax (h)
AUC0-24 (µg h mL-1) AUC0-∞ (µg h mL-1) Kel (h-1)
t1/2 (h)
1.531 1.5 13.015 14.331 0.031 22.15
1.688 1.5 13.929 15.173 0.034 20.20 aMean values of two analyses.
Figure5. SW-AdCS voltammograms for various concentrations of irbesartan spiked in human serum in the acetate buffer of pH 4: (a) background; (b) 1×10⁻⁸; (c) 2×10⁻⁸; (d) 3×10⁻⁸; (e) 4×10⁻⁸ and (f) 5×10⁻⁸ mol L-1; t
acc = 110 s, Eacc = −0.3 V, f = 120 Hz, ∆Es = 12 mV and a = 25 mV. Inset: the peak current (ip) versus concentration (C) of irbesartan spiked in human serum.
Conclusions
The electroreduction of irbesartan at the mercury electrode in buffered solutions has been studied and discussed. A simple, precise and selective SW-AdCSV method was developed for trace quantiication of irbesartan in bulk form, pharmaceutical formulations and human plasma. The developed method showed clear advantages over the reported analytical methods such as short time of analysis, high sensitivity, low price and no necessity for time-consuming extraction steps prior to the analysis. The developed method can be recommended for quantiication of irbesartan in quality control and clinical laboratories.
Acknowledgments
M.M. Ghoneim expresses his gratitude to the Alexander von Humboldt Foundation (Germany) for donating the Electrochemical Analyzer and the Eppendorf centrifuge used in this work. The authors express their gratitude also to Ramadan Specialized Hospital’s staff, (Tanta City, Egypt), for the kind care of the two volunteers and for providing the great facilities for collecting and treatments of the plasma samples required for the pharmacokinetic studies.
References
1. Cazaubon, C.; Gougat, J.; Bousquet, F.; Guiraudou, P.; Gayraud, R.; Lacour, C.; Roccon, A.; Galindo, G.; Barthelemy, G.; Gautret, B.; Bernhart, C.; Perreaut, P.; Breliere, J.-C.; Le Fure, G.; Nisato, D.; J. Pharmacol. Exp. Ther. 1993, 265, 826.
2. Drug Information on irbesartan (AvaproR), http://www.fda.gov/ cder/foi/label/2002/20757s21lbl, accessed in February 2009. 3. Gu, S.; Chen, H.; Qiu, Y.; Shi, S.; Zeng, F.; J. Huazhong Univ.
Sci. Technol. Med. Sci.2002, 22, 14.
4. Caudron, E.; Laurent, S.; Billaud, E. M.; Prognon, P.;
J. Chromatogr., B2004,801, 339. 5. Erk, N.; J. Chromatogr., B 2003, 784, 195.
6. Shakya, A. K.; Al-Hiari, Y. M.; Alhamami, O. M. O.;
J. Chromatogr., B2007, 848, 245.
7. Chang, S. Y.; Whigan, D. B.; Vachharajani, N. N.; Patel, R.;
J. Chromatogr., B 1997, 702,149.
8. González, L.; López, J. A.; Alonso,, R. M.; Jiménez, R. M.;
J. Chromatogr., A, 2002, 949, 49.
9. Bae, S. K.; Kim, M.-J.; Shim, E.-J.; Cho, D.-Y.; Shon, J.-H.; Liu, K.-H.; Kim, E. Y.; Shin, J. G.;Biomed. Chromatogr.2009,
23, 568.
10. Ferreirós, N.; Iriarte, G.; Alonso, R. M.; Jiménez, R. M.; Talanta
2007, 73, 748.
11. Sane, R. T.; Francis, M.; Pawar, S.; Indian Drugs2002,39, 32.
12. Kristoffersen, L.; Oiestad, E. L.; Opdal, M. S.; Krogh, M.; Lundanes, E.; Christophersen, A. O. S.; J. Chromatogr., B2007,
850, 147.
13. Vetuschi, C.; Giannandrea, A.; Carlucci, G.; Mazzeo, P.;
Il Farmaco 2005, 60,665.
14. Albero, I.; Ródenas, V.; Soledad, G.; Sánchez-Pedreño, C.;
J. Pharm. Biomed. Anal.2002, 29, 299.
15. Hisham, E. A.; Spectrochim. Acta, Part A2007, 66, 1248. 16. Erk, N.; Pharmazie 2003, 58, 543.
17. Joseph-Charles, J.; Brault, S.; Boyer, C.; Langlois, M.-H.; Cabrero, L.; Dubost, J.-P.; Anal. Lett.2003,36, 2485. 18. Naisur, R.; Masoom, R. S.; Syed, N. H. A.; Chem. Pharm. Bull.
2006,54, 626.
19. Gonzalez, L.; Alonso, R. M.; Jimenez, R. M.; Chromatographia
2000, 52, 735.
20. Bozal, B.; Dogan-Topal, B.; Uslu, B.; Ozkan, S. A.; Aboul-Enein, H. Y.; Anal. Lett.2009, 42, 2322.
21. Habib, I. H. I.; Weshahy, S. A.; Toubar, S.; El-Alamin, M. M. A.; Pharm. Chem. J.2008, 42,438.
22. Pekmez, N. O.; Can, M.; Yildiz, A.; Acta Chim. Slov. 2007, 54, 131. 23. Cakir, S.; Bicer, E.; Odabasoglu, M.; Albayrak, C.; J. Braz.
Chem. Soc.2005, 16, 711.
24. Malik, W. U.; Goyal, R. N.; Jain, R.; J. Electroanal. Chem.
1978, 87, 129.
25. Malik, W. U.; Goyal, R. N.; Talanta1976, 23, 705.
26. Habib, I. H. I.; Weshahy, S. A.; Toubar, S.; El-Alamin, M. M. A.; Portugaliae Electrochim. Acta 2008, 26,315.
27. Cagigal, E.; Gonzalez, L.; Alonso, R. M.; Jimenez, R. M.;
J. Pharm. Biomed. Anal.2001, 26, 477.
28. Koldobskii, G. I.; Ostrovskii, V. A.; Gidaspov, B. V.; Chem. Heterocycl. Compd.1980, 16, 665.
29. March, J.; Advanced Organic Chemistry: Reactions, Mechanisms and Structure, Wiley: New York, 1992.
30. Zuman, P.; The Elucidation of Organic Electrode Processes, Academic Press: New York, 1969.
31. Nicholson, R.S.; Shain, I.; Anal. Chem.1964, 36, 706.
32. Greef, R.; Peat, R.; Plter, I. M.; Pletcher, D.; Robinson, J.;
Instrumental Methods of Analysis in Electrochemistry, E. Horwood: Chichester, 1985.
33. Laviron, E.; Roullier, L.; Degrand, C.; J. Electroanal. Chem.
1980, 112, 11.
34. Miller, J. N.; Analyst1991, 116, 3.
35. The USA Pharmacopoeia; The National Formulary, USP 26, Convention Inc. 2003.
36. Ewing, G. W.; Instrumental Methods of Chemical Analysis, 5th
ed., Lippincott-Raven: Philadelphia, 1995.
37. Christian, G. D.; Analytical Chemistry, 5th ed., Wiley: Hoboken,
NJ 1994.
Submitted: April 25, 2010