Article
Printed in Brazil - ©2011 Sociedade Brasileira de Química0103 - 5053 $6.00+0.00
A
*e-mail: [email protected]
Local Electrochemical Investigation of Single Grains of Polycrystalline
Cu-16%Zn-8%Al Alloy
José T. C. Barragan,a Matildes Blanco,a Nilso Barelli,a Rodrigo Della Noce,a
Cecílio S. Fugivara,a Javier Fernándezb and Assis V. Benedetti*,a
aDepartamento de Físico-Química, Instituto de Química, Universidade Estadual Paulista,
14801-970 Araraquara-SP, Brazil
bDepartamento de Ciencia de Materiales e Ingeniería Metalúrgica, Universitat de Barcelona,
08028 Barcelona, Spain
Estudos eletroquímicos localizados de grãos individuais de uma liga policristalina Cu-16%Zn-8%Al foram realizados em solução de tampão borato (pH 8,4) por meio da técnica eletroquímica com microcapilar. As orientações dos grãos, determinadas pelo método de retro-reflexão de Laue, foram predominantemente próximas à direção [110], sugerindo uma texturização da amostra. As medidas de potencial em circuito aberto mostraram que o menor potencial de estado estacionário foi observado para o grão que possui o maior número de degraus
na superfície da liga. Os experimentos de voltametria cíclica sugeriram que a orientação do Cu2O
segue a orientação do substrato na liga Cu-Zn-Al, enquanto que CuO cresce independentemente.
Local electrochemical studies of single grains of a polycrystalline Cu-16%Zn-8%Al alloy were investigated in borate buffer solution (pH 8.4) by means of microelectrochemical technique. The grain orientations, which were determined by the Laue back-reflection method, were predominantly close to [110] direction, suggesting that the sample was texturized. The open circuit potential measurements showed that the lower steady state potential was observed for the grain which has the highest number of steps on the alloy surface. The cyclic voltammetry experiments suggested
that the orientation of Cu2O follows the substrate one in the Cu-Zn-Al alloy, while CuO grows
independently.
Keywords: Cu-Zn-Al alloys, shape memory alloys, single grains, borate buffer,
microelectrochemical cell
Introduction
Since the discovery of shape memory effect (first in Au-Cd alloys and later in Ni-Ti ones)1,2 great effort and
funds have been spent on the study of shape memory alloys (SMAs) by virtue of their attractive properties such as low cost, pseudoelasticity and two-way shape memory effect (TWSME).3-7 Cu-based and Ni-Ti alloys fill up these
requisites, for instance. Owing to these unique properties, SMAs have been classified as “smart” or “intelligent” materials along with ferroelectric and piezoelectric ones.8,9
These materials exhibit a reversible transformation in macroscopic size which is controlled by changes of external conditions such as temperature, pressure or magnetic field.
In this context, SMAs have a myriad of applications in the engineering and medical fields including couplings, sensors, actuators, antennas for mobile phones,10 air
conditioning systems,11 active endoscopes and artificial
muscle components for robotics.12
data, at comparable zinc and aluminum contents, the β-alloy is less sensitive to dezincification than the β’ structure.
Differently from single crystal materials, which have no grain boundaries, polycrystalline ones are composed of several grains varying in size and orientation. The role of each single grain is not detected by using surface-averaged techniques. Thus, the study and understanding of their activities (e.g., electrochemical) in a local point of view are needed. Local electrochemistry via electrochemical microcell has been, and continues to be, extensively employed in numerous fields such as corrosion studies,14-16 batteries,17-19 electrodeposition20-22 and
biological environments.23-25 Besides local resolution, the
use of electrochemical microcell has significant advantages compared to conventional one. In this sense, it may be cited the possibility of employing aggressive solutions, small wetted area and amounts of the electrolyte, small mechanical stress applied to the sample, among others.16,26 Therefore,
this work is aimed to monitor the electrochemical activity of single grains on the surface of a polycrystalline Cu-Zn-Al alloy by means of microelectrochemical technique.
Experimental
The polycrystalline Cu-16(wt.%)Zn-8(wt.%)Al alloy was obtained by melting the metals with purity higher than 99.9% using an induction furnace from Inductotherm Power-Track under argon atmosphere in a graphite crucible. The melting temperature was about 1400 °C. The resulting ingot was machined to produce small discs (10 mm diameter and 5 mm thickness) that were annealed at 850 °C for 20 min under argon atmosphere in an EDGCOM 3P furnace. After that, the sample was promptly quenched to water at 100 °C and finally to water at 0 °C. This procedure was made in order to obtain the alloy containing the β-phase27,28 under room temperature conditions.
The alloy chemical analysis was determined using an atomic absorption spectrophotometer from Varian Intralab AA-1475. The results are shown in Table 1.
The samples were polished using SiC and diamond paste, etched and examined by optical and scanning electron microscopy (SEM). Optical and SEM images were obtained using a Leica DMR optical and a Jeol
JSM-T330A SEM microscope, respectively. X-ray diffraction (XRD) measurements were performed in the 2θ range of 10-100° with step size of 0.05o and step time
of 5 s using a Siemens D5000 X-ray generator. CuKα (1.5418 Å) radiation was used at 40 kV and 30 mA with monochromator at the diffracted beam.
After a slight attack to reveal the sample surface using an etching solution (0.5 g FeCl3, 3 mL concentrated HCl,
3 mL isoamyl alcohol, 3 mL ethanol and 0.5 mL distilled water), the grains were marked with numbers to facilitate a posterior analysis. In order to determine the grain orientations, the Laue back-reflection method was used,29-32
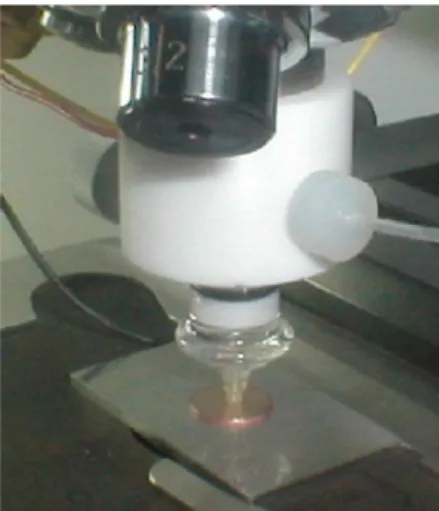
whose data were interpreted by utilizing a Greninger chart. The electrochemical studies were carried out in a homemade microcell developed in our laboratory.33 An
overview of the experimental set-up utilized to perform the microelectrochemical measurements is shown in Figure 1. To facilitate the visualization of the desired area, the microcell was coupled to a Carl Zeiss optical microscope. The ground tip of the microcell could be varied from 20 to 600 µm in diameter. In all experiments, a 600 µm tip was used because it demonstrated to be the most appropriate to study the single grains.
The employed electrochemical methods were open-circuit potential and cyclic voltammetry using an EG&G PAR Model 273A Potentiostat/Galvanostat, which was connected to an IBM-PC computer. The used electrolyte in all measurements was the borate buffer solution pH 8.4 containing 0.3 mol L-1 H
3BO3 and 0.075 mol L-1 Na2B4O7,
prepared from analytical grade reagents (Merck) and Milli-Q water (18.2 MΩ cm). The volume for each experiment was 1 mL of a deaerated aqueous solution. The reference electrode was a Hg/HgO/OH− which was
prepared according to the procedure previously described.34
Table 1. Chemical composition of the polycrystalline Cu-Zn-Al alloy obtained by atomic absorption spectrophotometer
Element wt.% (± 0.5) at.% (± 0.5)
Cu 75.5 68.3
Zn 16.4 14.4
Al 8.10 17.3
The potential of this electrode vs. SHE is 0.431 V. A Pt wire was used as auxiliary electrode. In the cyclic voltammetry experiments, a 0.1 µF non-electrolytic capacitor connecting a Pt wire to the reference electrode was utilized in order to minimize noise. This avoids the reference electrode polarization and diminishes the ohmic drop.35
Results and Discussion
Physical characterization
Figure 2 displays the SEM image of polycrystalline Cu-16(wt.%)Zn-8(wt.%)Al alloy after etching with an acid solution of FeCl336 for 10 s. No lamellar structure or
plate presence (typical of martensitic phase) is observed, indicating that the quenching process was effective, giving rise to an alloy containing only the β-phase. In fact, thermal treatments, such as quenching and annealing, applied to brass using high temperatures for long periods of time may cause dezincification to Cu-Zn-based alloys.37 In addition,
β-brasses (including the Cu-Zn-Al alloys) are known by presenting an excessive grain growth when submitted to heat treatments at temperatures corresponding to the single phase region.38
The existence of an alloy containing only the β-phase was also confirmed by XRD diffractogram as shown in Figure 3. The peaks referring to 40.35°, 42.22°, 44.14° and 46.01° were attributed to the β-phase. No other phases were noticed.
Determination of single grain orientations
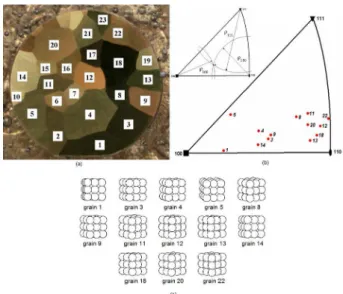
Figure 4a depicts the optical micrograph of polycrystalline Cu-16(wt.%)Zn-8(wt.%)Al alloy obtained
by petrographic microscopy. It can be noticed different grains varying in size and shape. By virtue of the alloy cubic symmetry, the stereographic projection can be divided in 24 similar and equivalent triangles, each one possessing {100}, {110} and {111} forms. In this sense, the grain orientations are better indicated by ρ100, ρ110 and ρ111
angles referring to the plane slope with respect to the low Miller index planes [(100), (110) and (111)], respectively. Table 2 shows the ρ100, ρ110 and ρ111 values found for the
different single grains of Cu-16(wt.%)Zn-8(wt.%)Al alloy that were projected into a fundamental triangle illustrated in Figure 4b. A schematic view of the relative position of each single grain on the surface of the alloy is shown in Figure 4c. It is seen that most of the grains are located Figure 2. SEM image of polycrystalline Cu-16(wt.%)Zn-8(wt.%)Al alloy
after etching for 10 s.
Figure 3. XRD pattern of polycrystalline Cu-16(wt.%)Zn-8(wt.%)Al alloy.
close to the [110] direction, suggesting that the sample is texturized. According to Yuan et al.,39 the austenite
(β-phase) presence in polycrystalline Cu-Zn-Al alloys exhibits texture with respect to the [110] direction. The knowledge about texture in polycrystalline SMAs such as Cu-Zn-Al alloys is of great interest because it is intrinsically related to the plasticity of the phase transformation.39
Electrochemical measurements: open circuit potential and voltammetry
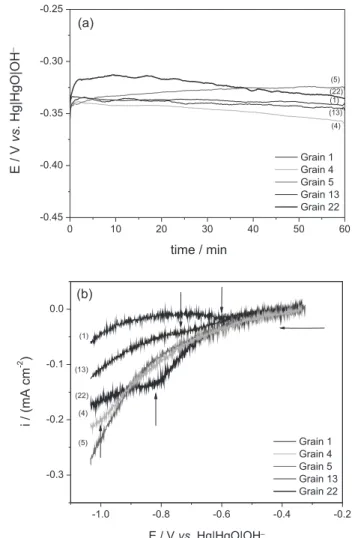
Figure 5a displays the open circuit potential measurements (Eoc curves) obtained for the single grains
of polycrystalline Cu-16(wt.%)Zn-8(wt.%)Al alloy in borate buffer solution pH 8.4. A difference of about 40 mV was noticed among the curves, indicating that the alloy stability in this medium depends on the crystallographic orientation. The lower steady state potential was observed for the grain 5 which is most likely affected by its higher number of steps (64) on the alloy surface. After the Eoc
curves, it was recorded the linear voltammograms of each single grain, scanning the potential in the direction of the oxides reduction, which were formed on the surface (Figure 5b). It is seen a low intensity peak at −0.58 V/Hg/HgO/OH− for the grain 1, while for the
grain 13 this peak appears at −0.72 V/Hg/HgO/OH−. The
voltammogram for the grain 4 shows a reduction peak at ca. −1.0 V/Hg/HgO/OH−. The grain 5 does not have
reduction peak and the grain 22 depicts a well-defined peak at −0.80 V/Hg/HgO/OH−. All of these peaks are probably
owing to the reduction of copper(I) oxides, which were
formed in the exposure of the grains to the electrolyte. This evidences that the amount and stability of the oxide film are dependent on the crystallographic orientation.
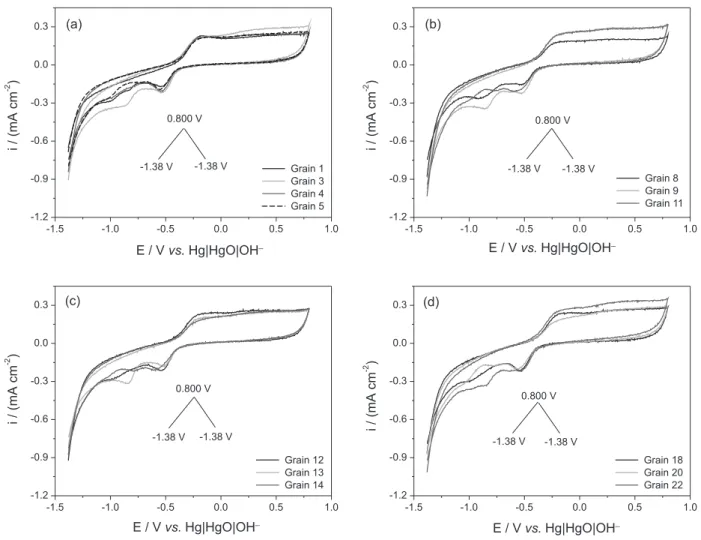
Figure 6 shows the cyclic voltammograms for different single grains of the polycrystalline Cu-16(wt.%)Zn-8(wt.%)Al alloy obtained with a scan rate (ν) of 20 mV s-1. The main difference observed in
all cases concerns the reduction region of Cu2O to Cu.
Scanning tunneling microscopy (STM) studies for single crystal Cu (111) and Cu (001) in 0.1 mol L-1 NaOH showed
that Cu2O formation obeys the substrate orientation, while
CuO grows independently of it.40,41 In this sense, the
cuprous oxide grew onto Cu (111) following the substrate orientation and leading to Cu2O (111) formation, similarly
the Cu2O (001) one. However, it is noticed that the cupric
oxide does not obey the substrate orientation and thus it is orientated in both cases in CuO (001). Therefore, Table 2. ρhkl values found for the different single grains of
Cu-16(wt.%)Zn-8(wt.%)Al alloy which were projected into a fundamental triangle
Grain ρ100 / degree ρ110 / degree ρ111 / degree
1 12 33 48
3 27 19 36
4 24 22 35
5 18 32 36
8 37 14 27
9 28 19 36
11 40 12 26
12 43 7 29
13 40 7 36
14 23 22 40
18 41 5 32
20 40 10 30
22 46 8 27
Figure 5. (a) Open circuit potential measurements for single grains of polycrystalline Cu-16(wt.%)Zn-8(wt.%)Al alloy and (b) linear voltammograms at ν = 20 mV s-1 (highlighting the reduction of oxides
it is suggested that the orientation of Cu2O follows the
substrate one also in the Cu-Zn-Al alloy and this may be the main feature of the differences observed by cyclic voltammograms for the single grain.
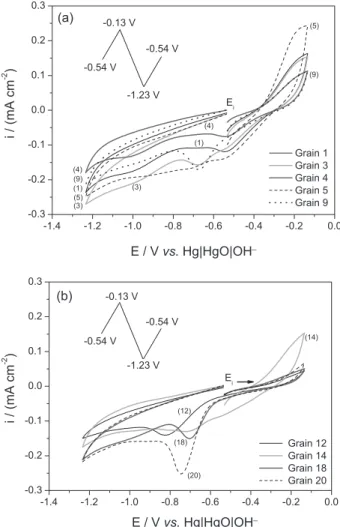
The i-E profiles presented in Figure 6 indicate that the cupric oxide grows independently of the substrate orientation. Due to this fact, the current peak corresponding to its reduction does not significantly alter as the grain orientation is modified. By contrast, the regions with respect to the formation and reduction of cuprous oxide seem to be more influenced by the grain orientation. In this case, it is noticed a variation in the anodic current and also in the presence of multiple reduction peaks that are dependent on the grain orientation. In order to confirm this observation, cyclic voltammograms (Figure 7) were recorded using an anodic scan up to the positive limit of Cu2O formation potential followed by the cathodic scan.
It is verified in all cases that the potential and the current density of the reduction peaks, which are attributed to the Cu2O reduction, present values considerably different.
These differences are better understood when the current
densities taken at −0.13 V/Hg/HgO/OH− (the switching
potential) are analyzed. At this potential value, the anodic peak essentially represents the copper oxidation to cuprous oxide (Cu2O). Assuming that oxide is also formed
on the surface during the alloy etching, it would diminish the anodic current value at about −0.13 V/Hg/HgO/OH−.
Hence, it would be expected that grains with orientations close to the plane (110) would more easily oxidize during the etching and consequently, they give rise to low current densities at −0.13 V/Hg/HgO/OH− (as observed for the
grains 12, 18 and 20). In this context, the anodic current densities at −0.13 V/Hg/HgO/OH− were correlated to the
ρ100, ρ110 and ρ111 values which are the angles between the
grain orientation and the main low Miller index planes. These data are summarized in Table 3.
It is noticed that an increase in ρ110 value (and in lower
magnitude in ρ111) results in current density increase as
well. On the other hand, an augment in ρ100 gives rise to
Table 3. Current densities at −0.13 V/Hg/HgO/OH− (reversal potential) and
ρhkl values for single grains of polycrystalline Cu-16(wt.%)Zn-8(wt.%)Al
alloy
Grain i / (mA cm-2) ρ
100 / degree ρ110 / degree ρ111 / degree
1 0.163 12 33 48
3 0.154 27 19 36
4 0.112 24 22 35
5 0.243 18 32 36
9 0.112 28 19 36
12 0.044 43 7 29
14 0.153 23 22 40
18 0.050 41 5 32
20 0.067 40 10 30
Figure 7. Cyclic voltammograms of single grains of polycrystalline
Cu-16(wt.%)Zn-8(wt.%)Al alloy in borate buffer solution pH 8.4 and
ν = 20 mV s-1 (emphasizing the region of Cu oxidation to Cu
2O) (adapted
from reference 33).
Conclusions
The local electrochemical studies of single grains of polycrystalline Cu-16(wt.%)Zn-8(wt.%)Al alloy in
borate buffer solution were fruitfully performed by using an electrochemical microcell. The single grains exhibited texture with a preferred orientation close to (110) plane. In general, the alloy electrochemical behavior displayed a dependence of the crystallographic orientation of each single grain. The grains, whose orientations are more distant of the low Miller index planes, presented a more active surface, being possibly related to its higher number of atomic steps.
Acknowledgements
The authors gratefully acknowledge financial support and scholarships from the Brazilian funding agencies Fundação de Apoio à Pesquisa do Estado de São Paulo (FAPESP, proc. No. 2004/11984-2) and Conselho Nacional de Desenvolvimento Científico e Tecnológico (CNPq, proc. No. 305890/2010-7).
References
1. Chang, L. C.; Read, T. A.; Trans., AIME1951, 189, 47.
2. Buehler, W. J.; Gilfrich, J. W.; Wiley, R. C.; J. Appl. Phys.1963,
34, 1475.
3. Li, Z.; Pan, Z. Y.; Tang, N.; Jiang, Y. B.; Liu, N.; Fang, M.; Zheng, F.; Mater. Sci. Eng., A2006, 417, 225.
4. Xiao, Z.; Li, Z.; Fang, M.; Xiong, S.; Sheng, X.; Zhou, M.;
Mater. Sci. Eng., A2008, 488, 266.
5. Zak, G.; Kneissl, A. C.; Zatulskij, G.; Scr. Mater.1996, 34, 363. 6. Serra, G. C.; Benedetti, A. V.; Noce, R. D.; J. Braz. Chem. Soc.
2010, 21, 1530.
7. Fernandez, J.; Zhang, X. M.; Guilemany, J. M.; J. Mater. Process. Technol.2003, 139, 117.
8. Adiguzel, O.; J. Mater. Process. Technol.2007, 185, 120.
9. Ciatto, G.; Solari, P. L.; De Panfilis, S.; Fiorini, A. L.; Amadori, S.; Pasquini, L.; Bonetti, E.; Appl. Phys. Lett.2008, 92, 241903.
10. Otsuka, K.; Kakeshita, T.; MRS Bull. 2002, 27, 91. 11. Todoroki, T.; Met. Technol. 1984, 54, 2.
12. Madden, J.; Science2006, 311, 1559.
13. Celis, J. P.; Roos, J. R.; Terwinghe, F.; J. Electrochem. Soc.
1983, 130, 2314.
14. Suter, T.; Böhni, H.; Electrochim. Acta1998, 43, 2843.
15. Kobayashi, Y.; Virtanen, S.; Böhni, H.; J. Electrochem. Soc.
2000, 147, 155.
16. Andreatta, F.; Matesanz, L.; Akita, A. H.; Paussa, L.; Fedrizzi, L.; Fugivara, C. S.; Salazar, J. M. G.; Benedetti, A. V.; Electrochim. Acta, 2009, 55, 551.
17. Verbrugge, M. W.; Koch, B. J.; J. Electroanal. Chem.1994,
367, 123.
18. Ura, H.; Nishina, T.; Uchida, I.; J. Electrochem. Soc.1995, 396,
19. Kostecki, R.; McLarnon, F.; Electrochem. Solid-State Lett.2004,
7, A380.
20. De Abril, O.; Mandler, D.; Unwin, P. R.; Electrochem. Solid-State Lett.2004, 7, C71.
21. Sheffer, M.; Mandler, D.; Electrochim. Acta2009, 54, 2951. 22. Lin, J. C.; Chang, T. K.; Yang, J. H.; Chen, Y. S.; Chuang, C. L.;
Electrochim. Acta2010, 55, 1888.
23. Wightman, R. M.; Anal. Chem.1981, 53, 1125A.
24. Pons, S.; Fleisehmann, M.; Anal. Chem.1987, 59, 1391A. 25. Chen, T. K.; Lau, Y. Y.; Wong, D. K. Y.; Ewing, A. G.; Anal.
Chem.1992, 64, 1264.
26. Lohrengel, M. M.; Moehring, A.; Pilanski, M.; Electrochim. Acta2001, 47, 137.
27. Satto, C.; Jansen, J.; Lexcellent, C.; Schryvers, D.; Solid State Commun.2000, 116, 273.
28. Baker, H.; Okamoto, H.; ASM Handbook, Alloy Phase Diagrams, vol. 3; ASM International: USA, 1992, p. 3.13. 29. Warren, B. E.; J. Appl. Phys.1941, 12, 375.
30. Cullity, B. D.; Elements of X-ray Diffraction; Reading, Mass., Addison-Wesley Pub. Co.: Massachusetts, 1956, ch. 8. 31. ASTM E82-91: Standard Test Method for Determining the
Orientation of a Metal Crystal, ASTM International, West
Conshohocken, PA, 1996.
32. Zambrano, U. C.; Blanco, M.; Barelli, N.; Benedetti, A. V.; Fernández, J.; Quim. Nova2008, 31, 154.
33. Akita, A. H.; Barragan, J. T. C.; Fugivara, C. S.; Benedetti, A. V.;
Quim. Nova, in press.
34. Ives, D. J. G.; Janz, G. J.; Reference Electrodes: Theory and Practice; Academic Press: New York, 1961.
35. Garreau, D.; Saveant, J. M.; Binh, S. K.; J. Electroanal. Chem.
1978, 89, 427.
36. Ricksecker, R. E.; Bower, T. F.; Metallography and Microstructures: Copper and Copper Alloys, vol. 9; American
Society for Metals Handbook, Metals Park: Ohio, 1985, p. 399.
37. Giacobbe, F. W.; J. Alloys Compd.1993, 202, 243.
38. Gil, F. J.; Guilemany, J. M.; Fernandez, J.; Mater. Sci. Eng., A
1998, 241, 114.
39. Yuan, W. Q.; Wang, J. N.; J. Mater. Process. Technol.2002,
123, 31.
40. Kunze, J.; Maurice, V.; Klein, L. H.; Strehblow, H. H.; Marcus, P.; J. Electroanal. Chem.2003, 554, 113.
41. Kunze, J.; Maurice, V.; Klein, L. H.; Strehblow, H. H.; Marcus, P.; Corros. Sci.2004, 46, 245.
Submitted: June 17, 2011
Published online: September 8, 2011