USING ELECTRE TRI TO SUPPORT MAINTENANCE OF WATER DISTRIBUTION NETWORKS
Flavio Trojan and Danielle Costa Morais*
Received July 26, 2011 / Accepted December 23, 2011
ABSTRACT.Problems encountered in the context of the maintenance management of water supply are evidenced by the lack of decision support models which gives a manager overview of the system. This paper, therefore, develops a model that uses, in its framework, the multicriteria outranking method ELECTRE TRI. The objective is to sort the areas of water flow measurement of a water distribution network, by priority of maintenance, with data collected from an automated system of abnormalities detection. This sorting is designed to support maintenance decisions in terms of the measure more appropriate to be applied per region. To illustrate the proposed model, an application was performed in a city with 100 thousand water connections. With this model it becomes possible to improve the allocation of maintenance measures for regions and mainly to improve the operation of the distribution network.
Keywords: multicriteria decision making, maintenance management, water supply maintenance.
1 INTRODUCTION
It is noticeable that in some countries, there is deficiency in the management of potable water use by the sanitation companies and it generates undesirable wastage such as: physical and economic losses as well, which are due to, in some cases, the lack of planning on the achievements of the system maintenance. Because of the importance of water supply, natural resource essential to human, is that studies are designed to improve the maintenance actions in distribution networks, with the main objective of reducing the problems of those networks, and therefore, waste.
Lambert & Hirner (2000) showed that water supply systems have, by their nature and complex-ity, some degree of loss in production and distribution. A major problem highlighted is that water utilities have been living with high levels of losses, mainly by lack of management and appropri-ate decisions. The result of losses in a supply system for consumers is that there is a reduction of service quality in terms of water availability and pollution problems caused by negative pres-sures, arising from interruptions in supply, beyond the financial impact on companies.
*Corresponding author
These problems usually stand out in medium and large cities and the factors that help to further aggravate them are the population growth; extended periods of drought; the irrational use of water, mainly by the lack of planned maintenance and sometimes even the inadequate operation of treatment systems and distribution, which causes high rates of damage by constant losses in the pipes.
Historically, when there are high losses in the supply system, it becomes more economical to improve, rationalize water use and perform continuous maintenance in order to keep the system efficient, to build new systems, which certainly will lead to high installation costs, plus envi-ronmental impact. Issues relating to loss of water must be treated and managed with preventive measures aimed to improve the procedures for maintenance and operation of networks.
Therefore, investments are required by the authorities in conservation programs and efficiency in water use and also the maintenance of distribution networks to reduce losses, but if these investments are not made, the future may be brought into social chaos likely derived from the lack of water. So, in this case the problem is the lack of foresight, decisions, planning and investments by the public sector and the management companies.
On the other hand, make a decision about where and how to act in these situations can be a very complex task because there are a number of difficulties, which consider different criteria that constantly present conflicts among them. Thus, managers responsible for planning and decisions in the sanitation maintenance sector are seeking to integrate available resources with the corpo-rate goals; however in most cases they do not have access to specific models to support decision making and appropriate tools to aid these decisions.
Nevertheless, multicriteria analysis is a technique to structure and analyze complex decisions, which involve multiple criteria, some of them conflicting with each other when evaluating the actions, so the consequences of which have economic, social and environmental impacts (Ha-jkowicz, 2008). Hajkowicz & Collins (2007) identified eight areas of application of multicriteria analysis in water resources: catchment management; ground water management; infrastructure selection; project appraisal; water allocation; water policy and the planning of supply; water qual-ity management; and marine protected area management. Multicriteria analysis also can provide solutions for complex water decision-making problems (Silvaet al., 2010; Morais & Almeida, 2006; Morais & Almeida, 2010). For others recent surveys on the subject, see, Opricovic (2009), Raju & Kumar (2006), and Rajuet al.(2000).
availabil-ity of the aging model systems in standby mode, based on the generalized renewal process, to be used to optimize the scheduling of testing and preventive maintenance. As well, the aim of this study is to provide a tactical view on the actions to be implemented, the model of Damaso & Garcia (2009), could be incorporated into a second stage of this work, when the actions are effectively implemented in order to promote a more detailed study for preventive maintenance.
Indeed, in the literature are found few models that specifically address the question of mainte-nance management on water distribution networks. Furthermore, the models found deals with the problematic of ranking or selection. However, any procedure was found to deal the prob-lem with a sorting probprob-lematic. Then, this paper presents a new development with regard to the management and automatic routing of effective maintenance actions which consequently will generate quality improvements, operation and customer satisfaction. These features provide for the maintenance manager in higher quality decisions allocated to address critical maintenance problems that often plague the population directly.
In this context, there are also some difficulties regarding to allocate an adequate maintenance procedure to be implemented in a specific region to maintain the water distribution system, since there are many aspects of assessments and also different goals to be achieved. As stated before, Moraiset al.(2010) proposed a prioritization of areas in water supply network to help the opera-tional network management. However, the rank achieved by PROMETHEE I was not enough to give an overview of the water distribution network. Hence, this paper presents a multicriteria de-cision model, which characterizes a new analysis technique in the maintenance management and uses the multicriteria outranking method ELECTRE TRI, in order to support decision making in the field of sanitation maintenance, through sorting regions from water distribution network into classes of maintenance prioritization, and thereby improve the application of maintenance actions, essentially to reduce losses.
Briefly, this paper is organized as follow: Section 2 presents a brief description of the problem of maintenance management and water losses in water supply systems; Section 3 presents the proposed model; Section 4 describes an application of the proposed model in a water distribution network; Section 5 an analysis and evaluation of results is presented, and, finally, Section 6 presents the final remarks.
2 MAINTENANCE MANAGEMENT
An important point to consider, when maintenance is a strategy in business: stop breeding or pro-viding services to clients for losses or undesirable situations may become fatal to the performance and development of a company (Kardec & Carvalho, 2002). The maintenance management has an important role in the success of programs to combat waste and the effectiveness of control techniques and systems management. The activities cannot cease without causing unacceptable losses to the productive process.
or maintenance of an item, but also decisions on actions planned and scheduled to ensure avail-ability of products or services and the efficiency of the organization against the market and its customers.
Companies that operate in water supply, often perform maintenance on the supply networks in corrective or preventive forms. Maintenance is a constant in this industry, because the carri-ers pipes break frequently due to many factors: whether for repairs to urban roads, either by increasing on the pressures on these networks or by climatic factors.
Strategic maintenance needs to be applied in a systematic manner through management plans and decisions on programming along with improvements in the supply system; with it companies improve the availability of products and services.
To adopt a policy of work seeking to apply the maintenance effectively, it should be noted two essential points, the first one is about the physical losses and the non-physical (or commercial) and the second, the maintenance alternatives.
The physical losses are the resulting from:
• visible or not visible leaks,
• damaged appliances, poorly maintained or out of its useful life,
• low quality of the hydraulic materials,
• leakage in reservoirs;
• lack of sectors in areas of pressure and maneuver, causing high pressure on the networks, Consequently resulting in disruptions on the pipes, fittings, valves and metering devices that compose the system (Moraiset al., 2010).
The not physical losses, or commercial, are cases in which the water arrives the consumer, how-ever illegally, impediment that the values on the consumption have being recorded, causing eco-nomic losses for the company and increasing the rate of waste, as these losses are added to the overall index.
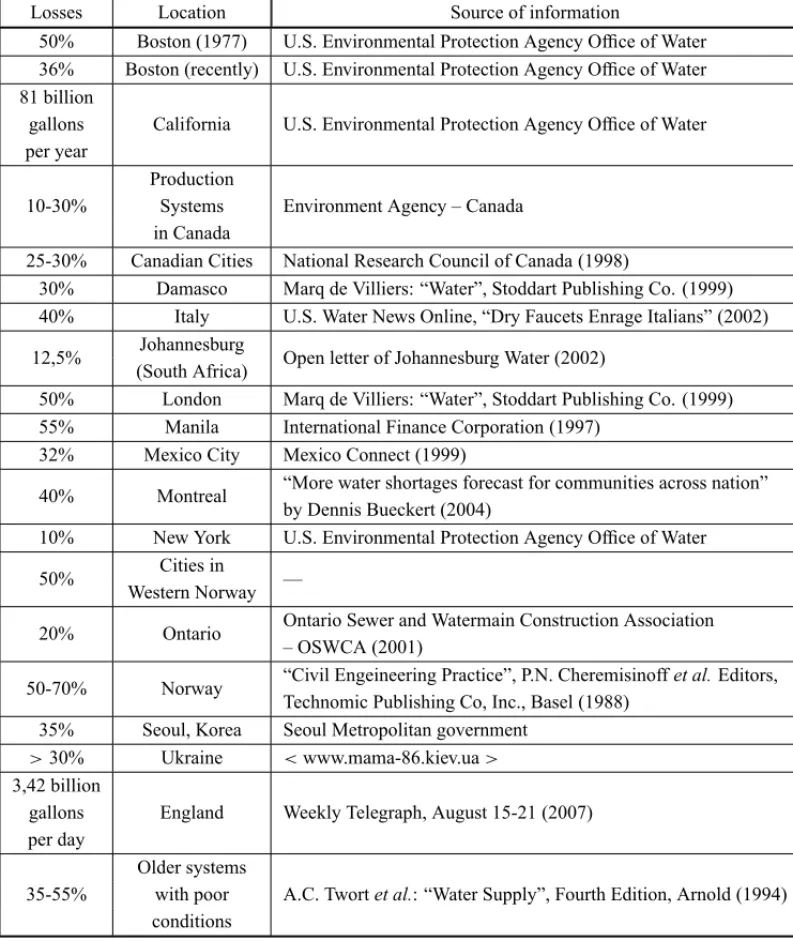
The illegal connections, besides the economic loss because they are poorly installed, easily break down and result in an unknown or difficult access leak. As an illustration, Table 1, below, pro-vides some information on losses estimated at several locations in the world:
The maintenance alternatives aimed at conservation and combating water wastage are linked simultaneously to the planning, to the project, to the construction, to the operation and, to the maintenance of systems itself.
Table 1– Estimated losses of water leaking from pipes in some cities in the world (Water Pages, 2001).
Losses Location Source of information
50% Boston (1977) U.S. Environmental Protection Agency Office of Water 36% Boston (recently) U.S. Environmental Protection Agency Office of Water 81 billion
California U.S. Environmental Protection Agency Office of Water gallons
per year
10-30%
Production
Environment Agency – Canada Systems
in Canada
25-30% Canadian Cities National Research Council of Canada (1998)
30% Damasco Marq de Villiers: “Water”, Stoddart Publishing Co. (1999) 40% Italy U.S. Water News Online, “Dry Faucets Enrage Italians” (2002)
12,5% Johannesburg Open letter of Johannesburg Water (2002) (South Africa)
50% London Marq de Villiers: “Water”, Stoddart Publishing Co. (1999) 55% Manila International Finance Corporation (1997)
32% Mexico City Mexico Connect (1999)
40% Montreal “More water shortages forecast for communities across nation” by Dennis Bueckert (2004)
10% New York U.S. Environmental Protection Agency Office of Water
50% Cities in —
Western Norway
20% Ontario Ontario Sewer and Watermain Construction Association – OSWCA (2001)
50-70% Norway “Civil Engeineering Practice”, P.N. Cheremisinoffet al.Editors, Technomic Publishing Co, Inc., Basel (1988)
35% Seoul, Korea Seoul Metropolitan government >30% Ukraine <www.mama-86.kiev.ua> 3,42 billion
England Weekly Telegraph, August 15-21 (2007) gallons
per day
35-55%
Older systems
A.C. Twortet al.: “Water Supply”, Fourth Edition, Arnold (1994) with poor
conditions
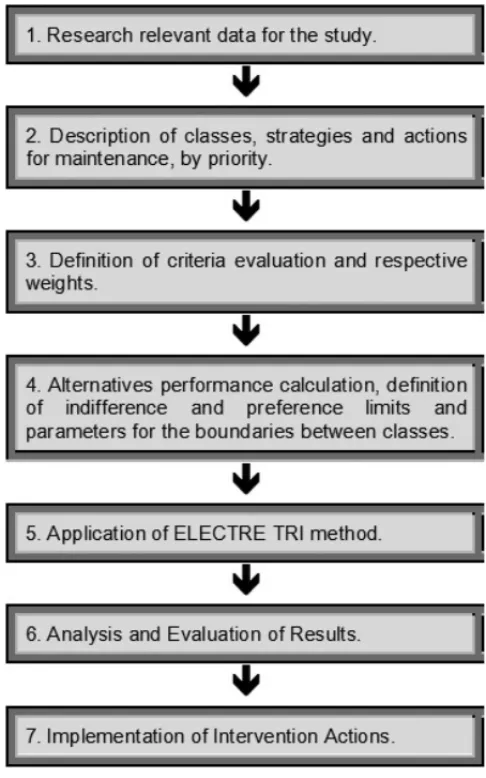
3 PROPOSED DECISION MODEL
Figure 1– Diagram of the proposed decision model.
The quantitative models can be characterized because they can be investigated by the techniques of mathematical analysis. The application of these techniques is particularly necessary to obtain somehow a structured decision for the indicated problem. To obtain a quantitative model, all variables must be restricted to be measurable cardinally.
In addition to it, the model must be quite simple so that mathematics can be applied successfully. The choice of the method used depends on the type of problem in examination, of the studied context, the actors involved, the structure of preferences and the type of response that you want to achieve, in other words, what is the reference problem (Gomeset al., 2002).
3.1 The ELECTRE TRI method
The ELECTRE TRI is a multicriteria method that allocates alternatives in predefined categories.
This allocation of an alternativearesults from the comparison ofa with defined profiles of the limits from the categories (Mousseau & Slowinski, 1998; Yu, 1992).
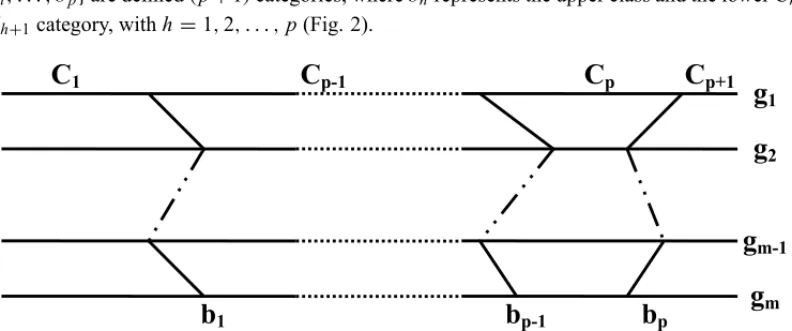
Given a set of criteria indices {g1, . . . ,gi, . . . ,gm} and a set of indices of profiles {b1, . . . , bh, . . . ,bp}are defined(p+1)categories, wherebhrepresents the upper class and the lowerCh,
Ch+1category, withh=1,2, . . . ,p(Fig. 2).
Figure 2– Boundaries between categories (Mousseau & Slowinski, 1998).
The preferences for each criterion are defined by pseudo criteria in which the preference thresh-olds and indifferencepj[g(bh)]andqj[g(bh)]provide intra criteria information. Thus,qj[g(bh)]
specifies the largest differencegj(a)−gj(bh), which preserves the indifference betweenaand
bhin the criteria gj and pj[g(bh)]representing the smallest differencegj(a)−gj(bh),
consis-tent with a preference fora in the criteria gj. The structure preferably with pseudo criteria
-double threshold model withpj[g(bh)]andqj[g(bh)], avoids an abrupt transition between
indif-ference and strict preindif-ference, existing a zone of hesitation, represented by the weak preindif-ference. The ELECTRE TRI constructs outranking relations S, it means, it validates or invalidates the assertion thata Sbhand(bhSa), whose meaning is “ais at least as good asbh”.
Two conditions must be verified to validate the assertiona Sbh:
• Concordance: For an outrankinga Sbh to be accepted, most of the criteria should be in
favor of affirminga Sbh.
• Non-discordance: when in concordance condition is not satisfied, none of the criteria should be opposed to the assertiona Sbh.
In the construction of S it is used a set of veto thresholds [v1(bh), v2(bh), . . . , vm(bh)],used
inconsistent with the statementa Sbh. The indexes of partial concordancecj(a,b), concordance
c(a,b)and partial discordancedj(a,b)are calculated by the expressions (1), (2) and (3) below.
cj(a,b)=
0 if gj(bh)−gj(a)≥ pj(bh)
1 if gj(bh)−gj(a)≤qj(bh)
pj(bh)+gj(a)−gj(bh)
pj(bh)−qj(bh)
,otherwise
(1)
c(a,b)= P
j∈F
kjcj(a,bh)
P
j∈F
kj
(2)
dj(a,b)=
0 if gj(bh)−gj(a)≤ pj(bh)
1 if gj(bh)−gj(a) > vj(bh)
gj(bh)+gj(a)−pj(bh) vj(bh)−pj(bh)
,otherwise
(3)
The ELECTRE TRI constructs an indexσ (a,bh)∈ [0,1](σ (bh,a), respectively) which
repres-ents the degree of credibility of the assertion in whicha Sbh,a ∈ A,h∈ B, expression (4).
The statement a Sbh is considered valid ifσ (a,bh) ≥ λ·λstarts a cutoff level such thatλ ∈
[0,5,1](Mousseauet al., 2001).
σ (a,bh)=c(a,bh)·
Y
j∈F
1−dj(a,bh)
1−c(a,bh) (4)
where,F =
j ∈ F:dj(a,bh) >cj(a,bh)
After calculating the indicesρ(k,bh)andρ(bh,k), we use a cut off levelλ ∈ [0.5,1]to deter-mine the preferably relationship with the condition:ρ(k,bh)≥λ⇒akSbh. Thus, the higher the
value ofλ, the more severe are the subordination conditions of one alternative over the border. So with ELECTRE TRI, mainly used in alternative classification problems, it seeks to assign the performance of the alternatives in one of the of predefined performance classes.
Two assignment procedures can be evaluated: Pessimistic procedure and Optimistic procedure (Mousseauet al., 2001).
• Pessimistic procedure:compares successively withbi, toi =p,p−1, . . . ,0,bh, starting
with the first profile such in whicha Sbhsays to the categoryCh+1(a→Ch+1).
• Optimistic procedure: compares successively withbi, toi = 1, 2, . . . ,p,bh, starting
Thebhis the first threshold value such in whichakSbhassigns the alternativeakto classCh+1.
If the values ofbhandbh−1are the lower and upper limits from classCh, this procedure gives to
akthe highest classCh, such in whichakmakes the valuebh−1(akSbh−1).
Moreover, the optimistic procedure compares the performance ofak successively to bi, i =
1,2, . . . ,p. Beingbhthe threshold value such in whichbhPak, must assignakto the classCh.
This procedure assigns toak the classCh, but lower, in which the upper limitbhis preferred to
ak(bhPak). The description and understanding of the ELECTRE TRI sorting algorithm requires
an additional effort, especially by the fact that this method is based on recent concepts of fuzzy logic.
Nevertheless, understanding and modeling by the ELECTRE TRI dispense the detailed descrip-tion of the classificadescrip-tion algorithm (Costa & Freitas, 2005).
3.2 Inference model of the ELECTRE TRI
While using the ELECTRE TRI, one of the greatest difficulties of the analyst is when he inter-acts with the decision maker to elicit the various parameters of preferences. The analyst must determine the values of various parameters (the profiles that define the boundaries between cat-egories, weights, thresholds . . . ), which are used to construct a model from the decision maker’s preference. Even if these parameters can be interpreted, it is difficult to attach values to them directly and have a clear global understanding of the implications that these values have for the model output. Except in some specific cases, it is not natural to assume that the decision maker can explicitly assign values to these parameters, since they are different from the natural terms to the decision maker expresses his preferences.
Mousseau & Slowinski (1998) proposed a model to infer in the parameters of the ELECTRE TRI to an analysis of the examples given by the decision maker, in other words, the holistic judgments. This approach represents the disintegration paradigm of the preferences in which aims to extract the implicit information contained in the holistic judgments given by a decision maker. The aim of this approach is to find an ELECTRE TRI model compatible with the examples given by the decision maker. The examples given relate to a subsetA∗ ∈ Ato alternatives for which the decision maker has clear preferences, that is alternatives where the decision maker can easily specify a category, taking into consideration his ratings for all criteria. The compatibility between the model of the ELECTRE TRI and examples of the assignment is understood as an ability of the ELECTRE TRI method using the inference model to reassign the alternatives from A∗in the same way that the decision maker did.
4 APPLICATION IN A WATER DISTRIBUTION NETWORK
450,000 inhabitants), which serves 100,000 active water connections, data collected from a public utility water supply.
The situation of the maintenance on the distribution network at the time of data collection can be viewed by the information about losses and volume in each region of measurement.
At first, it is verified what strategies or actions could be employed to achieve the objectives separately and some alternatives that can generate the expected result for the goals. These ac-tions are listed based on statistical data system and experience of the decision maker, such as registration information, delivered or distributed volumes (total volume from water available in the distribution networks from a city) and Macromedia (the sum from the volumes measured in each consumer unit), information equipment useful life, when maintenance or replacement should occur, areas with higher rates of leakage and assistance, information on administrative and financial conditions, information on the level of automation of the system, raising the pres-sure on networks etc.
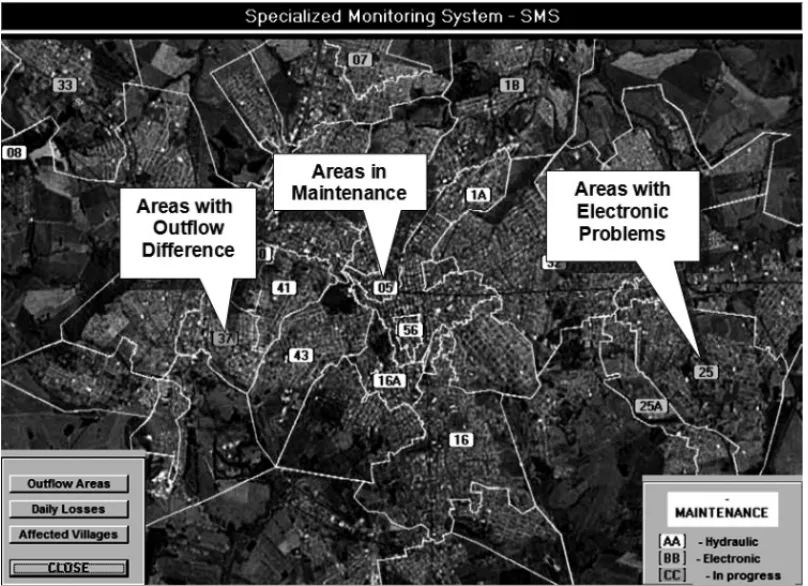
In this study, we used data from a specialized monitoring system (SMS) (Trojan & Marc¸al, 2007). This monitoring system was based on theories of artificial intelligence and provides the flow monitoring of measured areas.
The Figure 3 shows how the system makes the data collection, which will be used to implement the decision support method ELECTRE TRI.
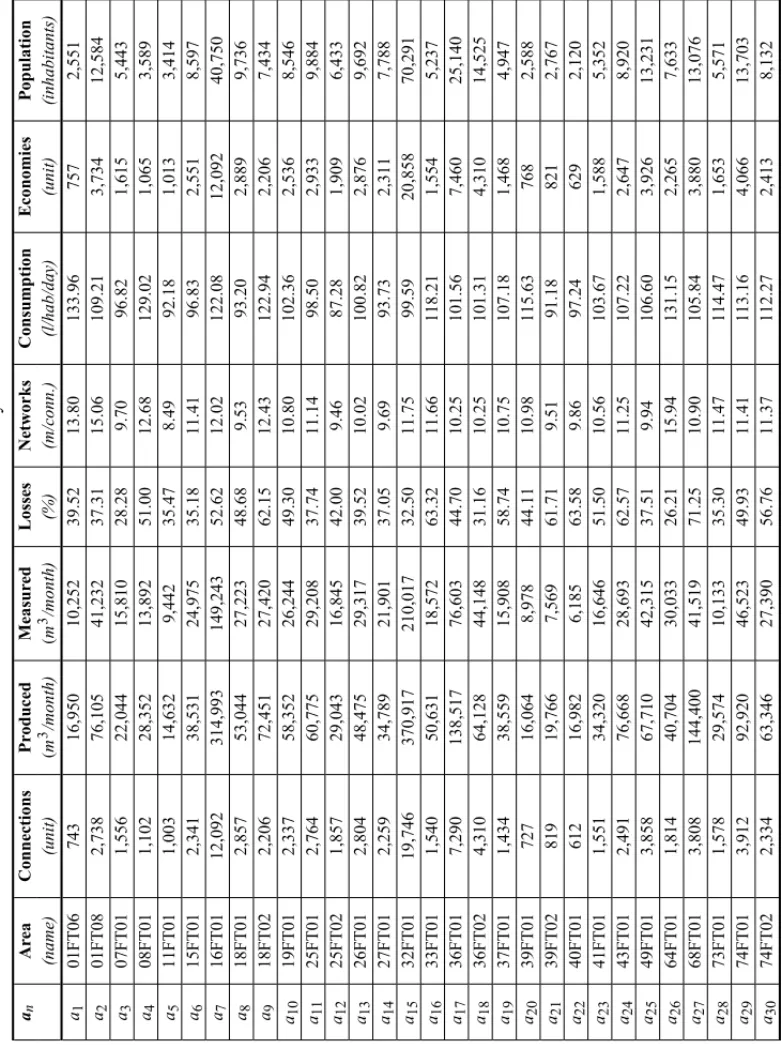
Table 2 presents a survey of relevant data generated by the SMS. These data were listed per alternative (areas of flow measurement). The areas of flow measurement were divided according to geographical features and extensions for power main line of supply.
(
At the entrance and in some cases within each defined area were installed electromagnetic flow meters which indicate the flow consumption of each one of them. This way it is possible to raise the number of connections, population, network meters and public economies, since these areas are large areas defined and tight.
To each one of them was assigned a name of reference represented by the tag: “area number
+the indication FT (flow transmitter)+the number of the measure.” For example: 01FT06=
Area 01+FT+06 measurer.
After data collection it is necessary to elicit about the characteristics needed for the classes and the maintenance actions that can be performed on alternate view to see to which class this alter-native belongs.
These characteristics are listed based on the subjectivity of the decision maker when it comes to the relevant points for each criterion.
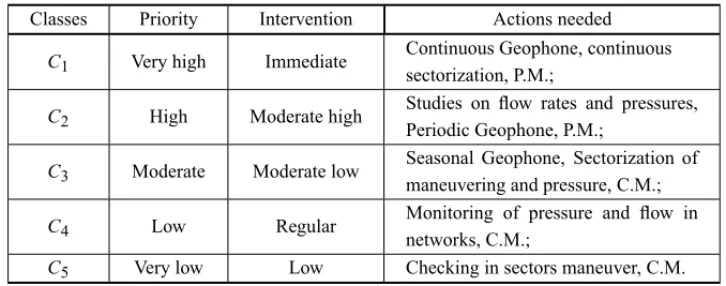
Thus, as Table 3, it is possible to reach a delimitation of maintenance actions required in each class, number of classes and their priorities as well as the appropriate moment for the interven-tion.
In this context were defined five classes with priorities: Very High, High, Moderate, Low and Very Low. Each one with its respective intervention programs and required actions.
Table 3– Description of classes by priority, strategies and actions for maintenance.
Classes Priority Intervention Actions needed
C1 Very high Immediate
Continuous Geophone, continuous sectorization, P.M.;
C2 High Moderate high Studies on flow rates and pressures, Periodic Geophone, P.M.;
C3 Moderate Moderate low
Seasonal Geophone, Sectorization of maneuvering and pressure, C.M.;
C4 Low Regular
Monitoring of pressure and flow in networks, C.M.;
C5 Very low Low Checking in sectors maneuver, C.M.
C.M.→Corrective Maintenance; P.M.→Preventive Maintenance.
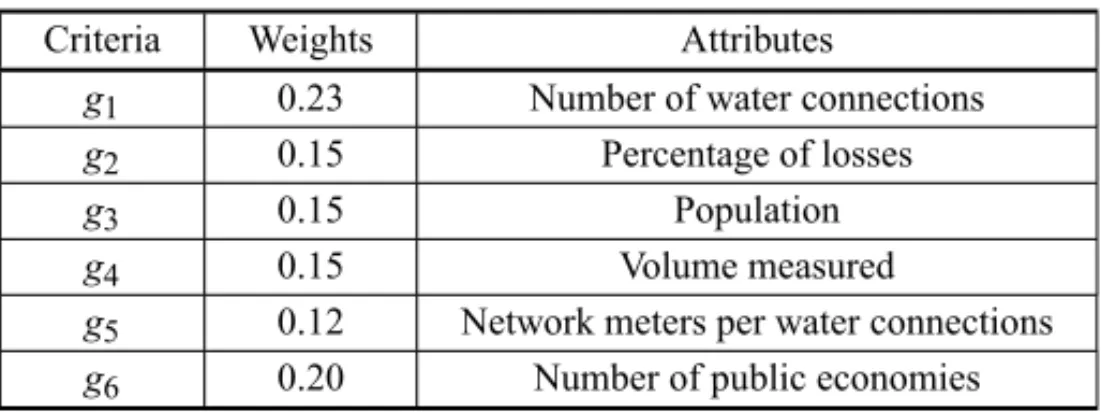
Table 4– Definition of criteria evaluation and respective weights.
Criteria Weights Attributes
g1 0.23 Number of water connections
g2 0.15 Percentage of losses
g3 0.15 Population
g4 0.15 Volume measured
g5 0.12 Network meters per water connections
g6 0.20 Number of public economies
The weights of the criteria were obtained through an elicitation process with the decision maker involved in the maintenance of water networks, in order to present the importance of each cri-terion is the vision for the analysis of the decision maker. Was considered a range [000-100] to define the alternatives performance and the occurrence of a situation within from the items considered in each criterion receives a percentage value relative to the number of items listed to examination. Only the criteriong2has the characteristic of minimizing the others are
maximiz-ing. Subsequently each criterion will have an aggregated performance and this result should be taken for the calculation of concordance and non-discordance. The considerations on thresholds of indifference and preference should be defined at this stage with the purpose of allowing small variations that are covered by these thresholds. To calculate the performance of the alternatives it was considered the withdrawal amount for each alternative in relation to the average or the maximum number of sample to the considered criteria.
When a value exceeds the average value it is assigned 100 and below the average values are represented by a relation between the average values and multiplied by 100 to calculate the value referring to the performance of the alternative against the analyzed criteria. On the criteria: losses, networks and public economist were considered the maximum value instead of the average as a relevant threshold to the calculation. Tables 5, 6 and 7 below show the develop-ment of the above steps.
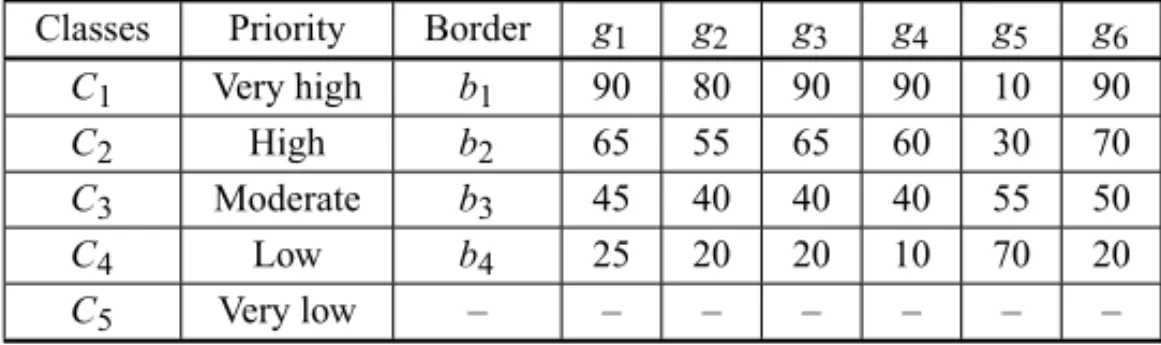
The parameters that define the regions boundaries between classes are defined in this step, as shown in Table 7.
Briefly, the limit of indifferenceqj specifies the largest difference between the value of
alterna-tiveak (denoted bygj(ak))and the standard value of a boundarybh (denoted bygj(bh))that
preserves indifference betweenak andbh(akIjbh). Moreover, the preference limit of pj
speci-fies the smallest difference between the value of alternativeakdenoted bygj(ak)and the default
standard value of a borderbh (denoted by gj(bh)) establishing the strong preference between
ak,bh(akPjbh). The relationakQjbhrepresents an intermediate situation of hesitation between
indifference and preference, called weak preference. The set of expressions (5) describes these relationships, but only one of them can occur.
akIjbh⇔ |g(ak)−g(bh)| ≤qj
Table 6– Alternatives performance – values.
Area Connections Losses Popul. Measured Nets Public econ.
g1 g2 g3 g4 g5 g6
a1– 01FT06 23 29 55 87 23 50
a2– 01FT08 85 100 52 94 100 25
a3– 07FT01 48 44 40 61 48 25
a4– 08FT01 34 39 72 80 32 10
a5– 11FT01 31 26 50 53 30 10
a6– 15FT01 73 70 49 72 76 25
a7– 16FT01 100 100 74 75 100 100
a8– 18FT01 89 76 68 60 86 30
a9– 18FT02 69 77 87 78 66 25
a10– 19FT01 73 73 69 68 75 25
a11– 25FT01 86 82 53 70 87 35
a12– 25FT02 58 47 59 59 57 15
a13– 26FT01 87 82 55 63 86 100
a14– 27FT01 70 61 52 61 69 100
a15– 32FT01 100 100 46 74 100 50
a16– 33FT01 48 52 89 73 46 15
a17– 36FT01 100 100 63 64 100 50
a18– 36FT02 100 100 44 64 100 30
a19– 37FT01 45 44 82 67 44 25
a20– 39FT01 23 25 62 69 23 25
a21– 39FT02 25 21 87 60 24 25
a22– 40FT01 19 17 89 62 19 15
a23– 41FT01 48 46 72 66 47 25
a24– 43FT01 77 80 88 71 79 15
a25– 49FT01 100 100 53 62 100 20
a26– 64FT01 56 84 37 100 67 20
a27– 68FT01 100 100 100 68 100 25
a28– 73FT01 49 28 50 72 49 20
a29– 74FT01 100 100 70 72 100 45
a30– 74FT02 73 76 80 71 72 40
Table 7– Parameters for the boundaries between classes.
Classes Priority Border g1 g2 g3 g4 g5 g6
C1 Very high b1 90 80 90 90 10 90
C2 High b2 65 55 65 60 30 70
C3 Moderate b3 45 40 40 40 55 50
C4 Low b4 25 20 20 10 70 20
Illustratively, to demonstrate the steps of calculation the ELECTRE TRI method, are considered, analyzed from theg4criteria, the value of alternativea8, the standard value ofb2border, the
indifference limit and the preference limit denoted respectively by: (a8) = 60,g4(b2) = 60; q4=4 andp4=8. Considering the above mentioned relations and their values, it is concluded
that the alternativea8is preferable to the borderb2(a8P4b2)analyzed from theg4criteria. Similar
procedure can be performed for the other the criteria, alternatives and borders.
a8I4b2= |60−60| ≤4, True
a8Q4b2=60+8≥60>60+4, False
a8P4b2= |60−60|>8, False
Thus, the alternativea8being analyzed from theg4 criteria is Indifferent to the limits of class g4(b2)and consequently may be included in this class to calculation done with other criteria
confirming this trend. To the allocation of alternatives to the categories of classification, it was considered in this experiment, the cut off levelλ=0.76, a value that gives intermediate level of strictness to examination (forλ∈ [0.5,1]). With the tabulated data and information elicited from the next step it is summarized in the application of the ELECTRE TRI method for measuring the results of the classification of areas.
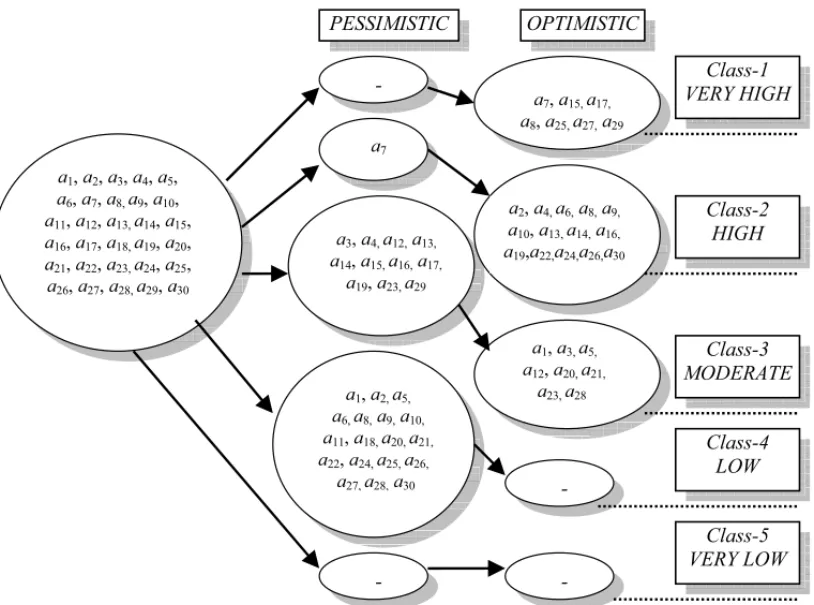
The following diagram (Fig. 4) shows the results that this study, finally presenting the classifica-tion according to the criteria listed and possible alternatives. To the applicaclassifica-tion of ELECTRE TRI it was used the software ELECTRE TRI 2.0a, available in Lamsade (Paris-Dauphine University, Paris, France).
The Figure 5 summarizes the study of the comparison, identifying the situations of incomparabil-ity and Figure 4 shows the results of the alternatives, which facilitates the analysis of the points of action by the recognition of the characteristics.
The names in question represent areas of flow measurement for the classification number (area code+FT (flow transmitter) number of measuring equipment).
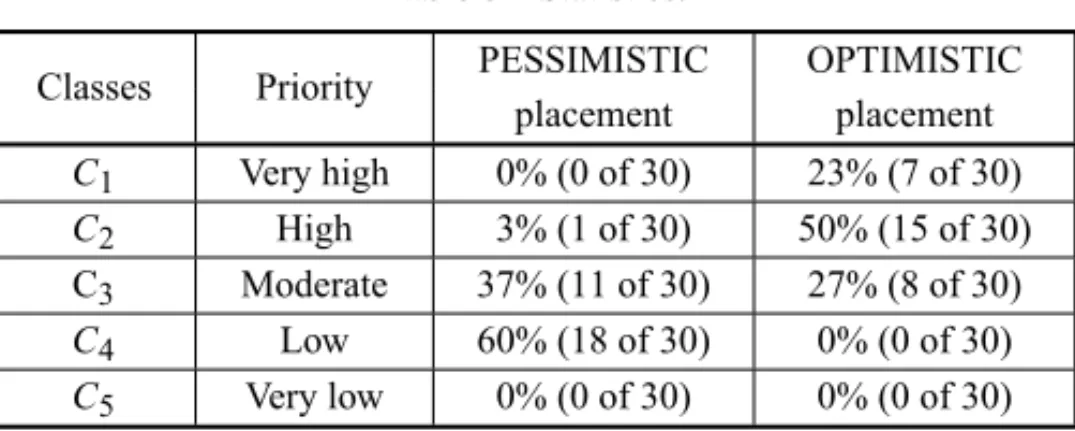
On Table 8 it is possible to visualize the statistical results of the study, presented in percentages of occurrences in each class.
Table 8– Statistics.
Classes Priority PESSIMISTIC OPTIMISTIC placement placement C1 Very high 0% (0 of 30) 23% (7 of 30)
C2 High 3% (1 of 30) 50% (15 of 30)
C3 Moderate 37% (11 of 30) 27% (8 of 30)
C4 Low 60% (18 of 30) 0% (0 of 30)
1, 2, 3, 4, 5, 6, 7, 8, 9, 10, 11, 12, 13, 14, 15,
16, 17, 18, 19, 20, 21, 22, 23, 24, 25, 26, 27, 28, 29, 30
7
3, 4, 12, 13, 14, 15, 16, 17,
19, 23, 29
1, 2, 5, 6, 8, 9, 10,
11, 18, 20, 21, 22, 24, 25, 26,
27, 28, 30
1, 3, 5, 12, 20, 21,
23, 28 2, 4, 6, 8, 9,
10, 13, 14, 16, 19, 22, 24, 26, 30 7, 15, 17, 8, 25, 27, 29
Figure 4– Classification Results by ELECTRE TRI.
5 ANALYSIS AND EVALUATION OF RESULTS
The results presented in the study, arising from the implementation of proposed model show a logical situation with some preferential areas positioned in the higher classes of the Classification and allocated most of the alternatives on the intermediate classes, which denotes a certain balance in the maintenance system. Thus actions can be focused on priority events and the constant evolution on the middle classes.
The optimistic procedure was adopted, because the optimistic (or disjunctive) assignsa to the lowest categoryCh for which the upper profilebhis preferred toa. When using this procedure
withl =1, an alternativeacan be assigned to categoryChwhengj(bh)exceedsgj(a)(by some
threshold) at least for one criterion (disjunctive rule).
Highest class, for example, where the alternatives were ranked in need of immediate intervention emerged alternativea7, which if analyzed by Table 6 shows the relevant characteristics of the
criteriag1 =100,g2 =100;g5 =100 andg6 =100, which have the largest weights defined
for classification. This indicates a preference to attend the higher priority classes.
Comparisons Summary
Figure 5– Comparisons summary.areas allocated in these classes have the lower performance criteria with higher weights. This rating indicates that these areas may be irrelevant from the perspective of prioritizing interven-tions, but they require long-term planning.
When analyzing the results of classification model it is possible to notice the delimitation, with concentrations of the important areas, the views of priorities and weights in relation to what the decision maker has set as preferred. The other areas with indifference or incomparability in relation to the classes that they belong to are naturally classified according the performance in the different criteria.
Some incomparabilities can be detected when the alternatives cannot be analyzed, since the crite-ria that defines the comparison does not show any outranking for those parameters or preferences listed by the decision maker.
6 FINAL REMARKS
decision to sort regions of water network in classes of maintenance priority, allowing reducing problems in public water supply, such as: loss, execution of maintenance actions, deployment automation, monitoring, among others. With this view it is more comfortable to make decisions, as there is the tendency for goals to be met in a more appropriate way.
The model actually allows the immediate visualization of priority classes and maintenance sector of the water distribution networks and uses this information to act quickly in situations that need to meet the priorities of maintenance. The results found in application shown that the areas classified met expectations with some minor variations.
The fact of making the preliminary classification of the priorities sector participation expedites maintenance immediately after the occurrence of leaks or situations that require immediate main-tenance on the most important areas from the perspective of the decision maker’s preferences.
This study provides the application and horizons of performance to the maintenance management systems in public water supplies.
Therefore this work complies with the goal of building a classification model of priority alterna-tives with quantitative aspects at the same time to assist in decision making on maintenance of distribution networks in a system of public water supply.
ACKNOWLEDGMENTS
This work is part of a research program funded by the Brazilian Research Council (CNPq). The authors gratefully acknowledge the valuable suggestions made by anonymous reviewers to a previous version of this paper, which have contributed to make this a better final version.
REFERENCES
[1] ALENCARLH & ALMEIDAAT. 2008. Multicriteria Decision Group Model for Suppliers Selection. Pesquisa Operacional,28(2): 321–337.
[2] ALENCARLH, ALMEIDAAT & MORAISDC. 2010. A multicriteria group decision model aggregat-ing the preferences of decision-makers based on ELECTRE methods.Pesquisa Operacional,30(3): 687–702.
[3] COSTAHG & FREITASALP. 2005. Application of Electre Tri Method for the classification of clients satisfaction. Portuguese and Brazilian Journal of Management, INDEG/ISCTE, Lisboa, Portugal, 4(4): 66–76.
[4] DAMASOVC & GARCIAPAA. 2009. Testing and preventive maintenance scheduling optimization for aging systems modeled by generalized renewal process.Pesquisa Operacional,29(3): 563–576.
[5] ELECTRE TRI 2.0A SOFTWARE. Methodological guide and user’s manual.LAMSADE Laboratory. Available at:<www.lamsade.dauphine.fr/mcda/biblio/PDF/mous3docl99.pdf>.
[6] GOMESLFA, GOMESCFS & ALMEIDAAT. 2002. Management decision making: The multicriteria approach. Rio de Janeiro,Atlas, vol. 1.
[8] HAJKOWICZS & COLLINSK. 2007. A review of multiple criteria analysis for water resources plan-ning and management.Water Resour. Manag.,21: 1553–1566.
[9] HAJKOWICZS & HIGGINSA. 2008. A comparison of multiple criteria analysis techniques for water resource management.Eur. J. Oper. Res.,184: 255–265.
[10] KARDECA & CARVALHOC. 2002. Strategic Management and Outsourcing. Qualitymark. Rio de Janeiro,ABRAMAN.
[11] LAMBERTA & HIRNERW. 2000. International Water Data Comparisons Ltd. Llandudno, LL30 1SL, UK. Losses from Water Supply Systems: Standard Terminology and Recommended Performance Measures. (IWA) International Water Association. The blue pages –The IWA information source on drinking water issues.
[12] MORAISDC & ALMEIDAAT. 2006. Water supply system decision making using multicriteria anal-ysis.Water SA,32: 229–235.
[13] MORAISDC, CAVALCANTECAV & ALMEIDAAT. 2010. Prioritization of areas of loss control in water distribution networks.Pesquisa Operacional,30: 15–32.
[14] MORAISDC & ALMEIDAAT. 2010. Water network rehabilitation: A group decision-making ap-proach.Water SA,36(4): 487–493.
[15] MOUSSEAUV & SLOWINSKIR. 1998. Inferring an ELECTRE TRI Model from Assignment Exam-ples.Journal of Global Optimization,12: 157–174.
[16] MOUSSEAUV, FIGUEIRA J & NAUX JP. 2001. Using assignment examples to infer weights for ELECTRE TRI method: Some experimental results. European Journal of Operational Research, 130(2): 263–275.
[17] OPRICOVICS. 2009. A compromise solution in water resources planning.Water Resour. Manag.,23: 1549–1561.
[18] RAJUKS, DUCKSTEINL & ARONDELC. 2000. Multicriterion analysis for sustainable water re-sources planning: a case study in Spain.Water Resour. Manag.,14: 435–456.
[19] RAJUKS & KUMAR DN. 2006. Ranking irrigation planning alternatives using data envelopment analysis.Water Resour. Manag.,20: 553–566.
[20] SILVAVBS, MORAISDC & ALMEIDAAT. 2010. A Multicriteria Group Decision Model to Support Watershed Committees in Brazil.Water Resources Management,24(14): 4075A–4091.
[21] SZAJUBOKNK, MOTACMM & ALMEIDAAT. 2005. Use of the multi criteria method ELECTRE TRI for classification of inventory in the construction.Pesquisa Operacional,26(3): 625–648.
[22] TROJAN F & MARC¸AL RFM. 2007. Study and Implement of a Specialized Monitoring System (SMS) to Orient Decisions and Reduce Losses in the Public Water Supply Systems,ICICIC – In-ternational Conference on Innovative Computing, Information and Control, Kumamoto, Japan.
[23] VINCKEP. 1992. Multicriteria Decision-Aid.John Wiley & Sons Ltd.ISBN: 0-471-93184-5.
[24] WATERPAGES. 2001. Available at<http://www.corrosion-club.com/waterfigures.htm>.