THIS REPORT WAS PREPARED BY “STUDENT’S NAME”, A MASTERS IN FINANCE STUDENT OF THE NOVA SCHOOL OF BUSINESS AND ECONOMICS, EXCLUSIVELY FOR ACADEMIC PURPOSES. THIS REPORT WAS SUPERVISED BY ROSÁRIO ANDRÉ WHO REVIEWED THE
M
ASTERS IN
F
INANCE
E
QUITY
R
ESEARCH
We reiterate coverage of Deutsche Lufthansa AG with
a HOLD recommendation and a YE16 PT of €16. The Group has
a solid position in the airline industry, as well as a strong global network and a successful track record on the European market.
Rebranding of Eurowings still taking place. Gradually,
short-haul and medium-haul routes outside the main hubs are being transferred from Germanwings to Eurowings.
Cost efficiency and margin optimization are expected
to be delivered in year-end 2016. Structural reorganisations,
together with the expansion of individual business segments and its portfolio, will lead the Group towards profitable growth.
Fierce competition from LCC developments and Gulf carriers is expected to shrink Lufthansa’s average yields by
0.4% over the period 2016-2019.
Restrict Capacity discipline, together with growing global air traffic demand, are expected to foster a sustainable increase in
load factors by c.1% for the period 2016-2019.
Negotiations with the unions will continue in the years ahead. The strike costs are expected to be higher than €230Mn at year end 2015. However is uncertain at what extent it will continue to impact Lufthansa’s performance from 2016 onwards.
Company description
Deutsche Lufthansa AG is a Star Alliance Member, being the
world’s leading aviation group with a total of about 540 subsidiaries worldwide. The group operates through Passenger Airline Group, which is the main value driver, but also through its service segments Logistics, Maintenance Repair and Overhaul (MRO) and Catering segments, holding a leading position in their respective markets.
“
D
EUTSCHE
L
UFTHANSA
AG
”
C
OMPANY
R
EPORT
“
A
IRLINES INDUSTRY
”
8
J
ANUARY2016
S
TUDENT
:
J
OANA
F
ILIPA
S
ANTOS
[email protected]
Pinning Hopes on “New” Eurowings
Challenging environment pushing pricing down
Recommendation: HOLD
Price Target FY16: 16.00 €
Price (as of 8-Jan-16) 15.16 €
Reuters: LHAG.GE, Bloomberg: LHAG:GR
52-week range (€) €10.25-€15.53
Market Cap (€Bn) €7.028
Outstanding Shares (m) 464,538,750
YTD Price Return 4.15%
Source: Bloomberg
Performance
Source: Bloomberg
(Values in € millions) 2014 2015E 2016E
Revenues 30,011 30,505 31,976
EBITDA (Adjusted) 2,092 2,632 2,842
Net Profit 55 436 371
EPS (x) 0.12 0.94 0.80
P/E 116.8 15.5 20.1
Net Debt/EBITDA (x) 2.1 x 2.6 x 2.8 x
EV/EBITDA (x) 6.8 x 6.1 x 6.4 x
“DEUTSCHELUFTHANSAAG” COMPANY REPORT
Table of Contents
EXECUTIVE SUMMARY ... 3
INVESTMENT CASE ... 3
KEY VALUE DRIVERS ... 3
CATALYSTS/RISKS ... 3
COMPANY OVERVIEW ... 4
CORPORATE STRUCTURE ... 4
SHAREHOLDER STRUCTURE ... 5
MACROECONOMIC OVERVIEW ... 6
GDP ... 6
OIL PRICES ... 7
EXCHANGE RATES ... 8
ENVIRONMENTAL REGULATION ... 8
AIRLINES INDUSTRY ... 9
GLOBAL MARKET OUTLOOK ... 9
GERMANY ... 10
BUSINESS SEGMENTS ...11
PASSENGER AIRLINE GROUP ... 11
Fleet ... 11
Strategy ... 12
Low Cost Carriers (LCCs) in Europe ... 13
Persian Gulf Carriers Competition ... 14
Performance ... 15
Strikes ... 16
FINANCIALS & FORECAST ...19
KEY VALUE DRIVERS ... 19
ASK ... 19
RPK ... 19
LOAD FACTORS ... 20
FUEL COSTS ... 21
AVERAGE YIELDS ... 22
OTHERS - PENSION LIABILITIES ... 22
VALUATION ...22
SENSITIVITY ANALYSIS ...24
APPENDIX ...
ERROR! BOOKMARK NOT DEFINED.
DISCLOSURES AND DISCLAIMER ...
ERROR! BOOKMARK NOT
“DEUTSCHELUFTHANSAAG” COMPANY REPORT
Executive summary
Investment Case
Deutsche Lufthansa AG is the largest European airline with a current market
capitalisation of €7.028Bn, and intends to become the first five-star airline in
the West, focusing on distinct and tailored customer service. Passenger Airline
is by far the most important segment for Deutsche Lufthansa (75% of total revenues in 2014), that aims at increasing the weight of other business segments within the Group. However, such is not expected in the foreseen future.
Maintenance, Repair and Overhaul (MRO) and Catering are forecast to be the
fastest growing business segments, with a 2015-2019 CAGR of 4.4% and 5%, respectively. Nevertheless, Passenger will still hold the highest proportion of total
Group’s revenues (76% in 2019).
Key Value Drivers
Following company restrict capacity discipline, available seat kilometres
(ASKs) are forecasted to grow 3% p.a. Lufthansa is renewing the entire fleet
and replacing older aircraft in order to increase its flexibility to better respond to fluctuations in demand. The CAPEX is forecasted to reach €2.5Bn in 2016.
The Lufthansa Group’s fleet orders comprises a total of 263 aircraft, with a list
value of €37Bn, which are expected to be delivered by 2025. As for revenue passenger kilometres (RPKs), the fastest markets are projected to be
America, growing at a rate of 4.3%, and Asia/Pacific that is expected to grow at
a rate of 5.1%. However, we remain cautious on Asia/Pacific market due to increasing competition from Gulf carriers. Middle East/Africa markets will see a drastic decline given competition of Persian Gulf Carriers. We believe Lufthansa will be unable to handle such competition on those markets, as it lacks the geography and mainly the cost structure. Further, Lufthansa will also face strong competition on its European market as it is highly exposed to LCCs activity, mainly in Germany. Consequently, average yields are forecasted to shrink at a 2015-2019 CAGR of 0.44%.
Catalysts/Risks
Oil prices are forecasted to remain at low levels and fuel costs per ASK are
projected to be at €2.43 cents in 2016. From 2016 onwards, prices are
expected to increase slightly, but only in 2025 will return to 2013 levels. The slump in oil prices will consequently lead to lower average fares across the airline industry.
ASK forecasted to grow 3% p.a
Comments on the main text… Tailwind from lower oil prices MRO & Catering will be the fastest business segments in the period 2015-2019
Severe competition from Gulf carriers is expected in Middle East/Africa
Average yields are projected to depress 0.4%
“DEUTSCHELUFTHANSAAG” COMPANY REPORT
Negotiations with collective bargaining partners will continue to have an
impact on Group’s earnings. Lufthansa appears to be far from reaching an agreement with Unions upon transitional benefits and pension schemes, thus
being uncertain to estimate the adverse effects on company’s accounts.
Lufthansa displays one of the highest labour cost per unit of the industry1.
Further developments upon abovementioned factors will lead our price target to be revised.
Company Overview
Deutsche Lufthansa AG is a global aviation group that started its activity in 1926 and is headquartered in Cologne, Germany. It is considered as the largest European network carrier, with a market capitalisation of €6.4 Bn,at year end 2014, and 118,781 employees. The company currently operates in Europe, North America and Latin America, Africa, Middle East and Asia/Pacific and it seeks to increase its international footprint either by strengthening existing partnerships or
making new ones. The Group’s subsidiaries and equity investments amount to 540, which are spread throughout the world.
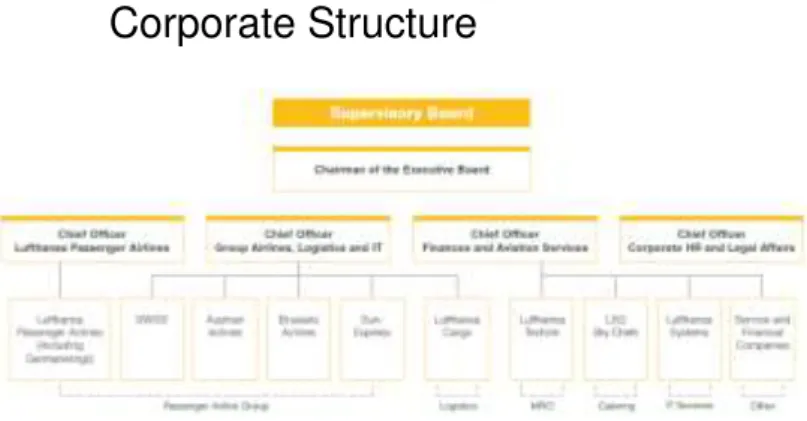
Corporate Structure
The Lufthansa Group carries its activity in five business segments, all of them holding a leading market position, which are: passenger air traffic through Passenger Airline Group, Logistics through Lufthansa Cargo, MRO through Lufthansa Technik, Catering through Lufthansa Sky Chefs and, up to 2014, IT Services through Lufthansa Systems. The portfolio of the Passenger Airline comprises Lufthansa Passenger Airlines (including Germanwings), Swiss, Austria Airlines and also the investments in Brussels Airlines and Sun-Express, a Turkish based airline partly owned by Lufthansa (for simplification we refer to company as Lufthansa). In what concerns to corporate structure, Deutsche Lufthansa AG
1
Unit Labour Costs in 2014
Deutsche Lufthansa AG (€62) vs Ryanair (€49) Strike costs difficult to predict
“DEUTSCHELUFTHANSAAG” COMPANY REPORT
is the parent company and all its individual segments are managed independently, with the exception of Lufthansa Passenger Airlines since they have their own responsibility centre.
Regarding revenues breakdown by segment, in financial year 2014, the Passenger Airline Group accounted for 75.4% of Group revenues, followed by Lufthansa Technik (8.9%), Lufthansa Cargo (8%), Lufthansa Sky Chefs (6.7%) and Lufthansa Systems, which is only accounted for 0.9% of Group revenues. As can been drawn, Passenger Airline Group is a core segment for Lufthansa, having an outstanding market positioning in Europe, largely driven by its leading position in Germany, which is its home market, where it had a share of traffic revenue of about 42% in 20142. The network carrier has recorded, in fiscal 2014,
both the highest number of passengers carried as well as the highest revenues in Europe. The Group has a fleet of 615 aircrafts and operates a route network of about 271 destinations in 107 countries.
Shareholder Structure
Deutsche Lufthansa AG has 464,538,750 shares outstanding with a par value of
€2.56 that are listed in the Frankfurt Stock Exchange’s Prime Standard. The shares are traded on Frankfurt, Stuttgart, Munich, Hannover, Dusseldorf, Berlin and Hamburg stock markets but also through the electronic system Xetra and through the Sponsored American Depository Receipt Program (ADR) in USA for dollar-denominated assets. The group is among the 30 largest German companies being currently a member of DAX-30.
Regarding structure evolution, Lufthansa’s shareholder structure has not suffered significant changes over the financial year 2014. As required by Deutsche Börse Group, the free float is 100% and, according to the German Aviation Compliance Document Act, the company is also required to be under German or European control. Hence, at year end 2014, German investors held 65.5% of the share
capital, comparing to 62.4% in 2013, followed by USA shareholders that
accounted for 10.5% of the share capital, comparing to 11.5% in the previous year. Lufthansa shares are held by both institutional and private investors, representing 60.3% and 39.7% of the share capital in 2014, respectively. The main institutional shareholders are Templeton Global Advisors Limited, Deutsche Asset & Wealth Management Investment GmbH and BlackRock, Inc. Institutional shareholder structure have slightly changed over the past twelve months, mainly due to BlackRock’s stake reduction from 5.43% in 2013 to 2.96% in 2014, making Templeton Global Advisors the largest investor in the same year with
2Source: Euromonitor International. Market share based on revenues (approach followed throughout the report unless stated
otherwise)
Figure 2. Business Segments (% of Revenue)
75.8% 8.8%
8.1% 6.4%
Passenger Airline Group Logistics MRO Catering
Source: Company’s Data
Figure 3. Shareholders’
Nationality
Cayman Islands; 3.30%
Germany; 65.50% Luxembourg;
3%
Other; 9% Saudi Arabia;
3.50%
UK; 5.20% 10.50%USA;
“DEUTSCHELUFTHANSAAG” COMPANY REPORT
a stake of 5.00%. Deutsche Asset & Wealth Management Investment’s stake also decreased throughout the year, holding 2.95% of the shares in 2014, compared to 4.75% in 20133. During the Annual General Meeting of 2014 the
Execution Board was authorized, under Supervisory Board approval, to increase the share capital by issuing new shares to employees for payments in cash (Authorised Capital B). Accordingly, a capital increase of €4,345,000.96 was pursued, excluding existing shareholders’ subscription rights, and 1,697,266 shares were issued. In 2014, Deutsche Lufthansa AG also bought back 335,993 of its shares at a price of €12.12. Furthermore, no treasury shares were held at year end 2014 on the balance sheet.
Lufthansa’s share had a disappointing performance in financial year 2014, highlighted by the fall in price of c.10% and a shareholders’ total return of -7.4%. The share price reached its maximum of €20.26 on April and its minimum of
€10.88 on October, closing the financial year at €13.83, thus having underperformed the DAX Index by 2.7%.
As regards to Lufthansa’s dividend policy, throughout the financial year 2014, dividends distribution was not possible, due to the negative net income achieved by the Group under German commercial law. For financial year 2015, Lufthansa has reviewed and established a new dividend policy. A dividend payout ratio of 10% to 25% of EBIT will be made, if net profit of Deutsche Lufthansa AG, calculated under the German Commercial Code, is enough. The new policy will be effective for dividends payments due in fiscal year 2016.
Macroeconomic Overview
Airlines are exposed to macroeconomic risks and opportunities that require active and efficient management from companies within the industry.
GDP
Airline passenger traffic is closely tied to both GDP growth and GDP per capita. During fiscal year 2014, the global economy grew 2.6%4 despite growth vary widely among countries and regions.
As far as forecasts are concerned, global GDP is estimated to grow 2.8% in 2015 before picking up to 3.3% in 2016, reaching 3.2% in 2017. GDP growth developments reflect a slightly recover from advanced economies and a downturn in emerging markets and developing economies. The decline in oil
3As of 28 December 2015: i) German investors held 74.9% of the shares
ii) Templeton Global Advisors Limited (5.00%); Deutsche Asset & Wealth Management Investment GmbH (3.19%); BlackRock, Inc. (3.09%)
4
Source: World Bank, Global Economic Prospects as of June 2015 (Constant 2010 US Dollars) Figure 5. GDP Growth
-0.5% 0.5% 1.5% 2.5% 3.5% 4.5% 5.5%
2012 2013 2014 2015 2016 World
United States Euro Area Japan Emerging Market & Developing Economies Germany
Source: IMF
Figure 4. Institutional Investors
5.00% 4.75%
5.43%
5.00% 2.95% 2.96%
Templeton Global Advisors Limited Deutsche Asset & Wealth Management Investment
GmbH BlackRock, Inc.
2014 2013
“DEUTSCHELUFTHANSAAG” COMPANY REPORT
prices together with US dollar strength are projected to have a considerable impact on those economies, which are expecting a decrease in capital flows as well as exchange rates pressures. China’s economy will slow down to 7.1% in 2015 followed by 6.9% in 2017, due to overcapacity in core sectors together with a weaker demand. On the other hand, fiscal neutral policy as well as greater household income and positive unemployment rate developments will foster
United States economy, which is expected to grow 2.7% in 2015 followed by a
2.8% grow in 2016. The Euro Area is projected to increase 1.5% in 2015
picking up to 1.7% in 2016-2017, driven by decrease in oil prices, low interest rates and euro depreciation. Further, Japan will reach a positive growth of c.1%
in 2015 before picking up to 1.7% in 2016-2017, driven by expansionary
policies.
Looking further to Germany, the economy grew 1.6%5 in 2014 on the grounds of
improved labour market conditions as well as robust private consumption. The unemployment rate had decline from 6.9% in 2013 to 6.7% in 2014, which had foster the consumer spending, thus leading private consumption to rise 1% over the same period. In what forecasts are concerned, German economy is expected to evolve positively. Real GDP is projected to grow 1.5% in 2015, picking up to 1.6% in 2016, to further reach 1.3% growth in 2020. The inflation rate is estimated to be 1.2% in 2016 and 1.9% in 2020, slightly higher than what is projected to the Euro Area (1.7% in 2020). A decline in demand from emerging markets is expected to impact exports in 2015, slowly recovering in 2016-2017.The low unemployment rate are expected to remain in the foreseen future, reaching record low values. Together with the recent increase in salaries in Germany, low oil prices and low interest rates, those developments are expected to strengthen private consumption. The abovementioned macroeconomic factors are likely to affect the propensity to travel, which is also predictable to follow the positive trend.
Oil Prices
The oil prices scenario has been quite favourable for airlines industry and has positively impacting the oil-importing economies. Despite oil prices risks being effectively managed by the bulk of airlines through its hedging policies, fuel costs still accounts for 25%6 of airlines’ operating costs,thus having a considerable
impact on their performance. Considering the current oil prices scenario, the significant shrinkage on Brent price is likely to have an impact on the fares charged by airlines (leading them to go down), which consequently will influence
5
Source: International Monetary Fund (IMF) –“World Economic Outlook: Adjusting to lower commodity prices” (October 2015)
6 Source: Bloomberg as of November 2015
Aircraft Fuel (% of Sales): Ryanair (35.23%); Air Berlin (24.72%); EasyJet (25.5%); Delta Airlines (28.90%); Air France (26.59%) Figure 6. Brent Crude Prices
Source: Bloomberg
“DEUTSCHELUFTHANSAAG” COMPANY REPORT
demand. Intense competition in the market allows companies to pass on to consumers the cost reductions and efficiency improvements. As such, a proper analysis is required.
The average Brent spot price fell from US$108.56/bbl7 in 2013 to US$98.89/bbl
in 2014. The average spot price is expected to reach US$53.82/bbl at the end of 2015 to further increase in 2016 until 2020, where the price is estimated at US$89.75/bbl (in nominal terms). It is worth mention that in August 2015, the oil prices fell below US$40/bbl for the first time in six years and only in the next decade (2025) prices are expected to return to their 2013 levels. The slump in oil prices is mostly supported by US dollar appreciation, weak global demand and
solid production in OPEC’s countries, United States and Russia. In addition, supply might increase further given the international agreement with Islamic Republic of Iran.
Exchange Rates
The declining in oil prices has been reflected into significant exchange rates depreciation, in particular for oil-exporting economies with floating exchange rates. European airlines are commonly affected by exchange rate movements against US Dollar. For the purpose of this report and given Lufthansa exposure to exchange rate fluctuations of EUR against US Dollar, Swiss Franc, Japanese Yen, Chinese Renminbi and pound sterling our brief analysis will focus on these currencies, above all on EUR/US Dollar developments.
In fiscal year 2014 the US Dollar remained stable (+0.1% yoy) while Swiss franc appreciated against the EUR (1.3% yoy) as well as the pound sterling, which appreciated by 5.1% yoy against the EUR. On the other hand, Japanese yen depreciated 8.4% yoy and the Chinese renminbi had a slightly decrease (-0.1% yoy). During the first half of 20158, between March and August, the EUR
appreciated 3.7%, the US Dollar 2.3% while the Japanese yen depreciated. The forward EUR/USD is expected to be at 1,07029 (1Y), EUR/CHF at 1,0740,
EUR/JPN at 129,75 and EUR/GBP at 0,7101.
Environmental Regulation
The strict regulatory environments to which airlines are subject have significant impact on worldwide carriers. Currently, airlines are ever more being pressure towards climate protection by increasing fuel efficient consumption and using
7 Source: Commodities price forecasts by EIA (Energy Information Administration): Brent Spot Average, Brent Spot Average
(nominal) and Brent Spot (2013 US$) estimates
8Source: World Economic Outlook, October 2015 - International Monetary Fund (IMF)
9
“DEUTSCHELUFTHANSAAG” COMPANY REPORT
alternative fuels with lower CO2 levels. Further, Governments are also establishing noise-related policies and air traffic taxes.
Globalization and increasing international trade has led to progressive market liberalization in airlines industry that until now has been considered over protectionist. If on one hand, these developments may have positively contributed to airlines’ growth in international markets, on the other hand they may also adversely impact airlines. In fact, actions taken by stated-owned companies in Persian Gulf have been severe criticized and calling into question the European competition regulation.
Airlines Industry
Global Market Outlook
The Global Airline Industry saw a significant improvement in profitability during the fiscal 2014. Net profits had increase from $10.6Bn10 in 2013 to $16.4Bn in
2014, or a 55% increase yoy. Overall, favourable development of economic
conditions foster air traffic growth while fuel prices decline led average fares to
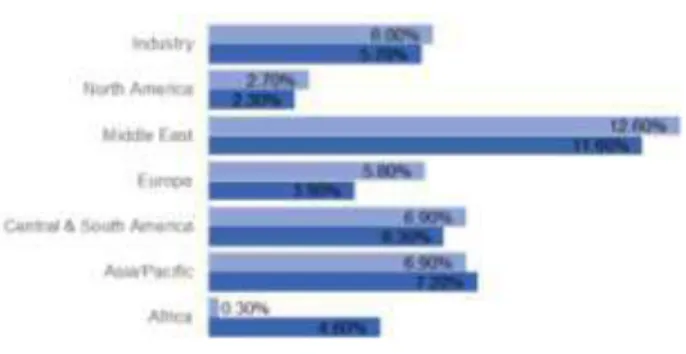
drop 3% yoy in 2014. Global air traffic demand, measured by Revenue
Passenger Kilometres (RPKs), grew at a rate of 6 %, highlighting some variances among regions. Middle East was the fastest market, growing at a rate of 12.6%, followed by Latin America and Asia/Pacific, which expanded 6.9%, while Africa only grew 0.3%.
Passenger load factor in 2014 reached 80%, as a consequence of air traffic growth and capacity management. Average yield fall 4.2% yoy in 2014 due to fuel prices decline and strong competition. Fiscal 2015 is expected to be a quite favourable year for the airline industry, as they will continue to benefit from low fuel prices as well as a strong increase in demand. Regarding long-term perspectives (2015-2034), airline passenger traffic (RPKs) is forecasted to grow 4.9%, with regional variances remaining. World traffic growth is closely tied to
10
Source: IATA Mid-year Report as of June 2015
Net profits of Global Airline Industry reached $16.4Bn in 2014
Figure 8. RPKs growth per region
“DEUTSCHELUFTHANSAAG” COMPANY REPORT
GDP growth, as such, is worth to mention that RPKs growth is expected to outperform GDP growth (3.1%). Asia-Pacific will be by far the fastest market, with an expected annual growth of 6.1%, largely driven by China’s traffic growth of 6.6%. Moreover, traffic is forecasted to grow in 6% in Latin America, 6.2% in Middle East, 5.7% in Africa, 3.1% in North America and 3.8% in Europe, outstanding low-cost and Middle East carriers’ presence as well as the need to shift long-haul capacity to more profitable routes.
Germany
The aviation industry in Germany had expand 2.1% in fiscal 2014 to €21.74Bn11,
boosted by an increase in travel flows that consequently had pushed up demand. In addition, as it happened with the majority of worldwide airlines, lower oil prices were also a tailwind for German airlines. Average fares went down and flying became more affordable. Despite favourable growth, the airlines in Germany grew at a slower rate than airlines in Western Europe (+3.8% yoy). Competition remain intense in Germany and airlines are increasingly susceptible to share loss. At 2014 year-end, Deutsche Lufthansa and Air Berlin together, had more than 60%12 of market share. However, these companies have been experiencing
a decrease in market share since 2011 that has been captured by smaller players, like Thomas Cook Group and SunExpress. Deutsche Lufthansa and Air Berlin are engaged on schedule flights while Thomas Cook and SunExpress focus on charter flights. German carriers are still highly valued in their domestic market as they provide high quality services and have an attractive route network. Over the course of the year, 61% of the total passengers were carried by scheduled airlines, 26% by low cost carriers and only 13% were carried by charter airlines. Further, in what distance is concern, 16% of the passengers were carried throughout long-haul routes, which clashes with the 84% of passengers that were carried in short-haul routes. Online sales are becoming an important channel in the industry13 and reached around €13Bn in fiscal 2014,
which can be an opportunity to exploit at the future by market players. The German market is still characterized by consolidation, however, strategic alliances are becoming more attractive alternatives14. Regarding market
projections, German airlines are forecasting a stable growth from fiscal 2015 onwards. Competition is expected to remain intense, as such, in order to keep a
11Source: Euromonitor International
12
Retail Value RSP – market share based on revenue
Deutsche Lufthansa AG (44.3% in 2011 vs 42.50% in 2014); Air Berlin Plc & Co Luftverkehrs KG ( 18.8% in 2011 vs 17.4% in 2014); Thomas Cook Group Plc (6% in 2011 vs 7.7% in 2014); SunExpress AS (3.2% in 2011 vs 4.3% in 2014)
13
Online Sales Value as a % of total value: 59% in 2013; 61% in 2014 14
“DEUTSCHELUFTHANSAAG” COMPANY REPORT
sustainable market position, airlines should focus on tailored services and keep prices low.
Business Segments
As aforementioned, Deutsche Lufthansa AG is engaged in scheduled passenger carrying, logistics, MRO, Catering and IT Services through specialized companies that are run independently. Nevertheless, all the business segments are within Airlines Industry being their performance strongly impacted by market developments. As of beginning 2015, IT Systems segment was discontinued as IT infrastructure unit were sold to IBM. Consequently, Lufthansa will now outsource its IT Services to IBM which enables the access to advanced technology at a lower cost.
Passenger Airline Group
Passenger Airline Group is by far the most important business segment within Deutsche Lufthansa AG. In this segment are included Lufthansa Passenger Airlines (including Germanwings), Swiss, Austrian Airlines and equity investments in Brussels Airlines, JetBlue and SunExpress. The Passenger Airline Group has its main hubs in Munich, Frankfurt, Zurich and Vienna, and its solid market position and know-how allows benefiting from significant synergies.
Fleet
“DEUTSCHELUFTHANSAAG” COMPANY REPORT
land. Overall, this can be costly and to avoid such complexities, the majority of low-cost carriers has adopting the strategy to operate only one type of aircraft. Accordingly, the company aims at implement a standardized fleet for the New Eurowings, comprising the Airbus A320 model.
In the year end 2014, the company had 263 aircraft on order to be delivered by 2025. The fleet order was valued at €37Bn (list value) and mostly comprises aircraft from the A320 new family and Boeing 777, which are larger and more fuel-efficient. The delivery of Airbus A320, which started in 2015, is expected to continue from 2016 onwards and the delivery of new Bombardier C-Series will take place in the period 2016-2017. The first A350 is also expected to be delivered in the end of 2016. This strong investment in long-haul fleet reflect the intention to focus on high yield markets.
Strategy
Deutsche Lufthansa AG is Europe’s airline market leader that operates on schedule, short-haul and long-haul routes. It also holds a leading and distinct position in German airline market both in terms of revenues and number of passengers carried. During 2014, excluding Germanwings and Eurowings, Lufthansa carried about 39 950 000 passengers while its main competitor in Germany, Air Berlin, carried 31 716 000 passengers15. Further, the company
aims at increase its market share worldwide and keep its positioning in the European market through its strategic plan “7to1 - Our Way Forward” that focus on seven fields of actions driven to customers, employees and shareholders. It also aims at become the first private five star airline in Europe and the West. In order to achieve such goals, Lufthansa has already put in place some strategic actions. In late summer of 2015 Lufthansa finished the modernisation and implementation of the new First, Business and Premium Economy Class, introduced wireless in some routes and also tailored services as restaurant. The company believes that those actions will increase customers’ perception of “value
for money” and positively impact its reputation, leading to profit margins’ optimization. Due to its positioning, by providing highly customised services and focusing on highly profitable segments, Lufthansa is still able to charge a price premium16. In an attempt to cover all market segments, Deutsche Lufthansa also
has Eurowings and Germanwings, operating under its brand, established as low-cost carriers. However, due to LCCs competition and high low-cost base, the Group is undertaking some strategic decisions, namely rebranding Eurowings, which is
further analysed on the “LCCs in Europe” section. This decision also comes in a
15
Source: Euromonitor International 2015
“DEUTSCHELUFTHANSAAG” COMPANY REPORT
time that Germanwings’ reputation and image was damaged by the crash on March 2015, caused by the company’s pilot.
Further, in an attempt to refocus its commercial strategy and to improve ancillary revenues, Lufthansa had decided to levy a distribution cost charge (DCC) of 16€ for all bookings made through global distribution channels (GDS). This surcharge became effective in September 2015 and customers will not be charged if they book directly on the airlines websites.
In addition, due to market fragmentation, airlines are being driven towards consolidation and M&A. Passenger Airline Group keeps benefit from its strong and extensive global network. As part of its strategy, Lufthansa establish partnerships through both joint ventures and alliances in order to capture market opportunities and overcome threats, which leads to the strengthening of its global competitive position. Those alliances and partnerships allow expansion of route network by entering into markets where Government’s restrictions are strict and where airlines, operating by themselves, wouldn’t be able to do it. Moreover, they also offer the possibility to coordinate flight schedules, thus leading to capacity and demand optimization. At a greater extent, when alliances involve strong players, they are able to prevent new competitors to enter into the market, pulling up barriers to entry. In North America, the Group participates in a joint venture with United Airlines and Air Canada. On routes to Japan and China, a partnership with ANA and Air China were established and recently, on routes between Europe and Southeast Asia a revenue sharing joint venture were signed with Singapore Airlines.
All in all, Deutsche Lufthansa AG aims at becoming the first five star airline with focus on offering a high quality and tailored service to its customers. In order to achieve it, the company will continue to improve its global network and implement measures towards cost efficiency and margins’ optimization.
Low Cost Carriers (LCCs) in Europe
“DEUTSCHELUFTHANSAAG” COMPANY REPORT
To overcome the challenged competition coming from LCCs, Lufthansa has carefully decided to change and renew its existing brand Eurowings and to implement a new concept. Up to now Eurowings operated as a regional carrier and Germanwings were considered as the low-cost carrier of the Group, being responsible for European point to point operations. However, Germanwings’ cost base is not being sufficiently competitive as labour costs are still too high, since the collective agreements are the same of those in Lufthansa full service carriers (FSC). As such, the establishment of Germanwings did not avoid the Union’s
involvement that the Group was facing with Lufthansa’s FSCs. Following the
rebranding, Eurowings will be now the Group’s low-cost carrier that will operate in the domestic, regional and international market. The new brand will take over some short and medium-haul routes of Germanwings but it will also be a pioneer, by offering long-haul flights at lower cost. This will enable the Group to have a competitive advantage over most LCCs, since they have not yet enter into this field.Eurowings long-haul routes are Dubai, Thailand and perhaps USA.
Deutsche Lufthansa AG has been hurt by LCCs operations in the European market and such impact is projected to be even greater in the years ahead. Ryanair announced that it aims at increase its capacity on Lufthansa’s home market by 2015/2016. Currently, Ryanair holds 10.2% of European market’s
total capacity, 4.7%17 in Germany, and is forecasted to climb 40% (yoy) in
winter 2015/2016. Ryanair continues to be the lowest cost airline operator in Europe and this capacity investment aligned with its tailored customer offers entails significant risk to Lufthansa. In fact, in fiscal 2014, Deutsche Lufthansa
presented unit costs (measured as costs per Available Seat Kilometres – ASKs)
of €8.8 cents18 (€9.2 cents in 2013) whereas Ryanair had unit costs of €5.1
cents (€5.6 cents in 2013), which is 73% lower. Despite operating through the
new brand Eurowings, we believe that compete with Ryanair and other low-cost carriers in the European market may become a real challenge to Lufthansa.
Persian Gulf Carriers Competition
In addition to LCCs, the rising competition from state-owned airlines in the
Persian Gulf is starting to jeopardize European carriers’ performance, mainly on
long-haul routes between Europe and Asia by providing services from Europe to destinations like Southeast Asia and India. Gulf carriers benefit from its favourable geography (between Europe, Asia and Africa), that is leading to
17
Source: Centre for aviation (CAPA)
Lufthansa’s share of seats in Germany (31.9%); AirBerlin (12.6%); Germanwings (9.2%); EasyJet (3.2%)
18Source: Company’s Data & Analyst’s estimates
Unit Cost (CASK) in 2014, excluding fuel: Air Berlin (€5.79 cents); Air France-KLM (€6.93 cents); EasyJet (£3.39 pence); Delta Airline ($9.16 cents)
Figure 9. Top 10 airline on direct Western Europe-South East Asia Routes
Rank Airline Share of seats 1Thai Airways 24.6% 2Singapore Airlines 22.5% 3Malaysia Airlines 7.9%
4KLM 6.3%
5British Airways 6.1% 6Lufthansa 5.6% 7Vietnam Airlines 5.1% 8Air France 4.2% 9Finnair 3.9% 10EVA Air 3.2%
“DEUTSCHELUFTHANSAAG” COMPANY REPORT
traffic’s aggregation at their hubs, but also from its cost bases. Passenger Airlines Group is also being affected by Gulf carriers’ activities and as a result the yields in the Asian markets are starting to depress.
Recently, Lufthansa has established a revenue sharing joint venture with Singapore Airlines (SIA) in an attempt to respond to Gulf carriers’ competition. This joint venture will mainly involve routes from Germany and Switzerland to Singapore. Regarding market share on Western Europe-Southeast Asia
routes, Lufthansa and Singapore Airlines hold a 13%19 share of passengers
flown while Emirates holds a share of 12% and Qatar and Etihad hold a share
of 27%. This joint venture will indeed strengthen Lufthansa’s positioning in the
Asian market but is considered to be more favourable to Singapore than for Lufthansa. SIA is ranked as the second airline with more share of seats on Western Europe-Southeast Asia routes while Lufthansa is only the sixth. Further,
Singapore is the 11th ranked international destination for Lufthansa while
Germany is the 4th international destination for SIA.
All in all, competition from Persian Gulf carriers will are likely to affect Lufthansa’s performance as it is expected to lead to a decline in air traffic demand and capacity more pronounced in Middle East/Africa routes.
Performance
Over the course of 2014, the Passenger Airline Group has carried roughly 106 million passengers which correspond to an increase of 1.3% comparing to 2013, where the number of passengers carried was 104.6 million. As regards to revenue passenger kilometres (RPKs) it had also climb 2.4% yoy, mostly impacted by strong sales growth on America (+4.8% yoy) and Asia Pacific
(+2.2% yoy). Lufthansa’s capacity, measured through available seat kilometres
(ASKs), had improved 1.3% in 2014 compared to the previous year, notwithstanding slight reduction in the number of flights (1,028,260 in 2013 to 1,001,975 in 2014). This might be explained by the investment in larger aircrafts that is being carried by Lufthansa. Both increase in capacity and in RPKs led to a slight increase in load factors (+0.3p.p) compared to 2013. Despite favourable air traffic development, revenues on passenger airline group fall in 2014 (-0.8% yoy) driven by pricing pressure that forced prices to go down. As a consequence, unit revenues (RASK) have also been declining since 2012, where they were €8.37 cent. In 2013 RASK was €8.28 cents, falling to €8.04 cents in 2014. This trend is also observable when comparing to other airlines. Excluding Delta Airlines, whose RASK went up from $14.15 cents to $14.58 cents in 2014, all airlines
19Source: CAPA - “Lufthansa, Singapore Airlines respond to Gulf competition witha limited JV. There is scope for more”- November 2015
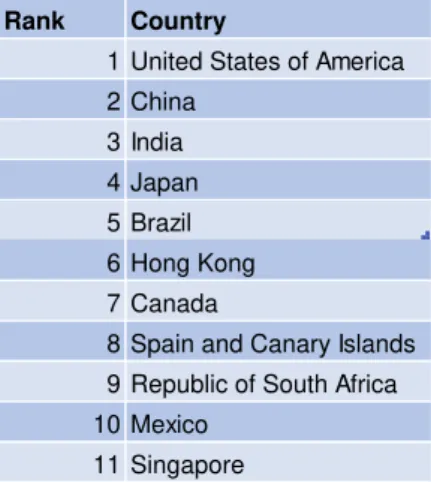
Figure 10. Lufthansa international destinations countries
Rank Country
1 United States of America 2 China
3 India 4 Japan 5 Brazil 6 Hong Kong 7 Canada
8 Spain and Canary Islands 9 Republic of South Africa 10 Mexico
11 Singapore
“DEUTSCHELUFTHANSAAG” COMPANY REPORT
experienced a slightly decrease on their RASK. Analysing RASK on European airlines, Air Berlin displayed a RASK of €7.05 cents in 2014 (€7.24 cents in 2013), Air France-KLM had a value of €6.9 centsin 2014 (€7.05 cents in 2013)
while Ryanair had RASK of €4.8 cents(€5.2 cents in 2013) in the same period. During the first nine months of 2015, performance on passenger airline group was quite favourable. Key value drivers such ASKs, RPKs, load factors had evolve positively and revenues had increase compared to the same period of 2014. Overall, traffic revenue is forecast to increase from 2015 onwards, at a
CAGR 2015-2019 of 3.45% as a result of worldwide growing traffic demand.
However, pricing pressures due to ever-increasing competition and overcapacity are expected to shrink average yields. Detailed forecasts about regional
developments on ASKs and RPKs are given further on the section “Financials & Forecasts” of this report.
Strikes
Lufthansa Passenger Airlines as well as Germanwings and Lufthansa Cargo have been in negotiations with pilots’ union in an attempt to reach an agreement upon transitional benefits schemes and jobs safeguarding given the establishment of the low-cost carrier Eurowings. Lufthansa appears to be far from reaching an agreement with the collective bargaining partners. Over the course of fiscal year 2014 employees went constantly on strikes which had adversely
impacted company’s performance. Due to employee’s decisions, Lufthansa was forced to cancel a significant number of flights as well as to reimburse its customers. As a consequence, strikes brought Lufthansa results down by
€232Mn in 2014. So far, the uncertainty surrounding possible agreements and possible adverse effects of additional strikes remains for years ahead, as intense conversations had been pursued and still no agreement was accomplished. Furthermore, we estimate that strike costs in fiscal 2015 might be slightly higher as it was in the previous year, since in 3Q15 those losses already accounted for
€130Mn and more strikes were scheduled for 4Q15. Lufthansa’s high cost base is also deeply associated to its high labour costs, namely wages, salaries and contribution to the pension funds. The company displays one of the highest average labour costs per unit among European airlines. In fiscal year 2014, the
average labour cost per unit for Lufthansa was €62, equalling those of Air Berlin, comparing to €49 of Ryanair.
Lufthansa Cargo
“DEUTSCHELUFTHANSAAG” COMPANY REPORT
types (Boeing MD-11F and Boeing 777). Lufthansa Cargo portfolio comprises not only standard freight but also specialised products such as animals transport, valuable cargo and temperature-sensitive goods that require investments in adequate infrastructure. As it happens in all Lufthansa’s business segments, Lufthansa Cargo has established a strategic programme that aims at improve its cost structure and continuing progress and innovation processes. In addition, increase of international presence through new partnerships and joint ventures emerge as an opportunity to strengthen its leading position in the market.
During fiscal 2014, revenues of Lufthansa Cargo went down 0.33% yoy, mainly impacted by a decrease in both revenue tonne kilometres (-1.4% yoy) and available tonne kilometres (-1.1%). The decline was mainly driven by a drop in Europe (-4.3% yoy), Middle East/Africa (-4.8 yoy) and Asia/Pacific (-2.4%). Europe is still the main market for Lufthansa Cargo (almost 50% of sales) and its main traffic regions in 2014 were America and Asia/Pacific, each one representing 44% of revenue tonne kilometres.
Regarding cargo traffic forecast for 2015 onwards, world revenue tonne kilometres (RTK) are expected to grow 4.7%20 p.a, however with some regional
divergences. Fastest markets will be Africa (+6.9%) and Middle East (+6.3%) following by Asia (+5.7%) and Latin America (+5.5%). Slower growth is expected in both Europe (+3.1%) and North America (+2.9%). Despite favourable cargo
traffic in some regions, Lufthansa Cargo’s revenues are forecast to slightly drop c.1% over the next years. The decline in revenues will be impacted by low fuel surcharges but mainly by strong competition that Lufthansa will face from Middle East and Turkey. Similar to what we project in Passenger Airline Group, Lufthansa Cargo’sprofitability and potential yields’ stabilisation will highly depend on: 1) capacity management and discipline, 2) ability to overcome competition, either through joint ventures or partnerships and 3) operating efficiency.
Lufthansa Technik
Lufthansa Technik is the business segment responsible for providing maintenance, repair and overhaul services for civilian commercial aircraft where it holds a leading position. Aligned with the overall Group strategy, the main goal of Lufthansa Technik is to achieve profitable growth through its strategic
programme “We Grow”, focusing on increasing its international footprint. As such, Lufthansa Technik has established in Puerto Rico and has opened a new branch in China. Furthermore, it will also build a new wheel and brake workshop at Frankfurt, Germany, which is expected to start operations in beginning 2017.
20Source: Boeing Current Market Outlook 2015-2034
“DEUTSCHELUFTHANSAAG” COMPANY REPORT
In fiscal year 2014, Lufthansa Technik’s revenues increased by 3.8% comparing to the previous year, with European market representing 67% of share
revenue, being the main market for this segment. Despite favourable operating
performance, Lufthansa Technik is currently facing high pricing pressure mainly
due to fierce competition coming from original equipment manufacturers (OEM’s)
who make access to intellectual property more complicated. In order to overcome this issue, the company is establishing and strengthening its partnerships highlighting the recent partnership with Emirates and with South Korean Airline Asiana.
Taking a deep look on global market forecasts, MRO market is predicted to increase at an average of 4.1% in 2015-202521 with a CAGR of 4.4% in
2015-2020 and 3.8% in 2015-2020-2025 highlighting severe divergences among regions. Asia Pacific, India and China will become important markets and will be challenging to develop the required infrastructure to handle market demand.
Lufthansa Technik’s grow is expected to be in line with the market, being a business segment with growing potential to the Group.
Lufthansa Sky Chefs
Lufthansa Sky Chefs is the business segment that is engaged in airline catering services, currently accounting for 6.8% of Group revenue. As it happens in all Group companies, Lufthansa Sky Chefs also has an outstanding position in its industry holding a global market share of 29%22, standing out a market share of
40% in America and 45% in Europe.
Earnings developments in fiscal year 2014 were quite positive for Lufthansa Sky Chefs. Revenues went up 4.7% yoy supported by strong demand and consequently increase in the number of passengers carried. Regarding global market trends and developments, airline catering is expecting a boost in its earnings driven by greater passenger air traffic and upgrades to in-flight sales (ancilliary services). Consequently, the global airline catering market is forecast to increase 5% p.a in 2015-2019. Lufthansa Sky Chefs is expected to outperform the market given its know-how and competitive position. Lufthansa Sky Chefs is strengthening its global network as it had signed new agreements with Delta Airlines, renewed contracts with Emirates, Singapore Airlines and Qantas (New Zealand), Middle East carriers and increasing its presence in Russia and China through joint ventures. Further, the Group segment had reinforced its position in the rail sector by signing a contract with both French and Italian operators. Given positive developments in the airline industry it is also
21Source: Marsh & McLennan Companies, 2015-2025 Global Fleet and MRO Market Forecast
22
“DEUTSCHELUFTHANSAAG” COMPANY REPORT
expected an increase in competition mainly driven by LCC’s in-flight sales upgrades and innovations that consequently will lead new companies to enter in the market.
All in all, Lufthansa Sky Chefs is a potential growing segment within the Group holding a distinctive and competitive position in its industry.
Financials & Forecast
Before proceeding to our valuation, the analysis and projection of some key performance indicators that are determinant to the company to grow and create value are required.
Key Value Drivers
ASK
Available Seat Kilometres (ASK) is a key indicator of airlines capacity. Lufthansa had increased its capacity at a CAGR 2011-2014 of c.1% and, comparing to 2011, the ASK increased by 7.12% in 2014. Regarding ASKs breakdown by region, 34.3% of total capacity is allocated to the European market even though in 2012 the company had 35.6% of its ASKs allocated to this market. On the contrary, America represented 33.6% of Lufthansa’s total capacity in 2014, while in fiscal year 2012 the ASKs in this region were 30.8% of the total. Further, ASKs in Asia/Pacific has remain quite stable with c.23% of total ASK allocated to this market since 2012. Middle East & Africa have undergone drastic changes as 10.4% of total ASKs were allocated to this market in 2012 and by 2014 only 8.9%. In addition, ASKs on those markets had drop 5.9% yoy in 2013 and 6.1% yoy in 2014. These developments on Lufthansa ASKs are supported not only by restrict capacity management from the company, that was possible to achieve due to investment in larger aircraft and replacement of some of the older ones, but also due to regional events that had forced Lufthansa to reduce its capacity, namely the increase of LCCs competition in Europe and Gulf carriers activity. Consequently, ASK is forecast to increase at an annual growth rate of 3% in the years ahead for mainly two reasons: 1) Air traffic demand is forecast to increase significantly in the following years and 2) Lufthansa is placed to handle the expected growth due to its competitive position and also, as it will take delivery of new aircrafts, it will be able to adapt its capacity to fluctuations in demand in a flexible and effective manner.
RPK
Figure 11. ASK breakdown by region until 2014
34.3%
33.6% 23.1%
8.9%
Europe America Asia/Pacific Middle East/Africa
Source: Company’s Data
Figure 12. ASK breakdown by region until 2014
35.6% 30.8% 23.2% 10.4%
35.0% 32.2% 23.2% 9.7%
34.3% 33.6% 23.1% 8.9%
Europe America Asia/Pacific Middle East/Africa
2014 2013 2012
“DEUTSCHELUFTHANSAAG” COMPANY REPORT
Revenue Passenger Kilometres is one of the main key performance indicators of airlines as it gives the perception of how demand developed and how many seats were sold by a company. Lufthansa’s RPKs have grown at a higher rate than ASKs with a CAGR 2011-2014 of 2.3% and a value of 268,105, 000 in 2014. Similar to what happens with ASKs, the main markets are both America (36% of total RPKs in 2014) and Europe (32%) followed by Asia/Pacific (24%) and Middle East & Africa (8%). However, RPKs developments in some regions have been of concern. In 2014 RPKs had increase in all regions, standing out the growth in America (+4.8 yoy), with the exception of Middle East & Africa that dropped significantly in both 2013 (-5.5% yoy) and in 2014 (-3% yoy). However this trend seems to have improved as in the 3Q15 the demand in this market saw an increase of 1.10%.
In the light of the abovementioned events, overall air traffic demand in Lufthansa is forecast to increase c.4% p.a despite divergences across regions. As such, RPKs in Europe are expected to grow c.3% p.a, below the 3.26% market forecast, impacted by ever-increasing growth of LCCs in both short-haul and medium-haul routes but there is also risk of penetration on the long-haul routes market and possibility to start transatlantic operations. Those events might have
a significant impact on Lufthansa’s traffic share in Europe and thus we decided to
be conservative and kept a 3% growth rate. Further, RPKs in America is
expected to growth at 4.3% p.a as Lufthansa will keep benefiting from its strong
and well established international partnerships (A++). Traffic demand in
Asia/Pacific is forecast to grow at 5.1% p.a. Asia/Pacific is becoming one of
the largest airline markets in the world and is expected to be the largest one in 2034. Lufthansa is well placed to capture and benefit from this growth especially now that has established a new joint venture with Singapore airlines and in 2014 a memorandum of understanding with Air China were also established. Middle
East/Africa RPKs is forecast to grow c.3% p.a, significantly below the global
market forecast of c.5%. We believe that, Gulf Carriers operators and their increasing share traffic on routes between Europe and Middle East, will adversely impact Lufthansa, which will be unable to compete with those carriers, given their advantageous position.
Load Factors
Load factors translate the relation between RPKs and ASKs given a better
understanding of capacity’s proportion that was actually sold. Over the years,
Lufthansa’s load factors have been slightly increasing at a CAGR 2011-2014 of 1.1%, reaching 80.1% in fiscal year 2014. By taking a look at peer companies’ figures, EasyJet displayed the highest load factors (90.60% in 2014) followed
Figure 13. RPK breakdown by region (2012-2019)
0 50,000 100,000 150,000 200,000 250,000 300,000
2012 2013 2014 2015 2016 2017 2018 2019
Europe America Asia/Pacific Middle East/Africa
Source: Company Data; Analyst’s
“DEUTSCHELUFTHANSAAG” COMPANY REPORT
by Air France-KLM and Delta Airlines (both with 84.7% in 2014). Air Berlin and Ryanair come next with load factors of 83.46% and 83%, respectively. As can be draw, together with IAG, that displayed a value of 80.4% in 2014, Lufthansa has
the lowest load factors among the industry.
Confined capacity management, together with overall increase in air traffic demand, is then projected to positively impact the load factor development. Further, given that RPKs is forecasted to grow at a greatest rate than ASKs, it is expected a slight increase in load factors as a consequence. Lufthansa’s load factors are then forecasted to reach 81.4% in 2016 and 83.6% in 2019.
Fuel Costs
Fuel costs are indeed an important key value driver for airlines. As mentioned earlier, oil prices drop significantly in 2015 and this tendency is expected to continue in the years ahead which can drive airlines’ costs to go down considerably. Oil prices are forecast to reach an average spot price in 2015 of US$53.82/bbl and US$56.24/bbl in 2016 and from 2017 onwards is expected a slightly increase in prices, however only in 2025 prices will return to 2013 levels. Regarding Lufthansa fuel consumption, the company was able to reduce its consumption of 3.91l23 (/100pkm) in 2013 to 3.84l (/100 pkm) in 2014, or a
decrease of 1.6% yoy, and expects to keep this reduction at a rate of 1.5% p.a due to the delivery of more fuel-efficient aircraft that started in 2015. Thus, fuel consumption in Deutsche Lufthansa is expected to be at 3.56l (/100pkm) in
2019. It is worth to mention that despite the slump in fuel prices, increase in fuel costs in projected P&L are increasing as a consequence of investments in capacity and growing traffic demand that were mentioned earlier. Further, Lufthansa has a well-defined hedging strategy aiming at smoothing its exposure to fuel prices movements. Lufthansa hedges with a time horizon of up to 24 months and the maximum hedging level is 85%. Fuel hedging level projected for 2016-2019 is 73% at a price of US$68/bbl. As of February 2015, Lufthansa break-even was reached at a price of US$93/bbl. This is expected to reverse in the near future given the oil prices scenario. Since Lufthansa pays for fuel in dollars, fluctuations in EUR/USD exchange rate are also important as the weakening of the EUR is likely to offset potential cost savings from prices decline. However, due to high exposure to USD, the company also uses hedging strategies to mitigate those financial risks. The fuel costs per ASK for Deutsche Lufthansa had slightly from €2.71 cents in fiscal 2013 to €2.52 cents in 2014. Analysing the figures of other European airlines, Air Berlin had fuel costs per
23
Source: Deutsche Lufthansa Sustainability Report 2014 Figure 14. Deutsche Lufthansa
Load Factors
77% 78% 79% 80% 81% 82% 83% 84%
2011 2012 2013 2014 2015 2016 2017 2018 2019
Source: Company Data; Analyst’s
Estimates
Figure 15. Deutsche Lufthansa - Fuel consumption (l/100pkm)
2013 2014 2015 2016 2017 2018 2019
3.91 3.84 3.78 3.73 3.67 3.61 3.56
Source: Company Data; Analyst’s
“DEUTSCHELUFTHANSAAG” COMPANY REPORT
ASK of €1.74 cents in 2014 (€1.86 cents in 2013) while EasyJet costs
amounted to £1.57 pence in 2014 (£1.59 pence in 2013).
Average Yields
Average yields are a key value driver for airlines as it allows understanding how profitable that are being comparing to its peers. Lufthansa’s average yield has been declining since 2012. In fiscal year 2012 Lufthansa was earning €10.62 cents, in 2013 yields decreased to €10.37 cents and they decline even further in
2014 to €10.05 cents. Overall, average yields had drop 0.66% since 2011. During the 9M15 the company saw a 2.1% yoy increase that was only possible to achieve due to currency effects. Furthermore, we forecast average yields to decline slightly in the years ahead from €10 cents in 2015 to €9.73 cents in 2019 due to fierce competition that Lufthansa will face in almost all of its markets but also due to expected global market overcapacity. Both events will exert pressure on prices to go down. Despite improved cost efficiency and projected cost savings, the company will still be unable to compete with some airlines. In 2014, the average price per passenger charged by Lufthansa was €212.2
comparing to €119.1 charged by Air Berlin and €57.9 by Ryanair. Up to now Lufthansa held a market position that allows it to charge a clear premium price, however is uncertain to what extent this will be likely and sustainable in the near future.
Others - Pension Liabilities
Despite not being considered as a key performance indicator for airlines, pension provisions have a significant impact on Lufthansa results. Lufthansa continues the negotiations with labour unions in an attempt to reach an agreement upon
transitional benefits and company’s pension schemes. However, it is still uncertain whether new arrangements will be established and their effects on the accounts. Given its complexity, we had projected that pension liabilities in the balance sheet will reduce gradually from 2015 onwards as the company is making its contributions to the fund. Those contributions are already included in
“Staff costs”, at the Income Statement.
Valuation
Our valuation on Deutsche Lufthansa AG was conducted through a Discounted Cash Flow Method (DCF), which intends to discount all the future cash flows at the weighted average cost of capital (WACC). The valuation method was chosen in a light of company’s financial aim to act towards a target equity ratio of 25%. In 2014 the Net Debt to Enterprise value, at market values, was around 30%.
Figure 17. Average Prices per
Passenger in 2014 (€)
Deutsche Lufthansa AG 212.2 Thomas Cook Group (Condor) 242 Air Berlin 119.1
Eurowings 106.3
Germanwings 97.5
Ryanair 57.9
Source:Euromonitor International
Figure 16. Average yields
9.6 9.8 10.0 10.2 10.4 10.6 10.8
2011 2012 2013 2014 2015 2016 2017 2018 2019 Source: Company Data; Analyst’s
“DEUTSCHELUFTHANSAAG” COMPANY REPORT
Following this reasoning, we had set a target Net Debt to Enterprise Value of
30%.
Regarding industry figures, the Net Debt/Enterprise Value ratio diverge widely among the peer companies. In fiscal 2014, Air Berlin displayed the highest Net Debt/EV ratio (86%), followed by Air France-KLM (69.7%) while Ryanair and EasyJet had negative ratios (-1.4% and -8.1% respectively). On the other hand, IAG and Delta Airlines had a Net Debt/EV of 11.3% and 13.8%, respectively.
WACC
As for computing the cost of debt, we had based on the credit rating assigned by
Moody’s. A Ba1 rating is assigned to Deutsche Lufthansa, which corresponds to a spread of 3.25% over the risk-free rate. Then, the cost of debt estimated for Deutsche Lufthansa AG was 5.8%.
In order to estimate Lufthansa’s cost of equity, we had relied on the Capital Asset Pricing Model (CAPM)24, where an equity risk premium of 6.25% and a
risk-free rate of 2.56% were obtained. The risk-free rate was obtained by computing
the 10 years average of 10-year German Government Bonds instead of the current yield25 (0.47%), as we believe that yields are artificially low, mostly due to
European Central Bank (ECB) initiatives, and probably will not remain at this level throughout the forecasted period. Furthermore, an equity risk premium of 6.25%26 was set through the implied equity market premium methodology. In the
end, the cost of equity computed for Deutsche Lufthansa AG was 8.5%. As regards to the beta, we had rely on Deutsche Lufthansa’s peer companies that were defined based on both market capitalization and markets in which they operate. The comparables chosen were Air Berlin, Air France-KLM, EasyJet,
Ryanair, International Airlines Group and Delta Airlines. The MSCI World
Index was considered as the market portfolio and 5Y weekly data was used. After estimating the regression beta of the peer companies, we had unlevering the betas and computed a simple average. Afterwards, the levered beta was computed for Deutsche Lufthansa, using its market values of Net Debt and Equity, reaching a final levered beta of0.95.
After computing all the determinants, we arrived at a WACC of 7.3% for Deutsche Lufthansa AG.
Terminal Value
24Capital Asset Pricing Model (CAPM). One had use Re= Rf + β*Rm 25
As of December 2015
“DEUTSCHELUFTHANSAAG” COMPANY REPORT
7.21% 7.24% 7.28% 7.32% 7.35% 7.39%
2.50% 12.63 12.35 12.06 11.79 11.51 11.24
2.75% 14.55 14.24 13.92 13.61 13.31 13.01
3.00% 16.70 16.35 16.00 15.66 15.32 14.98
3.25% 19.12 18.73 18.33 17.95 17.57 17.19
3.50% 21.87 21.42 20.98 20.54 20.11 19.69
WACC
As for terminal value we had used the Gordon Growth Model. The GGM formula was based on a growth rate of 3% and free cash flow in the last year of the explicit period. For the growth rate estimation, we had considered the expected long-term real GDP growth for Germany (1.3% at 2020) adjusting this growth rate for the inflation forecasted for this economy. One had set the terminal value
based on German economy as this is Lufthansa’s domestic market and we believe that company’s sustainability is highly tied to macroeconomic developments in Germany, despite operating worldwide.
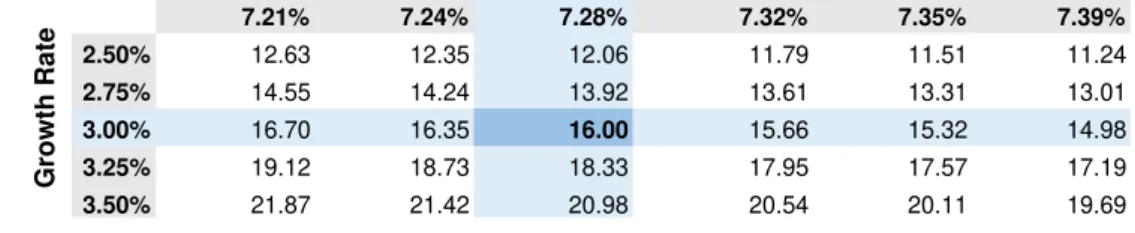
Sensitivity Analysis
As we said before, airlines industry is highly dependent on macroeconomic developments. Unexpected fluctuations in macroeconomic factors might adversely impact earnings but it also might have a positive impact, when
assumptions are better than those that were forecasted. Lufthansa’s price is
extremely sensitive to changes in different input assumptions and thus we will further analyse how they influence the share price. Considering that a great part
of Lufthansa’s value is determined by the terminal value, one had analysed the impact of the variations in this figure as well as in the weighted average cost of capital (WACC) on our price target, whose results are presented below. The price ranges from €12.63 to €19.69, which allows to conclude that slightly changes on both input assumptions are likely to have a noteworthy impact on the share price. Further, changes in the growth rate seemed to be more significant than those in the cost of capital. Lufthansa’s performance is closely tied to GDP developments, which was the driver for our growth rate estimate, and economic downturns (upturns) are expected to have a considerable negative (positive) impact.
Figure 18. Sensitivity Analysis of the growth rate and WACC
G
row
th
Rate