Research Article
Evaluation of Quality Parameters of Apple Juices Using
Near-Infrared Spectroscopy and Chemometrics
Katarzyna Włodarska ,
1Igor Khmelinskii ,
2and Ewa Sikorska
11Faculty of Commodity Science, Pozna´n University of Economics and Business, al. Niepodległo´sci 10, 61-875 Pozna´n, Poland 2Universidade do Algarve, FCT, DQB and CEOT, Campus de Gambelas, 8005-139 Faro, Portugal
Correspondence should be addressed to Ewa Sikorska; [email protected]
Received 8 March 2018; Revised 12 May 2018; Accepted 26 May 2018; Published 28 June 2018 Academic Editor: Jose S. Camara
Copyright © 2018 Katarzyna Włodarska et al. This is an open access article distributed under the Creative Commons Attribution License, which permits unrestricted use, distribution, and reproduction in any medium, provided the original work is properly cited.
Near-infrared (NIR) spectra were recorded for commercial apple juices. Analysis of these spectra using partial least squares (PLS) regression revealed quantitative relations between the spectra and quality- and taste-related properties of juices: soluble solids content (SSC), titratable acidity (TA), and the ratio of soluble solids content to titratable acidity (SSC/TA). Various spectral preprocessing methods were used for model optimization. The optimal spectral variables were chosen using the jack-knife-based method and different variants of the interval PLS (iPLS) method. The models were cross-validated and evaluated based on the
determination coefficients (R2), root-mean-square error of cross-validation (RMSECV), and relative error (RE). The best model
for the prediction of SSC (R2�0.881, RMSECV � 0.277°Brix, and RE � 2.37%) was obtained for the first-derivative preprocessed
spectra and jack-knife variable selection. The optimal model for TA (R2�0.761, RMSECV � 0.239 g/L, and RE � 4.55%) was
obtained for smoothed spectra in the range of 6224–5350 cm−1. The best model for the SSC/TA (R2�0.843, RMSECV � 0.113, and
RE � 5.04%) was obtained for the spectra without preprocessing in the range of 6224–5350 cm−1. The present results show the
potential of the NIR spectroscopy for screening the important quality parameters of apple juices.
1. Introduction
Over the past years, the application of the near-infrared (NIR) spectroscopy coupled with chemometrics has gained wide acceptance in different fields, including food and ag-ricultural products [1–6].
NIR spectroscopy is based on the absorption of elec-tromagnetic radiation in the range of 12,500–4000 cm−1 [2, 7]. The NIR spectra consist of broad overlapping bands arising from overtones and combination tones of the fun-damental vibrations involving C-H, O-H, and N-H chemical bonds. These bonds are the primary structural components of organic molecules; thus, NIR is very useful for mea-surements of biological and organic systems, including foods. Due to the wealth of chemical information provided by the NIR spectra, they allow simultaneous determination of several constituents and/or of diverse sample properties [4, 7].
One of the main advantages of the NIR technique is its nondestructive character and simple and rapid measure-ments. Different measurement modes enable direct analysis of both liquid and solid samples without any preparation. Due to its advantages, the NIR technique coupled with chemometrics provides a rapid, effective, and cost-saving alternative to the conventional methods in routine, high-throughput analysis of foods. NIR has been used to assess both the properties and concentrations of the food com-ponents, being also a well-established tool for process monitoring.
Using NIR for quality control requires chemometric methods to extract useful information out of complex spectra of the products studied [8]. Practical applications usually require development of multivariate calibration, which define the relationships between the measured spectra and the content of the compound or property of interest, obtained by the respective reference methods. Multivariate Volume 2018, Article ID 5191283, 8 pages
regression methods are used for developing quantitative models, with partial least squares (PLS) regression being the most widely used. A lot of factors impact the performance of the calibration models, one of the important issues being an appropriate choice and application of chemometric methods. The collected spectra are usually preprocessed mathematically to reduce noise and enhance the analytical information. This improves the results of the subsequent data analysis and leads to better calibration models [9]. The regression analysis may be performed using the entire NIR spectra. However, many studies showed improvements when calibrations were developed in a selected spectral region as compared to the full-spectrum model [10]. Several methods have been developed to objectively identify the important variables (spectral regions), being more efficient than the traditional approach based on the knowledge of the spectroscopic properties of the sample and/or analysis of the regression results performed on the entire spectra [10, 11]. An important area of NIR application is the analysis of fruit and vegetables and products of their processing [5, 12–14]. Considerable attention has been devoted to studies of the apple properties using NIR [12, 15]. Apples are very popular due to their pleasant flavour and beneficial health effects, being a relevant dietary source of phyto-chemicals, including phenolics [16].
NIR spectroscopy has been successfully used to evaluate a range of intact apple quality attributes such as the soluble solids content, titratable acidity, sugar content, vitamin C, total polyphenols, starch index, chlorophyll content, firm-ness, and mealiness [17–19]. The feasibility of using variable selection methods for determination of the apple quality parameters such as soluble solids content was also dem-onstrated [17, 20, 21].
Despite the amount of research carried out to date on using NIR to evaluate properties of the intact apples, the number of published papers that study the apple juice is rather limited. Spectroscopy in the NIR range was used to predict sugar content in the apple juice [22], detect adulteration [23], and differentiate between the apple juices on the basis of apple variety [24]. The combination of NIR spectroscopy and fluorescence enabled detection of quality deterioration of the apple juice during storage and heating [25]. Application of this method for determination of the quality parameters of apple wine was also reported recently [26].
The important characteristics of apple juices related directly to their quality are soluble solids content (SSC) and titratable acidity (TA). The limits for these parameters in marketed apple juices are defined by the Code of Practice developed by the European Fruit Juice Association, which provides reference for the control of juice quality on the EU market. SSC is one of the major characteristics used to indicate sweetness of fresh and processed fruit products [13]. Titratable acidity is related to the organic acid contents; these compounds contribute to the sour taste and also stabilize colour and extend the shelf life of fresh fruit and their processed products. The overall taste of fruit is more closely related to the ratio of SSC and TA than to the individual parameters; therefore, this ratio is used as an index of sensory acceptability of the fruit taste [27].
The aim of the present study was to test feasibility of the NIR spectroscopy in developing the calibration models for predicting the main quality parameters of the apple juices: SSC, TA, and SSC/TA. We also explored the possibilities to optimize the models using jack-knife variable selection, different variants of the interval PLS variable selection, and preprocessing methods.
2. Materials and Methods
2.1. Apple Juices. Apple juices that are available on the
market were evaluated in this study. The samples included clear and cloudy juices reconstituted from the concentrate, direct juices that were pasteurized, and freshly squeezed juices. The total of thirty juices from 15 different producers was studied; all of these samples were studied in duplicate, using two different production batches.
2.2. NIR Measurements. The spectra were collected using an
FT-NIR spectrophotometer (MPA; Bruker Optics, Ettlingen, Germany). The instrument performance was validated be-fore measurements by running automatic tests according to the manufacturer’s procedure. Spectral acquisition and in-strument control were performed using OPUS software (v. 5; Bruker Optics, Ettlingen, Germany). The spectra were ac-quired in the range of 12,500–4000 cm−1with the resolution of 8 cm−1and with 64 scans coadded to obtain the averaged spectrum. The measurements were performed using trans-mittance techniques in cuvettes with the optical pathlength of 2 mm. The cuvettes were placed into a temperature-controlled cell holder, and measurements were conducted at a constant temperature of 35°C, controlled by the OPUS
software. The spectra were recorded after centrifugation (15,000 rpm for 5 min), with six replicated spectra collected for each of the juices.
2.3. Determination of the Chemical Parameters. The soluble
solids contents (SSC) of the juices were determined using an Abbe refractometer (model DR-A1’s Conbest) at 20°C,
calibrated with distilled water. The SSC was expressed as Brix degrees (°Brix), with all of the measurements carried out in
triplicate.
Titratable acidity (TA) was measured using a pH meter (S220 SevenCompact
™
; Mettler Toledo), by titrating 25 ml of the juice sample with 0.1 M NaOH to the pH endpoint of 8.1. The results were expressed as grams of malic acid per litre of the juice (g/L). These measurements were performed in triplicate.2.4. Data Analysis
2.4.1. Regression Methods. Partial least squares (PLS)
re-gression was used to establish the calibration models be-tween the NIR spectra (the X matrix) and the quality parameters of the apple juices (the Y matrix). The PLS method models both the X- and Y-matrices simultaneously, finding the latent variables in X that best predict the latent variables in Y [28]. We used all thirty juice samples for
developing and optimizing the calibration models. The average spectra were used in the analysis.
2.4.2. Validation of the Regression Models. Full leave-one-out
(LOO) cross-validation was applied to all of the regression models. The regression models were evaluated using the de-termination coefficient (R2), the root-mean-square error of cross-validation (RMSECV), and the relative error (RE), calculated as the percentage ratio of RMSECV to the average value of the studied parameter in the calibration set. The optimal number of components was chosen as the minimum on the plot of the RMSECV as a function of the number of components.
2.4.3. Spectral Preprocessing. We used different
pre-processing methods in order to remove noise, baseline, and scattering effects from the spectra. Savitzky–Golay smoothing with the filter width of 15 data points was used to remove spectral noise, while the baseline was corrected using the baseline offset and the first and second derivatives. The baseline offset involved linear offset subtraction, which shifted the spectra in order to set the minimum value to zero. The first-order derivative is normally used to eliminate constant baseline shifts, and the second-order derivative also eliminates the baseline slope [9]. The derivatives were cal-culated using the Savitzky–Golay algorithm, with the filter width of 15 data points. Multiplicative scatter correction (MSC) and standard normal variate (SNV) were applied for the correction of the light-scattering effects [9]. The MSC estimates the correction coefficients for additive and mul-tiplicative scattering effects by regressing the spectrum to be corrected on a reference spectrum [9]. The average spectrum of the calibration set was used as a reference. The SNV corrects the spectra by first calculating the mean spectrum and subsequently subtracting this mean from the spectrum to be corrected. Then, that value is divided by the standard deviation of the spectrum [9]. The spectra were preprocessed using each of the single methods and/or their following combinations: smoothing and baseline, smoothing and SNV, smoothing and MSC, MSC and the first-order de-rivative, MSC and the second-order dede-rivative, SNV and the first-order derivative, and SNV and the second-order de-rivative. The order of application of the different pre-processing methods was as indicated in the preceding description.
The preprocessing was performed on the average NIR spectra. Prior to PLS analysis, all of the spectra were mean-centred.
2.4.4. Variable Selection. The variable selection methods
applied in this work include the jack-knife method and different variants of the interval PLS (iPLS) [29].
The jack-knife is a method used for calculating the standard errors of the regression coefficient estimated in the PLS regression model [30]. The regression coefficients are then divided by their estimated standard errors, giving the
t-test values to be used for testing the significance of the
variables used in the model [11]. These calculations were carried out using The Unscrambler v. 9.8 software (CAMO, Norway).
The iPLS method subdivides the data into non-overlapping sections, obtaining a local PLS model in each section, in order to determine the most useful variable range. The comparison between all of the local models is usually based on the RMSECV values, obtained from the validation [11]. An optimal data range may be found by reducing or increasing the existing trial ranges, or by removing or adding new variables [20]. Presently, we used different variants of the iPLS method as implemented in the OPUS software for selection of the optimal variable ranges [31].
The iPLS (NIR) variant used an NIR spectrum (with the 12,500–11,263 cm−1 and 5349–4779 cm−1 ranges excluded) that was divided into five frequency ranges, each corre-sponding to specific absorption bands. The local PLS models were tested in each of the selected ranges on their own and in all of their possible combinations. This procedure coincides with the synergy interval PLS (SiPLS) [10].
The iPLS (A) and iPLS (B) variants used the entire NIR spectrum (in the 12,500–4000 cm−1 range, with the 5349–4779 cm−1range excluded) divided into ten subranges. The iPLS (A) started the calculation with all of the 10 subranges and next successively excluded one of the sub-ranges. This procedure continued until the RMSECV value did not improve any further. This procedure coincides with the backward iPLS (BiPLS) [10].
The iPLS (B) starts the calculation to find the optimum spectral range with one of the subranges. After finding the best subrange, a second subrange is added. After the best combination of the two subranges is found, a third subrange is added, and so on. The best combination of the subranges was thus searched by adding and leaving out further sub-ranges. This procedure coincides with the forward iPLS (FiPLS) [10].
The selection of variables was performed on differently preprocessed spectra. The algorithm implemented in the OPUS software enables automatic searching for the optimal combinations of the preprocessing method with the spectral range based on the minimum value of the RMSECV cri-terion. The 5349–4779 cm−1 spectral range was excluded from the calculations due to the high absorbance values, clearly exceeding the useful range of the instrument.
Finally, all of the PLS models with different combina-tions of the preprocessing methods and the variable ranges were calculated using The Unscrambler v. 9.8 (CAMO, Norway).
3. Results and Discussion
3.1. NIR Spectra of Apple Juices. The thirty apple juice
samples studied included different juice categories available on the market. They included juices reconstituted from the concentrate, both clear and with added fruit pulp, and direct juices, pasteurized and freshly squeezed.
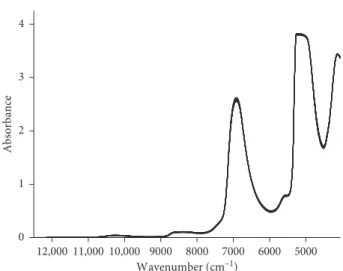
Figure 1 shows the NIR absorbance spectra collected for the apple juices studied.
Very similar characteristic spectral patterns were ob-served in all of the measured spectra, which were visually indistinguishable. Generally, the positions of the main ab-sorption bands coincided with those obtained for intact apples [32] and other fruit juices [33].
The absorbance spectra are dominated by water absorp-tion, which is the main component of the apple juices. The absorption bands for water were reported at 10,309 cm−1 (the second overtone of the O-H stretching band), 8403 cm−1 (the combination of the first overtone of the O-H stretching and the O-H bending bands), 6896 cm−1(the first overtone of the O-H stretching band and a combination band), 5154 cm−1 (combination of the O-H stretching band and the O-H bending band), and 4444 cm−1[12, 13, 34].
Sugars and organic acids are the main constituents of apple juices, besides water. The most dominant sugar in the apple fruit is fructose, followed by glucose and sucrose. Malic acid is the principal organic acid found in apples. Other components of the apple juice include polyphenolic compounds, vitamins, and some amino acids [35]. All of these components should contribute to the spectra in different NIR ranges; however, their bands are largely suppressed by the dominant water absorption bands. The absorption bands in fruit juices at 6896, 5587, and 4413 cm−1were attributed to sucrose, fructose, and glucose [2]. In fact, the absorption spectra of glucose, fructose, and sucrose are very similar to each other in aqueous solutions, with characteristic bands at 6301–6317, 4716–4710, and 4403–4397 cm−1[36].
The first, second, and third overtones of the C-H stretching vibrations (CH group) are observed, respectively, in the ranges of 5550–6250 cm−1, 8100–9100 cm−1, and 11,000 cm−1. The bands arising from the overtones of OH, CH, and CH2 deformation vibrations are observed below 5400 cm−1[13]. The combination band of the C-H bond in sugars and organic acids was reported at 4323 cm−1[32].
The absorption bands characteristic for the carboxylic acids appear at 6222 cm−1 (C-O from COOH), 8873 cm−1 (O-H from carboxylic acids), and 6959 cm−1 (C�O from saturated and unsaturated carboxylic acids) [15].
3.2. Multivariate Calibration
3.2.1. Chemical Characteristics of the Calibration Set. All of
the thirty apple juice samples were used as the calibration set for developing and optimizing the calibration models. Chemical characteristics of the calibration set including the mean values, ranges, and standard deviations of the soluble solids contents (SSC), titratable acidity (TA), and the SSC/TA ratio are presented in Table 1.
The solids content in the studied apple juices was in the range of 11.0 to 13.6°Brix. The titratable acidity was 5.25 g/L
on average and ranged from 4.51 g/L to 6.09 g/L. These values are within the limits established for apple juices by the Code of Practice [37].
The ratio of SSC and TA fell in a narrow range of 1.84–2.71 in all of the juices studied, being the key parameter determining the taste of fruit products.
3.2.2. Development and Optimization of the Calibration Models. Multivariate PLS regression was used to model the
relations between the NIR spectra and the properties of the juices (SSC, TA, and SSC/TA). Different methods of processing and variable selection were tested. The pre-processing methods included smoothing, multiplicative scatter correction (MSC), standard normal variate (SNV), and baseline correction techniques, and the latter included baseline offset and calculation of the first and second spectral derivatives; both single methods and some of their com-binations were tested.
The optimal variable ranges for the raw and differently preprocessed spectra were determined using the jack-knife method and three variants of the iPLS method. The jack-knife method was applied to the regression coefficient of the PLS regression models obtained for the analysis of the entire NIR spectra. The iPLS models were developed on ten spectral subranges of equal width, or on five subranges, selected to include specific absorption bands. These five spectral intervals were 11,262–9407 cm−1, 9406–7498 cm−1, 7497–6225 cm−1, 6224–5350 cm−1, and 4778–4000 cm−1. The idea of variable selection is to identify a subset of the data that produces the lowest prediction error for the parameter of interest. Different combinations of the preprocessing and variable selection methods were evaluated in order to find the optimal pro-cedure. We compared the prediction performance of these local models with that of the global full-spectrum model. We evaluated the models on the basis of cross-validation, R2, the RMSECV, and the RE value [12].
Table 2 presents the optimal calibration models obtained using each of the tested variable selection methods for each 12,000 11,000 10,000 9000 8000 7000 6000 5000 0 1 2 3 4 Absorbance Wavenumber (cm–1)
Figure 1: The NIR spectra of the apple juices under study.
Table 1: The soluble solids content (SSC), the titratable acidity (TA), and the ratio of the soluble solids to the titratable acidity (SSC/TA) of the apple juices in the calibration set (n � 30 samples).
Parameter Range Mean SD
SSC (°Brix) 11.0–13.6 11.68 0.79
TA (g/L) 4.51–6.09 5.25 0.48
of the parameters studied. The characteristics of the models developed using the full raw spectra are also presented for comparison.
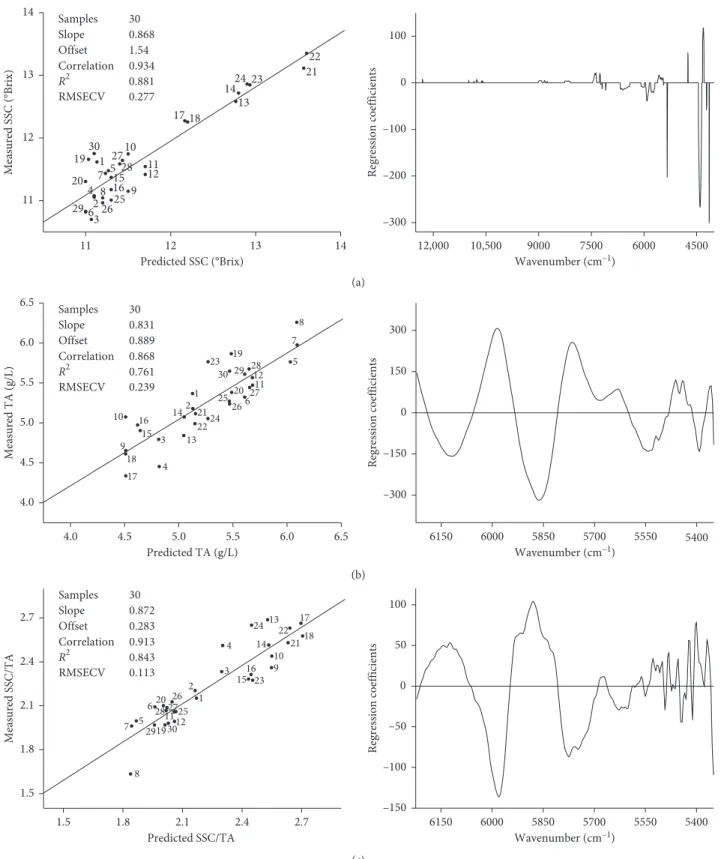
Finally, for each of the parameters studied, we identified a combination of the preprocessing method and the spectral range, which provided the model with the best prediction performance. The predicted versus measured plots and the regression coefficient plots for these models with the best performance for each of the parameters studied are shown in Figure 2.
(1) SSC Calibration Models. The parameters listed in Table 2
demonstrate good capacity of the NIR spectroscopy to predict the SSC of the apple juices. Indeed, a relatively good model for SSC was obtained for the analysis of the entire NIR spectra without any preprocessing. Preprocessing and variable se-lection improved the model parameters. Thus, the best model for SSC prediction was obtained for the first spectral derivative and variables selected by the jack-knife method; these variables are shown in Figure 2(a). The respective model was charac-terized by the R2of 0.881 and the RE value of 2.37%.
The variable selection by iPLS also led to model im-provement as compared to the full-spectra models. The optimal intervals selected using iPLS (NIR) were 9406–7498 cm−1and 6224–5350 cm−1, which combined with the second-derivative preprocessing gave the model with a slightly higher value of RE of 2.65%. The optimal intervals selected using both iPLS (A) and iPLS (B) were the same (10,109–8516 cm−1and 6137–5334 cm−1), which combined with the SNV and the first-derivative spectral preprocessing gave the models with slightly higher errors than the other variable selection methods tested (RE equal to 2.77%).
The results obtained for SSC modeling are comparable with the literature data; typical values of RMSEP for intact apples were around 0.5°Brix or even higher (1–1.5°Brix),
when the external validation was performed using fruit test sets collected in different seasons and orchards [12].
(2) TA Calibration Models. The calibration model developed
using raw data and the full-spectral range for TA showed poor performance with a low R2 value and high RMSECV (Table 2). Spectral preprocessing combined with variable selection markedly increased the prediction ability of these models. However, it should be noted that even the optimized models were characterized by rather low R2 values in the range between 0.713 and 0.761.
The best model for the TA prediction was obtained for the spectral range selected by the iPLS (NIR) method (6224–5350 cm−1) for smoothed spectra (Figure 2(b)). This model was characterized by the R2of 0.761 and RE value of 4.55%. The application of iPLS (A) and iPLS (B) methods led to the selection of a wider spectral range as compared to the iPLS (NIR). In addition to the range of 6137–5334 cm−1 selected by both iPLS (A) and iPLS (B) methods, the 10,904–10,106 cm−1 and 9314–7722 cm−1 regions were se-lected by iPLS (A) and the 10,109–8516 cm−1 region was selected by iPLS (B). Models with a similar predictive ability resulted from the combination of iPLS (A) with smoothing and SNV, and of iPLS (B) with smoothing and MSC. These models had a lower prediction ability as compared to the iPLS (NIR) models. A model with an intermediate predictive ability (RE of 4.80%) was obtained for the analysis of the smoothed and SNV-corrected spectra with the variables selected by jack-knife.
The lower predictive ability obtained for the TA models as compared to the SSC models is in accordance with the literature data. This result may be explained by the lower concentration of acids compared to that of sugars [12], and/or lower NIR spectral sensitivity to acids, due to the lower number of functional groups per molecule.
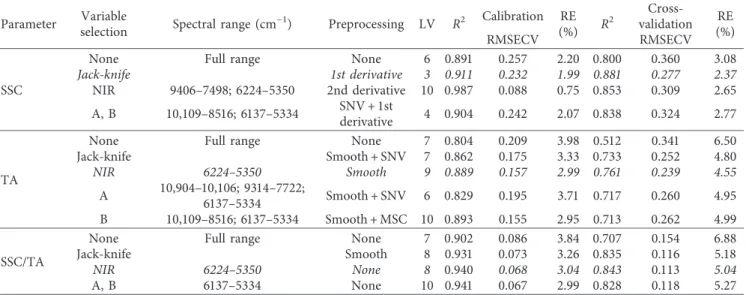
Table 2: Characteristics of the optimal regression models for the prediction of the soluble solids content (SSC), titratable acidity (TA), and ratio of the soluble solids content to the titratable acidity (SSC/TA) of the apple juices under study.
Parameter Variable
selection Spectral range (cm
−1) Preprocessing LV R2 Calibration RE (%) R 2 validationCross- RE (%) RMSECV RMSECV SSC
None Full range None 6 0.891 0.257 2.20 0.800 0.360 3.08
Jack-knife 1st derivative 3 0.911 0.232 1.99 0.881 0.277 2.37
NIR 9406–7498; 6224–5350 2nd derivative 10 0.987 0.088 0.75 0.853 0.309 2.65
A, B 10,109–8516; 6137–5334 SNV + 1st
derivative 4 0.904 0.242 2.07 0.838 0.324 2.77
TA
None Full range None 7 0.804 0.209 3.98 0.512 0.341 6.50
Jack-knife Smooth + SNV 7 0.862 0.175 3.33 0.733 0.252 4.80
NIR 6224–5350 Smooth 9 0.889 0.157 2.99 0.761 0.239 4.55
A 10,904–10,106; 9314–7722;6137–5334 Smooth + SNV 6 0.829 0.195 3.71 0.717 0.260 4.95
B 10,109–8516; 6137–5334 Smooth + MSC 10 0.893 0.155 2.95 0.713 0.262 4.99
SSC/TA
None Full range None 7 0.902 0.086 3.84 0.707 0.154 6.88
Jack-knife Smooth 8 0.931 0.073 3.26 0.835 0.116 5.18
NIR 6224–5350 None 8 0.940 0.068 3.04 0.843 0.113 5.04
A, B 6137–5334 None 10 0.941 0.067 2.99 0.828 0.118 5.27
The best model for each of the parameters is italicized; none: spectra without preprocessing; 1st derivative: first-order derivative; 2nd derivative: second-order derivative; smooth: smoothing; SNV: standard normal variate; MSC: multiplicative scatter correction; NIR, A, and B are different versions of the iPLS method.
(3) SSC/TA Calibration Models. The regression analysis for
SSC/TA performed on raw spectra in the full-spectral range gave a model with the R2equal to 0.707 and RE equal to 6.88% (Table 2). Also, in this case, PLS models were significantly
improved by applying an appropriate combination of spectral preprocessing and variable selection methods. The perfor-mances of optimized models for the SSC/TA prediction were intermediate as compared to those of the SSC and TA models.
11 12 13 14 11 12 13 14 1 2 3 4 5 6 7 8 9 10 11 12 13 14 15 16 17 18 19 20 2122 23 24 25 26 27 28 29 30 Measured SSC (°Brix) Predicted SSC (°Brix) 12,000 10,500 9000 7500 6000 4500 –300 –200 –100 0 100 Regression coefficients Wavenumber (cm–1) Samples 30 Slope 0.868 Offset 1.54 Correlation 0.934 R2 0.881 RMSECV 0.277 (a) 4.0 4.5 5.0 5.5 6.0 6.5 4.0 4.5 5.0 5.5 6.0 6.5 1 2 3 4 5 6 7 8 9 10 11 12 13 14 15 16 17 18 19 20 21 22 23 24 25 26 27 28 29 30 Measured TA (g/L) Predicted TA (g/L) 6150 6000 5850 5700 5550 5400 –300 –150 0 150 300 Regression coefficients Wavenumber (cm–1) Samples 30 Slope 0.831 Offset 0.889 Correlation 0.868 R2 0.761 RMSECV 0.239 (b) 1.5 1.8 2.1 2.4 2.7 1.5 1.8 2.1 2.4 2.7 1 2 3 4 56 7 8 9 10 1112 13 14 1516 17 18 19 20 21 22 23 24 25 26 27 28 29 30 Samples 30 Slope 0.872 Offset 0.283 Correlation 0.913 R2 0.843 RMSECV 0.113 Measured SSC/TA Predicted SSC/TA 6150 6000 5850 5700 5550 5400 –150 –100 –50 0 50 100 Regression coefficients Wavenumber (cm–1) (c)
Figure 2: The results of PLS regression analysis for (a) SSC, (b) TA, and (c) SSC/TA. Left panel: predicted versus measured plots for the cross-validation. Right panel: regression coefficients.
The best model was obtained for the analysis performed on spectra without preprocessing, using the variables selected by the iPLS (NIR) method, in the range of 6224–5350 cm−1 (Figure 2(c)). This model was characterized by the RE of 5.04%. A slightly inferior performance was produced by the models that used spectra without any preprocessing and variables selected using the iPLS (A) or iPLS (B) method in the range of 6137–5334 cm−1. The combination of smoothing and variable selection using the jack-knife method provided a model with intermediate performance (R2of 0.835 and RE of 5.18%).
Summing up, preprocessing and variable selection had a marked effect on the model performance. The two variants of the iPLS method, versions (A) and (B), each based on the same ten intervals, selected similar spectral ranges and provided PLS models with a similar performance. On the contrary, for the parameters studied, using the intervals based on the chemical knowledge of the NIR spectrum of the iPLS (NIR) variant produced better performing models as compared to iPLS (A) or iPLS (B). Application of the jack-knife method enabled selection of variables that gave models with a similar or better performance as compared to the iPLS method.
The iPLS-based models with the best performance for each of the chemical parameters studied used the 6224–5350 cm−1 range (or a similar 6137–5334 cm−1 range), indicating that spectral bands containing chemically significant information on the parameters studied are present in this spectral region. The models for TA and SSC/TA using this range only gave good calibration results, while the calibration model for SSC required additional spectral ranges.
4. Conclusions
In the present study, we developed and optimized the cal-ibration models for the prediction of characteristic pa-rameters in apple juices. We demonstrated that NIR coupled with multivariate calibration is a suitable method for de-termination of the parameters, which are crucial for quality assessment (SSC and TA) and additionally for sweet-sour taste (SSC/TA) evaluation of apple juices. An optimal combination of the mathematical preprocessing of the spectra and selection of the variable range had to be found individually for each of the parameters studied, leading to a significant improvement of the model performance. The usage of an objective variable selection method may speed up the process of model optimization, identifying the spectral ranges with significant chemical information. The identification of the important spectral variables may con-tribute to the development of NIR screening sensors for the quality and sensory-related properties of apple juices. Such applications require further studies on extended sample sets.
Data Availability
The data are available upon request from ewa.sikorska@ue. poznan.pl.
Conflicts of Interest
The authors declare that they have no conflicts of interest.
Acknowledgments
Grant 2016/23/B/NZ9/03591 from the National Science Centre, Poland, is gratefully acknowledged.
References
[1] J. T. Alander, V. Bochko, B. Martinkauppi, S. Saranwong, and T. Mantere, “A review of optical nondestructive visual and near-infrared methods for food quality and safety,”
In-ternational Journal of Spectroscopy, vol. 2013, Article ID
341402, 36 pages, 2013.
[2] H. Cen and Y. He, “Theory and application of near infrared reflectance spectroscopy in determination of food quality,” Trends
in Food Science and Technology, vol. 18, no. 2, pp. 72–83, 2007.
[3] J. U. Porep, D. R. Kammerer, and R. Carle, “On-line appli-cation of near infrared (NIR) spectroscopy in food pro-duction,” Trends in Food Science and Technology, vol. 46, no. 2, pp. 211–230, 2015.
[4] H. Huang, H. Yu, H. Xu, and Y. Ying, “Near infrared spec-troscopy for on/in-line monitoring of quality in foods and beverages: a review,” Journal of Food Engineering, vol. 87, no. 3, pp. 303–313, 2008.
[5] L. Wang, D.-W. Sun, H. Pu, and J.-H. Cheng, “Quality analysis and classification and authentication of liquid foods by near-infrared spectroscopy: a review of recent research developments,” Critical Reviews in Food Science and
Nutri-tion, vol. 57, no. 7, pp. 1524–1538, 2017.
[6] T. Woodcock, C. O’Donnell, and G. Downey, “Review: better quality food and beverages: the role of near infrared spec-troscopy,” Journal of Near Infrared Spectroscopy, vol. 16, no. 1, pp. 1–29, 2008.
[7] M. Manley, “Near-infrared spectroscopy and hyperspectral imaging: non-destructive analysis of biological materials,”
Chemical Society Reviews, vol. 43, no. 24, pp. 8200–8214, 2014.
[8] D. Cozzolino, W. U. Cynkar, N. Shah, and P. Smith, “Mul-tivariate data analysis applied to spectroscopy: potential ap-plication to juice and fruit quality,” Food Research
International, vol. 44, no. 7, pp. 1888–1896, 2011.
[9] J. Engel, J. Gerretzen, E. Szyma´nska et al., “Breaking with trends in pre-processing?,” TrAC Trends in Analytical
Chemistry, vol. 50, pp. 96–106, 2013.
[10] Z. Xiaobo, Z. Jiewen, M. J. W. Povey, M. Holmes, and M. Hanpin, “Variables selection methods in near-infrared spectroscopy,” Analytica Chimica Acta, vol. 667, no. 1-2, pp. 14–32, 2010.
[11] C. M. Andersen and R. Bro, “Variable selection in regression—a tutorial,” Journal of Chemometrics, vol. 24, no. 11-12, pp. 728– 737, 2010.
[12] B. M. Nicola¨ı, K. Beullens, E. Bobelyn et al., “Nondestructive measurement of fruit and vegetable quality by means of NIR spectroscopy: a review,” Postharvest Biology and Technology, vol. 46, no. 2, pp. 99–118, 2007.
[13] L. S. Magwaza, U. L. Opara, H. Nieuwoudt, P. J. R. Cronje, W. Saeys, and B. Nicola¨ı, “NIR spectroscopy applications for internal and external quality analysis of citrus fruit—a review,”
Food and Bioprocess Technology, vol. 5, no. 2, pp. 425–444, 2011.
[14] J.-L. Li, D.-W. Sun, and J.-H. Cheng, “Recent advances in nondestructive analytical techniques for determining the total soluble solids in fruits: a review,” Comprehensive Reviews in
Food Science and Food Safety, vol. 15, no. 5, pp. 897–911, 2016.
[15] H. Wang, J. Peng, C. Xie, Y. Bao, and Y. He, “Fruit quality evaluation using spectroscopy technology: a review,” Sensors, vol. 15, no. 5, pp. 11889–11927, 2015.
[16] V. I. Candrawinata, J. B. Golding, P. D. Roach, and C. E. Stathopoulos, “From apple to juice—the fate of poly-phenolic compounds,” Food Reviews International, vol. 29, no. 3, pp. 276–293, 2013.
[17] S. Fan, B. Zhang, J. Li, W. Huang, and C. Wang, “Effect of spectrum measurement position variation on the robustness of NIR spectroscopy models for soluble solids content of apple,” Biosystems Engineering, vol. 143, pp. 9–19, 2016. [18] M. Schmutzler and C. W. Huck, “Simultaneous detection of
total antioxidant capacity and total soluble solids content by Fourier transform near-infrared (FT-NIR) spectroscopy: a quick and sensitive method for on-site analyses of apples,”
Food Control, vol. 66, pp. 27–37, 2016.
[19] A. Peirs, N. Scheerlinck, K. Touchant, and B. M. Nicolaı̈, “Comparison of Fourier transform and dispersive near-infrared reflectance spectroscopy for apple quality measure-ments,” Biosystems Engineering, vol. 81, no. 3, pp. 305–311, 2002.
[20] Z. Xiaobo, Z. Jiewen, H. Xingyi, and L. Yanxiao, “Use of FT-NIR spectrometry in non-invasive measurements of soluble solid contents (SSC) of ‘Fuji’ apple based on different PLS models,” Chemometrics and Intelligent Laboratory Systems, vol. 87, no. 1, pp. 43–51, 2007.
[21] X. Zou, J. Zhao, and Y. Li, “Selection of the efficient wave-length regions in FT-NIR spectroscopy for determination of SSC of ‘Fuji’ apple based on BiPLS and FiPLS models,”
Vi-brational Spectroscopy, vol. 44, no. 2, pp. 220–227, 2007.
[22] T. Temma, K. Hanamatsu, and F. Shinoki, “Measuring the sugar content of apples and apple juice by near infrared spectroscopy,” Optical Review, vol. 9, no. 2, pp. 40–44, 2002. [23] L. Le´on, J. D. Kelly, and G. Downey, “Detection of apple juice adulteration using near-infrared transflectance spectroscopy,”
Applied Spectroscopy, vol. 59, no. 5, pp. 593–599, 2005.
[24] L. M. Reid, T. Woodcock, C. P. O’Donnell, J. D. Kelly, and G. Downey, “Differentiation of apple juice samples on the basis of heat treatment and variety using chemometric analysis of MIR and NIR data,” Food Research International, vol. 38, no. 10, pp. 1109–1115, 2005.
[25] D. Zhu, B. Ji, Z. Qing, C. Wang, and M. Zude, “The detection of quality deterioration of apple juice by near infrared and fluorescence spectroscopy,” in Computer and Computing
Technologies in Agriculture IV: 4th IFIP TC 12 Conference, CCTA 2010, Nanchang, China, Selected Papers, Part III, D. Li,
Y. Liu, and Y. Chen, Eds., pp. 84–91, Springer, Berlin, Ger-many, 2011.
[26] M. Ye, T. Yue, Y. Yuan, and Z. Li, “Application of FT-NIR spectroscopy to apple wine for rapid simultaneous de-termination of soluble solids content, pH, total acidity, and total ester content,” Food and Bioprocess Technology, vol. 7, no. 10, pp. 3055–3062, 2014.
[27] N. Abu-Khalaf and B. S. Bennedsen, “Near infrared (NIR) technology and multivariate data analysis for sensing taste attributes of apples,” International Agrophysics, vol. 18, pp. 203–211, 2004.
[28] S. Wold, M. Sj¨ostr¨om, and L. Eriksson, “PLS-regression: a basic tool of chemometrics,” Chemometrics and Intelligent
Laboratory Systems, vol. 58, no. 2, pp. 109–130, 2001.
[29] L. Nørgaard, A. Saudland, J. Wagner, J. P. Nielsen, L. Munck, and S. B. Engelsen, “Interval partial least-squares regression (iPLS): a comparative chemometric study with an example from near-infrared spectroscopy,” Applied Spectroscopy, vol. 54, no. 3, pp. 413–419, 2000.
[30] F. Westad and H. Martens, “Variable selection in near in-frared spectroscopy based on significance testing in partial
least squares regression,” Journal of Near Infrared
Spectros-copy, vol. 8, no. 2, pp. 117–124, 2000.
[31] Opus. Spectroscopy Software, Version 6. User Manual. Quant, Bruker Optik GmbH, Ettlingen, Germany, 2006.
[32] G. Giovanelli, N. Sinelli, R. Beghi, R. Guidetti, and E. Casiraghi, “NIR spectroscopy for the optimization of postharvest apple management,” Postharvest Biology and
Technology, vol. 87, pp. 13–20, 2014.
[33] L. Xie, X. Ye, D. Liu, and Y. Ying, “Quantification of glucose, fructose and sucrose in bayberry juice by NIR and PLS,” Food
Chemistry, vol. 114, no. 3, pp. 1135–1140, 2009.
[34] A. F. Omar, H. Atan, and M. Z. MatJafri, “Peak response identification through near-infrared spectroscopy analysis on aqueous sucrose, glucose, and fructose solution,” Spectroscopy
Letters, vol. 45, no. 3, pp. 190–201, 2012.
[35] J. Wu, H. Gao, L. Zhao et al., “Chemical compositional characterization of some apple cultivars,” Food Chemistry, vol. 103, no. 1, pp. 88–93, 2007.
[36] F. J. Rambla, S. Garrigues, and M. de la Guardia, “PLS-NIR determination of total sugar, glucose, fructose and sucrose in aqueous solutions of fruit juices,” Analytica Chimica Acta, vol. 344, no. 1, pp. 41–53, 1997.
[37] European Fruit Juice Association, AIJN Code of Practice for the
Evaluation of Fruit and Vegetable Juice, European Fruit Juice
Tribology
Advances in Hindawi www.hindawi.com Volume 2018 Hindawi www.hindawi.com Volume 2018International Journal ofInternational Journal of
Photoenergy
Hindawi www.hindawi.com Volume 2018 Journal ofChemistry
Hindawi www.hindawi.com Volume 2018 Advances inPhysical Chemistry
Hindawi www.hindawi.com Analytical Methods in Chemistry Journal of Volume 2018 Bioinorganic Chemistry and Applications Hindawi www.hindawi.com Volume 2018Spectroscopy
International Journal of Hindawiwww.hindawi.com Volume 2018
Hindawi Publishing Corporation
http://www.hindawi.com Volume 2013 Hindawi www.hindawi.com
The Scientific
World Journal
Volume 2018Medicinal ChemistryInternational Journal of Hindawi www.hindawi.com Volume 2018
Nanotechnology
Hindawi www.hindawi.com Volume 2018 Journal ofApplied Chemistry
Journal of Hindawi www.hindawi.com Volume 2018 Hindawi www.hindawi.com Volume 2018 Biochemistry Research International Hindawi www.hindawi.com Volume 2018Enzyme
Research
Hindawi www.hindawi.com Volume 2018 Journal ofSpectroscopy
Analytical Chemistry International Journal of Hindawi www.hindawi.com Volume 2018Materials
Journal of Hindawi www.hindawi.com Volume 2018 Hindawi www.hindawi.com Volume 2018 BioMedResearch International
Electrochemistry
International Journal of Hindawi www.hindawi.com Volume 2018