Caminhos de Geografia Uberlândia v. 13, n. 43 out/2012 p. 326–334 Página 326 FLOODPLAIN PLANNING BASED ON STATISTICAL ANALYSIS OF TILPARA BARRAGE
DISCHARGE: A CASE STUDY ON MAYURAKSHI RIVER BASIN1
Vibhash Chandra Jha Department of Geography, Visva-Bharati University [email protected] Haraprasad Bairagya Department of Geography, Visva-Bharati University [email protected]
ABSTRACT
Floods in the West Bengal are responsible for colossal loss of human life, crops, and property. In recent years, various measures of flood control and management have been adopted. However, flooding in such rivers like Brahmani profoundly challenges flood-hazard management, because of the inadequacy of conventional data and high spatio-temporal variability of floods. To understand flood hazards and environmental change it is imperative that engineers and hydrologists utilize historical and paleoflood records to improve risk analyses as well as to estimate probable maximum flood on rivers such as these in a highly flood-prone region(Parkar,2000). The flood frequency analysis, probable peak discharge analysis, its return period analysis and floodplain zoning based on ancillary data will help better management of flood in the Mayurakshi River basin situated in the districts of Birbhum and Murshidabad.
Keywords: Flood Frequency, Gamble’s Method, Return Period, Floodplain zoning.
INTRODUCTION
Flood is such a natural phenomenon that is uncontrollable and, to some extent, unpredictable .It seems to be strange and mysterious too. Man has been toiling for ages to control flood, but all in vain. Man must acquaint himself with the characteristics of floods if he is to control them. Floods vary as the weather differs from month to month and year to year. The first step in becoming better acquainted with flood is to measure them. When this has been done and record is available for a long period of time, analytical studies will provide a better understanding of the phenomenon (CHOW, 1964).
The rivers of the south-eastern part of the Indian Peninsula are monsoonal in nature. These rivers are subjected to severe floods during the monsoon season. In the last few decades, several
large-magnitude floods (peak floods between 10,000 and 80,000 m3/s) have been recorded. In general,
floods caused by precipitation from Bay of Bengal depressions include the peak flood of record. Analyses of the systematic, historical, and paleoflood records indicate that, in recent decades, the frequency of high-magnitude floods has increased significantly. Hydraulic estimates reveal that high flows are capable of bedrock erosion and transportation of coarse material (KRON, 2005). Owing to its barrage discharge from Tilpara the river Mayurakshi plays an important role to create flood devastation in the districts of Birbhum and Murshidabad. It helps to create stagnation of water and more flood duration at Hijol (a large marshy land) area also. Amongst the different measures of flood, flood frequency analysis is indispensable for floodplain planning, management and to protect the human civilization from flood disaster for ever.
1
Recebido em 12/06/2012
Caminhos de Geografia Uberlândia v. 13, n. 43 out/2012 p. 326–334 Página 327 LOCATION
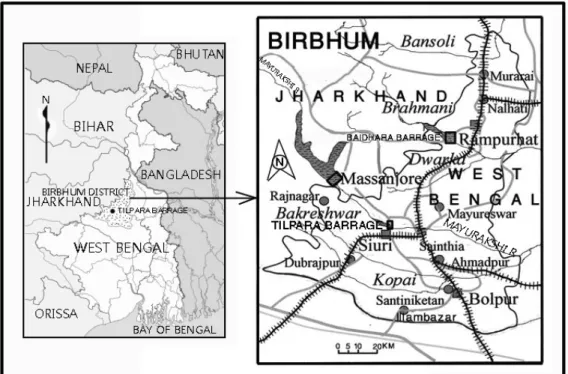
The Mayurakshi River is a tributary of the Bhagirathi River. The Mayurakshi originates from Dumka District in Jharkhand and then flows through Birbhum district, bisecting Suri subdivision (ROY, 1985). It then flows through Murshidabad district, where it joins the Dwarka River. The Tilpara Barrage is located in 3kms away from Suri town. It is a hill stream with beds full of pebbles and yellow clay.
Figure 1: Study area.
Table 1: At a glance Tilpara Barrage. TILPARA BARRAGE
Location Near Suri, District Birbhum on the river Mayurakshi
Total Catchment Area including the catchment of Massanjore Dam
5067sq. km.
Width Between Abutments 308.84 m
Number of Weir Bays 7 (Width 18.29 m Each) + Under Sluices 8 (Width 18.29 m Each)
Linear Water Way 274.39 m
Optimum Pond Level 64.33 m
Design Upstream Water Level 64.33 m
Design Discharge 8,495 cumecs
Canal Discharge 99.11 cumecs
Length of Main Canal a) Left 16.62 km
b) Right 22.53 km
Irrigable Area a) Kharif 2,26,629 Ha
b) Rabi 20,250 Ha
Birbhum, Murshidabad & Burdwan Maximum Irrigation Achieved a) Kharif 2,20,730 Ha
b) Rabi 8,150 Ha c) Boro 25,400 Ha Source: wbiwd.gov.in/irrigation_sector/major/stats/mayurakshi_stats.htm
Caminhos de Geografia Uberlândia v. 13, n. 43 out/2012 p. 326–334 Página 328 Plate 1: Tilpara Barrage.
FLOOD FREQUENCY ANALYSIS OF MAYURAKSHI RIVER BY GUMBLE’S METHOD
Chow et al. (1951) has shown that most frequency – distribution functions applicable in hydrologic studies can be expressed by the following equation known as the general equation of hydrologic flood frequency analysis:
XT =X¯ +K. Sd
Where, XT = value of the variate X of a random hydraulogic series with a return period T, X¯ = mean of the variate, Sd= standard deviation of the variate, k= frequency factor which depends
upon the return period, T and the assumed frequency distribution. The commonly used frequency distribution function for the prediction of extreme flood values is the Gumble’s method.
This extreme flood value distribution was introduced by Gumble (1941) and is commonly known as Gumble’s distribution .It is the most widely used probability distribution function for extreme values in hydrologic studies and meteorological studies for the prediction of flood peaks, maximum rainfall, maximum wind speed etc.
Gumble defined a flood as the largest of the 365 daily flows and the peak annual series of flood flows (SUBRAMANYA, 1999). The general formula for the prediction of extreme flood values and its probability of occurrence, is given by Gumble as below:
Qp = Q¯ +K. Sd n-1
Where Qp =Probable Peak Discharge, Sd n-1 =Standerd Deviation of the sample size N = √∑ (Q¯ -Q) ²/√N-1
Q¯ = Average Flood discharge, K =Frequency factor expressed as
K =Yt-Y¯ n/Sn In which Yt = reduced variate, a function of T and is given by Yt = - [In.In T/T-1]
Or, Yt= -(0.834+2.303LogLogT/T-1)
Yn = reduced mean, a function of sample size N.
Caminhos de Geografia Uberlândia v. 13, n. 43 out/2012 p. 326–334 Página 329
The value of Yn and Sn is given in Gumble’s extreme value distribution table (table 2 and 3):
Table 2: Reduced mean Yn in gumble’s extreme value distribution (Sample Size N).
N 0 1 2 3 4 5 6 7 8 9 10 .4952 .4996 .5053 .5070 .5100 .5128 .5157 .5181 .5202 .5520 20 .5236 .5252 .5268 .5283 .5296 .5309 .5320 .5332 .5343 .5353 30 .5362 .5371 .5380 .5388 .5396 .5402 .5410 .5418 .5424 .5430 40 .5436 .5442 .5448 .5453 .5458 .5463 .5468 .5473 .5477 .5481 50 .5485 .5489 .5493 .5497 .5501 .5504 .5508 .5511 .5515 .5518
Table 3: Reduced standard deviation Sn in Gumble’s extreme value distribution.
N 0 1 2 3 4 5 6 7 8 9 10 .9496 .9676 .9833 .9971 1.0095 1.0206 1.0316 1.0411 1.0493 1.0565 20 1.0628 1.0696 1.0754 1.0811 1.0864 1.0915 1.0961 1.1004 1.1047 1.1086 30 1.1124 1.1159 1.1193 1.1226 1.1255 1.1285 1.1313 1.1339 1.1363 1.1388 40 1.1413 1.1436 1.1458 1.1480 1.1499 1.1519 1.1538 1.1557 1.1574 1.1590 50 1.1607 1.1623 1.1638 1.1658 1.1667 1.1681 1.1696 1.1708 1.1721 1.1734 Source: S.K.Garg (2007), pp.461-168
FLOOD FREQUENCY AND PEAK DISCHARGE ANALYSIS OF RIVER MAYURAKSHI BY GUMBLE’S FORMULA AT TILPARA
Massanjore dam highly influences the discharge of Tilpara Barrage. The water is reduced form the dam and it is stored in the barrage according to its need. So mainly Tilpara barrage controls the flood condition of the entire basin. Here peak annual flood flow collected from Tilpara gauge station is taken into consideration as in the table 4.
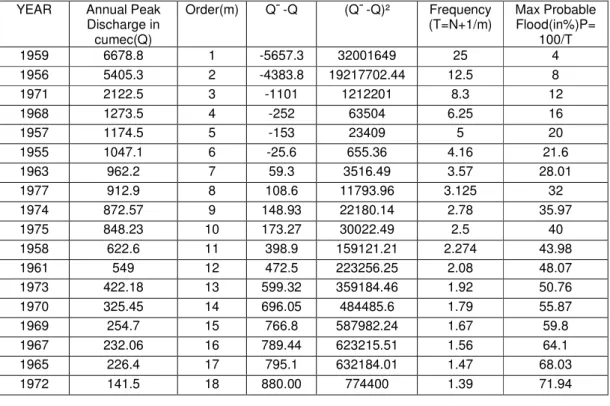
Table 4: Flood frequency analysis by Gumble’s formula in river Mayurakshi at Tilpara Barrage.
YEAR Annual Peak Discharge in cumec(Q) Order(m) Q¯ -Q (Q¯ -Q)² Frequency (T=N+1/m) Max Probable Flood(in%)P= 100/T 1959 6678.8 1 -5657.3 32001649 25 4 1956 5405.3 2 -4383.8 19217702.44 12.5 8 1971 2122.5 3 -1101 1212201 8.3 12 1968 1273.5 4 -252 63504 6.25 16 1957 1174.5 5 -153 23409 5 20 1955 1047.1 6 -25.6 655.36 4.16 21.6 1963 962.2 7 59.3 3516.49 3.57 28.01 1977 912.9 8 108.6 11793.96 3.125 32 1974 872.57 9 148.93 22180.14 2.78 35.97 1975 848.23 10 173.27 30022.49 2.5 40 1958 622.6 11 398.9 159121.21 2.274 43.98 1961 549 12 472.5 223256.25 2.08 48.07 1973 422.18 13 599.32 359184.46 1.92 50.76 1970 325.45 14 696.05 484485.6 1.79 55.87 1969 254.7 15 766.8 587982.24 1.67 59.8 1967 232.06 16 789.44 623215.51 1.56 64.1 1965 226.4 17 795.1 632184.01 1.47 68.03 1972 141.5 18 880.00 774400 1.39 71.94
Caminhos de Geografia Uberlândia v. 13, n. 43 out/2012 p. 326–334 Página 330 Source: Investigation and Planning Circle-1, Irrigation and Waterways Directorate, Govt.of W.B, Baharampore
It is notable that here the discharge is depended on the reduction of water from the barrage .The flood condition of the Mayurakshi basin is proved by the discharge frequency curve as follows (figure 2).
Figure 2: Discharge frequency curve of river Mayurakshi at Tilpara Barrage.
Calculation
Mean discharge=Q¯ =∑ Q/ N =24516.79/24=1021.5 Standard Deviation= Sdn-1 = √∑ (Q¯ -Q) ²/√N-1
= √61836367.88/√24- 1 =√2688537.73=1639.68
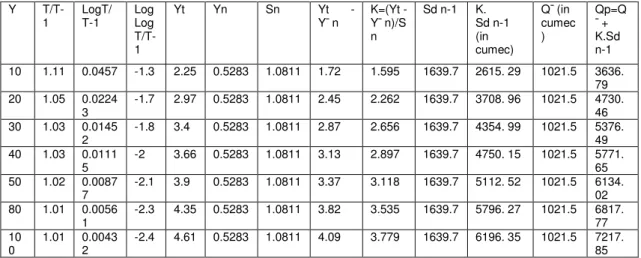
Now, Gumble’s Frequency Factor, K= (Yt-Y¯ n)/Sn and Probable Peak Discharge, Qp= Q¯ +K. Sd n-1 can be calculated as follows (where Y¯ n=expected Mean, Sn=expected Standerd Deviation collected from Gumble’s table (table 5) and Yt= -(in.in.T/T-1) = -(0.834+2.303logLogT/T-1).
Where, Y=Flood Frequency (In Years) Yt= -(.834+2.303LogLogT/T-1), Yn=Expected Reduced Mean (From GUMBLE'S Table), Expected Reduced SD= Sn (From GUMBLE'S Table), K= Frequency Factor ,Qp= Probable Peak Discharge (in cumec)
From the table the magnitude of flood having frequency of 10,20,30,40,50,80,100 years are calculated as 3636.79, 4730.46, 5376.49, 5771.65, 6134.02, 6817.77, 7217.85 cumec respectively. So here we assume that the magnitude of peak flood discharge must be less than 7217.85 cumec in the entire basin. The probability of returning flood with a discharge of 3636.79 cumec is 10 years. After the calculation of peak discharge with its return period the probable inundated catchment area will also be calculated by Dicken’s formula-
1962 113.2 19 908.3 825008.89 1.32 75.76 1960 90.56 20 930.94 866649.28 1.25 80 1964 84.9 21 936.6 877219.56 1.19 84.03 1976 75.98 22 945.52 911108.43 1.364 88.13 1954 56.6 23 964.9 931032.01 1.086 92.08 1966 24.06 24 997.44 994886.55 1.042 95.97 Total ∑Q= 24516.79 61836367.88
Caminhos de Geografia Uberlândia v. 13, n. 43 out/2012 p. 326–334 Página 331 Table 5: Calculation of probable peak discharge of Mayurakshi River at Tilpara Barrage.
Dicken’s Formula
This formula is generally used for the catchments of north India and states that: QP = CA3/4
Where QP =High flood or peak discharge in cumec
A = Catchment area in sq.km.
C = A constant, depending upon these entire fifteen to twenty factor, which affect high flood discharge (According to Dicken it will be -14).
Table 6: Flood frequency. Flood Frequency (In Years) QP C QP/C A(km²)=3/4√ QP/C 10 3636.79 14.0 259.77 1657.494 50 6134.02 14.0 438.14 3327.749 100 7217.85 14.0 515.56 4134.017
With corresponding to return period of 10,50 and 100 it may be predicted that the probable catchment area to be inundated during those return period are 1657.494km², 3327.749km², and 4134.017km² respectively. Flood plain zoning is required in this basin for proper planning and development with the help of ancillary data.
FLOOD PLAIN PLANNING
Inspite of adopting the best and economically feasible structural methods for controlling floods; it is generally not possible to control them totally. Man must therefore, learn to live with floods (Dikshit, 1983). Eventually, whenever, a river flows, it will occupy some land area, which will increase when the river carries more discharge. In other words, the land which is dry during dry weather flow or during low floods in the river will also get flooded during higher floods. One cannot, therefore, be sure as to which land will get flooded in a particular year or at a particular time.
The main aim of flood plain planning is to use of floodplain properly and to reduce damage during flood. Here the study of flood intensity, probable peak discharge, affected catchment area etc. are important to reduce death and damage in the floodplain. It needs regional division of the flood as it
Y T/T-1 LogT/ T-1 Log Log T/T-1 Yt Yn Sn Yt -Y¯ n K=(Yt -Y¯ n)/S n Sd n-1 K. Sd n-1 (in cumec) Q¯ (in cumec ) Qp=Q ¯ + K.Sd n-1 10 1.11 0.0457 -1.3 2.25 0.5283 1.0811 1.72 1.595 1639.7 2615. 29 1021.5 3636. 79 20 1.05 0.0224 3 -1.7 2.97 0.5283 1.0811 2.45 2.262 1639.7 3708. 96 1021.5 4730. 46 30 1.03 0.0145 2 -1.8 3.4 0.5283 1.0811 2.87 2.656 1639.7 4354. 99 1021.5 5376. 49 40 1.03 0.0111 5 -2 3.66 0.5283 1.0811 3.13 2.897 1639.7 4750. 15 1021.5 5771. 65 50 1.02 0.0087 7 -2.1 3.9 0.5283 1.0811 3.37 3.118 1639.7 5112. 52 1021.5 6134. 02 80 1.01 0.0056 1 -2.3 4.35 0.5283 1.0811 3.82 3.535 1639.7 5796. 27 1021.5 6817. 77 10 0 1.01 0.0043 2 -2.4 4.61 0.5283 1.0811 4.09 3.779 1639.7 6196. 35 1021.5 7217. 85
Caminhos de Geografia Uberlândia v. 13, n. 43 out/2012 p. 326–334 Página 332
is mentioned by Central Water Commission (CWC) of India in 1975.The suggestions are permitted by Central Flood Control Commission and ‘Central Bar Ayog’ in1980 also.
Process
We can still, however, demarcate areas, which would be susceptible to particular flood frequency. In other words, we can work out, say 1, 5, 10, 50,100 year frequency floods, and then mark the zones or areas which would come under water during such floods. The areas under 1 year flood will evidently be less than the area under 5-years flood; and the area under 5- years flood will be less than the area under 10-years flood; and so on and so forth.
The area, which on an average is, thus, liable to flood every year (i.e. by 1 year frequency flood) will be most susceptible to flooding and must be left isolated and free of use. The additional area, which is liable to flood once in two years (i.e. with 2 year frequency flood) would thus, be less prone to flooding as compared with the area liable to be encompassed by one year frequency flood, and so on. We can, thus, demarcate areas which would be extremely flood prone, and those which comparatively would be less flood-prone.
The entire area (i.e. flood plain) can thus, be divided into zones, specifying restrictive uses for each, depending upon its proneness to flooding.
Say for example, the area which is yearly prone to flooding, may be put only to agricultural uses; but the crops or vegetables grown there should be such that they are harvested well before the start of the rainy-season (i.e. well before a flood occurs into the river ). No structures or buildings would be raised in such highly flood prone areas, as otherwise, the life and property would on an average, be washed away every year, and will need yearly evacuation with loss of life and valuable assets. It is therefore, prevention for municipalities to demarcate such flood zones, and issue ordinances, specifying uses for particular for being left isolated or at the most for temporary uses, and the higher flood proof areas, (closer to river), can be specified for being left isolated or at the most for temporary uses, and the higher flood proof areas, (away from the river) may be specified for costlier building constructions. Moderately flood prone areas can be used for raising structures, which are either temporary or less liable to permanent damage by floods, such as, bus terminals, temples, farm houses, etc.
On the basis of such demarcation and divisions, we can broadly classify the areas into three zones, i.e.
(i) Prohibitive Zone;
(ii) Restrictive Zone; and
(iii) Warning Zone.
Intermediate zones can also sometimes be specified.
Prohibitive zones would certainly be the one in which no building activity is to be permitted, as the
area specified in this zone would be highly susceptible to flooding, and would, thus, extend on both sides of the active river channel. This flood plain of the river should in no case be allowed to be encroached upon by juggins, etc. and at the most be allowed for temporary agricultural uses, or for developing recreational facilities like swimming, bathing, boating, parks, etc.
Restrictive zone is moderately flood prone area, and the flood waters would enter into this areas
only once in 10 years or 50 years say, and that too very slowly. The flood hazard is, thus, lesser in this area, and the area can be allowed for construction of less populated and less costly buildings, or for those structures which are damaged to lesser extent by floods. Thus, temples, groundwater, specified factories, bus terminals, etc. can be specified to be located in this zone.
Warning zone is which would be safe to floods up to the design flood. This area may come under
Caminhos de Geografia Uberlândia v. 13, n. 43 out/2012 p. 326–334 Página 333
Almost all activities can be permitted in this area, with suitable planning precautions (DASGUPTA,2002).
After calculating the return period, probable peak discharge and probable inundated catchment area in the Mayurakshi river basin, amongst the total 5067km² area, almost 1657.494km² area surrounding the river track may be designed as the high flood prone zone or Prohibitive Zone, 1657.494km²-3327.749km² can be considered as the moderate flood prone zone or Restrictive
Zone, more than 3327.749km²-4134.017km² areas can be remarked as the low flood prone zone or Warning Zone and the remaining area will be flood free
Bulk of flood damages can, thus, be prevented or reduced by adopting and strictly implementing such flood plain zoning.
From the above discussion it is said that though the flood intensity is more but the flood-prone catchment will be lesser if the flood will be properly managed. Human encroachment along the river side or resided at the Prohibitive Zone has a chance to be inundated every year due to its lesser return period and its location in the high flood prone region but the others will be saved. The embankment established along the river Brahmani can save the livelihood of the peoples resided at upper or middle basin. Thus floodplain zoning is quite easier in this basin with the help of numerical analysis of the study area as it is done.
CONCLUSION
Floodplain planning has recently been raised in our country, and our central government has prepared a model bill laying down guidelines for regulating urban and rural developments in flood plains but the proper utilization of Gumble’s method or Dicken’s formula can help a lot to serve the purpose. The flood of entire Mayurakshi River basin can be managed easily by the proper implementation of flood frequency analysis, probable peak discharge analysis and catchment area analysis based on barrage discharge from Tilpara which is the principle regulator of flood in the entire basin. Flood plain zoning through these numerical processes are not yet been done in the Brahmani’s river catchments also due to ignorance of the irrigation department of West Bengal for which flood is occurring frequently in unsustainable manner. If these measures are properly implemented then the flood in this river basin will no longer remain as the pain of the dwellers.
REFERENCES
CHOW, V. T.; MAIDMENT, D. R.; MAYS, L. W. Handbook of Applied Hydrology, International Edition, McGraw-Hill Company, New York, Sec-25, 1964, pp.1-124
DASGUPTA, A. West Bengal: Flood Problem Solution and Warning, Sechpatra, Journal, Irrigation and Waterways Directorate, Govt of West Bengal, Kolkata, 2002, pp.12-15
DIKSHIT, K. R. Geomorphology Techniques and Applications Geomorphology, Heritage Publishers, New Delhi, 1983, pp.330-354
GARG, S. K. Hydrology and Water Resources Engineering, Khanna Publishers, New Delhi,
2007, pp. 441-490.
Irrigation and Waterways Directorate, Kandi Area, Flood Protection Scheme, Report,
Estimate and Drawing, Investigation and Planning Circle –1, Govt. of West Bengal, Kolkata, March 1992, pp.1-4
KRON, W. Flood Risk = Hazard • Values • Vulnerability, Water International, Volume 30, Issue
1, Routledge publication,2005, DOI: 10.1080/02508060508691837, pp.68
http://portal.worldwaterforum5.rg/wwf5/en-us/Panels/High-Le
O’ MALLY, L. S. S. Rivers of Bengal, Bengal District Gazetteers, 1914, Reprint, 1997 pp.1-25, pp.97-154, and pp.177-204.
Caminhos de Geografia Uberlândia v. 13, n. 43 out/2012 p. 326–334 Página 334
Parker, D. J. Floods (Vol-I&II), Routledge Hazards and Disaster Series, Taylor and Francis Group, London and New York, 2000, Vol-I, pp.4-16,pp.28-32,pp.318-330,Vol-II,pp.46-66,pp.276-307. ROY, S.K. Flood Frequency Studies For Bhagirthi River (West Bengal), Dissertation, Master of Engineering in Hydrology, UNESCO Sponsored, International Hydrology Course, University of Roorkee (INDIA), 1985,pp.48-53
SUBRAMANYA, K. Engineering Hydrology, Second Edition, Tata McGraw-Hill Publishing Comp. Ltd, 1999, pp.233-261