Hong Kong, China, December 7 – 9, 2016
MECHANICS OF DISTORTIONAL-GLOBAL INTERACTION IN
FIXED-ENDED LIPPED CHANNEL COLUMNS
André D. MARTINS1, Dinar CAMOTIM1, Rodrigo GONÇALVES2 and Pedro B. DINIS1
1CERIS, ICIST, DECivil, Instituto Superior Técnico, Universidade de Lisboa, Portugal 2CERIS, ICIST and Universidade Nova de Lisboa, Portugal
Emails: [email protected], [email protected], [email protected], [email protected]
Keywords: Fixed-ended lipped channel columns; Distortional-Global interaction; Generalized Beam Theory (GBT); Geometrically non-linear imperfect analysis (GNIA).
Abstract. This work reports the results of a numerical investigation concerning the elastic post-buckling behaviour of fixed-ended thin-walled lipped channel columns affected by distortional-global (D-G) interaction. The columns analysed (i) exhibit cross-section dimensions and lengths ensuring simultaneous distortional and global critical buckling loads, and (ii) contain critical-mode initial geometrical imperfections (linear combinations of D and G buckling modes). For comparison and clarification purposes, the post-buckling behaviour of columns buckling in an “isolated” distortional mode and containing “pure” distortional and global (flexural-torsional) initial geometrical imperfections are also analysed. The results presented and discussed are obtained through geometrically non-linear Generalised Beam Theory (GBT) analyses and provide the evolution, along given equilibrium paths, of the column deformed configuration (expressed in GBT modal form), relevant displacement profiles and modal participation diagrams, making it possible to acquire in-depth knowledge on the column D-G interaction mechanics. Finally, particular attention is paid to interpreting the differences exhibited by the several aforementioned column post-buckling behaviours.
1 INTRODUCTION
Cold-formed steel (CFS) open-section thin-walled members, namely columns, exhibit geometries (cross-section dimensions and lengths) that often make them highly susceptible to several instabilities involving individual (local, distortional, global – L, D, G) and/or coupled (L-D, L-G, D-G or L-D-G) buckling modes. In fact, the efficient design of such member constitutes a very complex task, since mode interaction phenomena may occur even when the associated critical buckling loadings are significantly apart. Therefore, in order to assess the structural response of such members it does not suffice to acquire in-depth knowledge about their “pure”/individual buckling and post-buckling behaviours. Indeed, it is indispensable to account for the possible occurrence of several mode coupling effects, which may erode, to a smaller or larger amount extent (depending on the slenderness), the member ultimate strength failing to do it may lead to a high likelihood of reaching unsafe designs.
As far as interaction phenomena involving distortional buckling in CFS columns are concerned (e.g., Camotim & Dinis [1]), most of the existing studies, comprising experimental investigations, numerical simulations and/or design proposals, deal with L-D interaction – it is worth mentioning the works of Kwon & Hancock [2], Young et al. [3] and Martins et al. [4-6]. However, the amount of research available on D-G interaction is much scarcer. Indeed, to the authors’ best knowledge, the works addressing the influence of this coupling phenomenon on the post-buckling behaviour and
André D. MARTINS et al.
ultimate strength of CFS columns consist of (i) experimental investigations on rack-section uprights,
with and without holes (Crisan et al. [7], Dubina et al. [8]), lipped channel columns (Santos et al.
[9]1) and, more recently, web-stiffened lipped channel columns (Anbarasu & Murugapandian [10])2,
and(ii)the numerical (shellfiniteelement)investigationsonsimplysupported(locally/globallypinned
end cross-sections with and free or prevented warping) and fixed-ended lipped channel columns
(Dinis & Camotim [13, 14]), and simplysupported and warping-prevented rack-section uprights, with
or without holes (Crisan et al. [15]). Although all the above studies provided clear evidence of the
detrimental influence of D-G interaction on the column strength, an investigation on the mechanics of
this coupling phenomenon is still lacking – this work aims at contributing towards filling this gap.
The results presented and discussed in this work are obtained by means geometrically non-linear imperfect analyses (GNIA) based on Generalized Beam Theory (GBT) analysis, a one-dimensional bar theory for prismatic thin-walled members that exhibits the accuracy of shell finite element models and yields clarifying modal solutions that provide in-depth insight on the mechanics of the problem
under consideration (e.g., Camotim et al. [16]). This feature makes GBT-based GNIA ideally suited
to investigate mode interaction problems, which involve deformation of various different natures.
This work addresses the elastic post-buckling behaviour of fixed-ended lipped channel columns undergoing D-G interaction. The columns analysed (i) exhibit cross-section dimensions and lengths ensuring simultaneous distortional and global critical buckling (true D-G interaction), and (ii) contain
critical-mode initial geometrical imperfections with amplitude equal to L/1000 (L is the column
length) they consist of linear combinations of D and G buckling modes, provided by preliminary
GBT buckling analyses. For comparison and clarification purposes, the post-buckling behaviour of
columns buckling in an “isolated” distortional mode and containing “pure” distortional and global
(flexural-torsional) initial geometrical imperfections are also analysed. The GBT-based GNIA results,
which are validated through the comparison with values yielded by ABAQUS [17] shell finite element
analyses (SFEA), provide the evolution, along given equilibrium paths, of the column deformed configuration (expressed in GBT modal form), relevant displacement profiles and stress distributions, making it possible to acquire in-depth knowledge on the column D-G interaction mechanics. Finally, particular attention is devoted to interpreting the differences exhibited by the several aforementioned column post-buckling behaviours.
2 REVIEW OF THE GBT GEOMETRICALLY NON-LINEAR FORMULATION
The performance of a GBT structural analysis involves two (independent) main tasks, namely (i) a cross-section analysis, leading to the determination of the deformation modes and evaluation of the corresponding modal mechanical properties, and (ii) a member analysis (elastic buckling and
post-bucklinganalyses,inthiscase).The geometrically non-linear GBT formulation recently developed by
the authors (Martins et al. [18]) is reviewed next, after which a description of the deformations modes
most relevant to the analysis of the lipped channel columns undergoing D-G interaction is provided.
2.1 Formulation, finite element approximation and solution procedure
The member mid-surface displacement field is expressed as products of two one-dimensional
functions, namely (i) the deformation mode shapes (u sk( ),v sk( )and/orw sk( )– obtained from the
cross-section analysis,briefly discussed in Section 2.2) and (ii) the modal amplitude functions k( )x , which
constitute the member analysis unknowns. One then has
,
( , ) k( ) k x( ) ( , ) k( ) ( )k ( , ) k( ) ( )k
u x s u s x v x s v s x w x s w s x (1)
where (i) (.),x≡d(.)/dx and (ii) Einstein’s summation convention applies to subscript k– the initial geometrical imperfections incorporated in the analyses follow the same trends. The kinematic
(strain-displacement) relationships adopted are similar to those considered by Gonçalves & Camotim [19]
and Kwon & Hancock [20] (GBT and finite strip non-linear analyses, respectively) and read
2 2 2
2 2 2
, , , , , , , , , ,
1 1
2 2
xx ux zwxx ux vx wx ux zwxx ux vx wx
(2.1)
2 2 2
2 2 2
, , , , , , , , , ,
1 1
2 2
ss vs zwss us vs ws vs zwss us vs ws
(2.2)
, , 2 , , , , , , , , , 2 , , , , , , ,
xs us vx zwxs u ux s v vx s w wx s us vx zwxs u ux s v vx s w wx s
(2.3)
The member strain energy, expressed in terms of the strain and stress components, is given by
1 2 3 1 2 3
1 2V ij ij
U
dV U U U U U U (3)where Ui and U ii ( 1,2,3)are the strain energy terms associated with the total deformation and
initial geometric imperfections, respectively (see the details in [18]).
Themodalamplitudefunctionsappearingin(3)areapproximatedthrough 4-node beam finite
elements based on approximation functions that are linear combinations of:
(i) Lagrange cubic polynomial primitives iL( ),i1,...,4, for the (warping only) axial extension
and shear modes, which read (dk1k x, (0),dk2k x, (Le / 3),dk3k x, (2Le/ 3),dk4k x, (Le))
, ( ) 1, 1 2, 2 3, 3 4, 4
L L L L
j x x xdj xdj xdj xdj
(4.1)
(ii) Hermite cubic polynomials H( ), 1,...,4
i i
, for the remaining (conventional and transverse
extension) deformation modes3, given by (
1 , (0), 2 (0), 3 , ( ), 4 ( )
k k x k k k k x e k k e
d d d L d L )
1 1 2 2 3 3 4 4
( ) H H H H
k x dk dk dk dk
(4.2)
The component of the finite element internal force vector concerning deformation mode h and dof
( e h
f) is obtained by incorporating (4.1)-(4.2) into the strain energy (3) and differentiating with
respect to dh, to obtain
1 2 3 1 2 3
e
h h h h h h h
h
U
f f f f f f f
d
(5.1)
where, after some manipulation,
1 1
h hi i
f T d (5.2)
2 1 2
2
h hi i
f Td (5.3)
3 1 3
3
h hi i
f Td (5.4)
1 1
h hi i
f T d (5.5)
2 2 211 000 110 200 011
222 121 022 112
1 1 1 1
2 2 2 2
1 1 1
2 2 2
I I I I II II
h hi i hij hij hij hij hij hij
II II III IV
hij hij hij ijh i j
f T d C k B k D k E k E B k
+ C k D k E k E k d d
(5.6)
André D. MARTINS et al.
3 3
h hi i
f T d (5.7)
and
(i) 1
hi
T ,Thi2,
3
hi
T ,Thi2,
3
hi
T are the components of the tangent stiffness matrix (details in [18]) –
the elementary tangent stiffness matrix components are given by
1
0
hi
T
1 2 3 2 3
e
hi hi hi hi hi hi
T T T T T T (6)
(ii) ChijI ,ChijII,BhijI ,BhijII,DhijI ,DhijII,EhijI ,EhijII,EhijIII,EhijIV are third-order tensors concerning the geometrically
non-linear behaviour – the second and four-order tensors are also necessary to evaluate the
components of the tangent stiffness matrix defined in the previous item [18].
(iii) The reduced stiffness terms abc
k are defined by
b c
a abc
a b c
Le
k dx
x x x
(7)i.e., another expression involving the product of shape functions and/or derivatives is required to
evaluate the components of the tangent stiffness matrix defined in item (i).
The incremental-iterative procedure employed is based on (i) Newton-Raphson’s method and (ii) a
load or arc-length control strategy (e.g., Crisfield [21] or Ritto-Corrêa & Camotim [22]) – both
strategieswereimplementedandit is worth noting that (i) vector components f1hand f2h depend
on the initial geometrical imperfection (see eq. (5.6)) and (ii) the tangent stiffness components
1 2
,
hi hi
T T and Thi3are constant and, thus, need to be evaluated only once (before the
incremental-iterativeprocedure). The numerical integration is performed (i) analytically through the thickness
(along z) and (ii) using the Legendre-Gauss Quadrature with three-point integration along x and y.
2.2 Cross-section analysis
The GBT cross-section analysis involves a lengthy set of fairly complex operations which has
been reported in the literature4 and the most recent developments can be found in the works of
Gonçalves et al. [23] and Bebiano et al. [24] the latter provides the fundamentals of the procedure
implemented in version 2.0 of code GBTUL (Bebiano et al. [25]). The deformation modes are divided
into three main sets/families: (i) conventional(orVlasov),(ii)shearand(iii)transverseextensions
(TE)deformation modes. As far as the TE deformation modes are concerned, they can still be divided
into linear and quadratic – the latter, not addressed in the above references, play a pivotal role in
post-buckling analyses, since they make it possible to capture the Poisson effects, thus precluding overly
stiff solutions (Gonçalves & Camotim [19]). The quadratic TE deformations modes are defined, in
each wall segment i, by 2
( ) ( 1)
i i
v b and are null in all remaining wall segments (ji) bi and
/ i
y b
denote the wall segment width and a normalised coordinate along it.
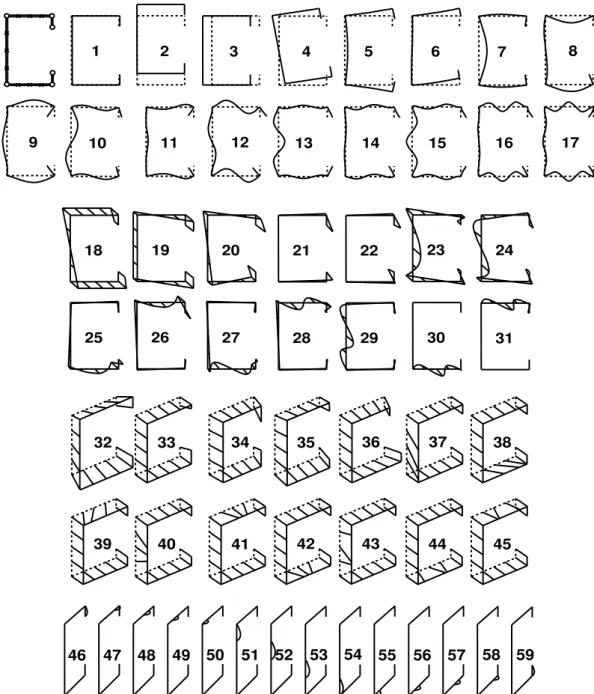
Figure 1 shows the GBT nodal discretisation adopted in this work, which involves 15 nodes
(6 natural and 9 intermediate 3 per flange and 3 in the web), and leads to (i) 17 conventional modes
(4 global, 2 distortional and 11 local modes 1-17 in Fig. 1), (ii) 14 shear modes (5 global and 9 local
modes 18-31 in Fig. 1), (iii) 14 linear transverse extension modes (1 global isotropic, 4 global
deviatoric and 9 local modes 32-45 in Fig. 1) and (iv) 14 quadratic transverse extension modes
(modes 46-59 in Fig. 1), totalling 59 (sequentially numbered) deformation modes.
BUCKLING ANALYSIS – COLUM GEOMETRY/LENGTH SELECTION
The investigation on the mechanics of D-G interaction in lipped channel columns starts with the selection of a geometry (cross-section dimensions and length) prone to this coupling phenomenon,
1 G
3 5 7
11 13
2 4 6 8
10 12 14 15 16 17
9
25
18 19 20 21 22 23
31
27 30
24
29 28
26
35 36 37 38
39
34
40 41 42 43 44 45 32 33
46 47 48 49 50 51 52 53 54 55 56 57 58 59
Figure 1: Lipped channel (i) GBT discretisation, (ii) conventional and transverse extension (linear and quadratic) mode in-plane configurations and (iii) shear mode warping displacement profiles
i.e., such that the distortional (PcrD) and global (PcrG) critical buckling loads are as close as possible.
The selection procedure is straightforward, as it is just necessary (i) to find cross-section dimensions
such that PcrD is significantly lower than its local counterpart (PcrL) and (ii) select the
intermediate-to-long length associated with the transition from distortional to global critical buckling in the Pcr vs. L
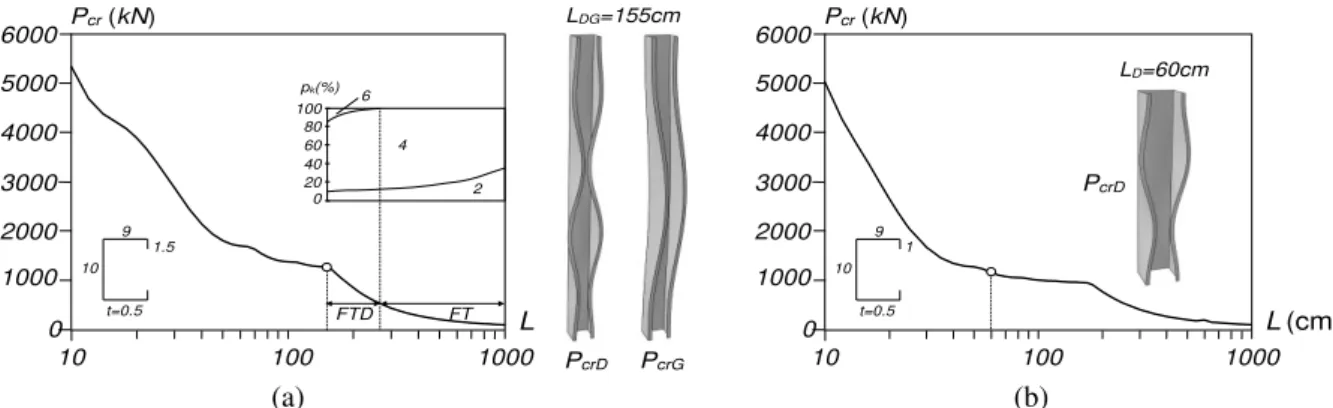
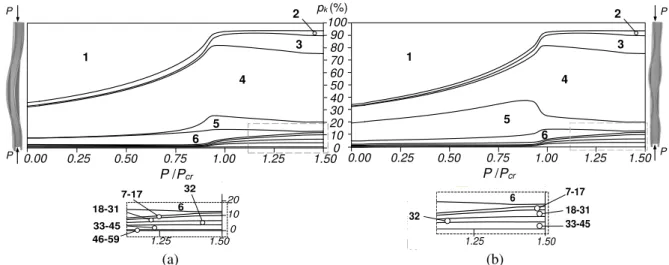
curve. In order to illustrate this procedure, Fig. 2(a) depicts this curve (L in logarithmic scale),
obtained from GBT buckling analyses (E=210GPa, v=0.3) carried out in GBTUL 2.0 [25] for column
cross-section dimensions bw=10cm bf=9cm, bl=1.5cm, t=0.5cm (web-flange-lip widths and wall
thickness) – the fairly large wall thickness was adopted to increase the local critical buckling load,
thus avoiding the occurrence of L-D-G interaction. Also displayed in Fig. 2(a) is the GBT modal participation diagram, providing the contribution of each deformation mode to the column critical global buckling modes. The observation of these buckling results prompts the following remarks:
(i) The L=155cm column exhibits practically coincident PcrD=1273.7kN and PcrG=1268.6kN values,
André D. MARTINS et al.
interaction – Fig. 2(a) also shows the two competing buckling mode shapes, which exhibit 4
distortional and 1 global5 half-waves, respectively.
(ii) The GBT modal participations depicted in Fig. 2(a) show that the Pcr vs. L descending branch
involves two distinct buckling behaviours6. The first involves contributions from deformation
modes 2+4+6, i.e.,the column buckles into a combination of major-axis flexure, torsion and
asymmetric distortion (FTD) for 155<L<250cm7. In view of the presence of mode 6, the
designation “global” is no longer strictly correct however, for the sake of simplicity, it will continue to be used in this work (sometimes between quotation marks, if confusion may arise).
The longer columns (250<L<1000cm) buckle in the (expected) flexural-torsional (FT) modes,
combining deformation modes 2 and 4– truly global buckling. Note that the participation of
mode 6 gradually decreases with L up to 250cm, when FTD buckling switches to FT buckling.
Fig. 2(b) shows again the Pcr vs. L curve depicted in Fig. 2(a), where a column length corresponding
to a “pure” distortional buckling and post-buckling behaviour (no interaction occurs) is indicated
L=60cm, associated with a two half-wave buckling mode. The behaviour of this column will play an
important role in clarifying some results presented in Section 4. The distortional critical buckling load
is much lower than its local and “global” counterparts: PcrD=1159.2<PcrL=3643.8 <PcrG=7929.9kN).
Pcr(kN)
10 100 1000
0 L
LDG=155cm
1000
pk(%)
2000 3000 4000 5000 6000
6
4
2 100
80 60 40 20 0
FTD FT
PcrD PcrG 9
1.5
.5
10
t=0.5
Pcr(kN)
10 100 1000
0 L(cm)
LD=60cm
1000 2000 3000 4000 5000 6000
PcrD
9 1
.5
10
t=0.5
(a) (b)
Figure 2: Pcrvs. L curves, selected lengths and critical mode shapes of fixed-ended lipped channel columns
undergoing (a) distortional-global interaction and (b) distortional buckling
4 COLUMN POST-BUCKLING BEHAVIOUR UNDER D-G INTERACTION
4.1 Validation of the GBT results
Thissectionpresentsanddiscussesthevalidationof the GBT GNIA results of columns under “true
D-G interaction”, through their comparison with ABAQUS SFEA values. The three columns analysed
have the cross-section dimensions selected in Section 3 and length L=1550mm. They differ in the
initial geometrical imperfection shape, which is either (i) “global” (FTD) with 1 half-wave and
amplitudeL/1000,(ii)distortionalwith4half-wavesand amplitude L/1000, or (iii) half the sum of the
two previous ones – here termed “CDG+G”, “CDG+D” and “CDG+{0.5G+0.5D}” column, respectively.
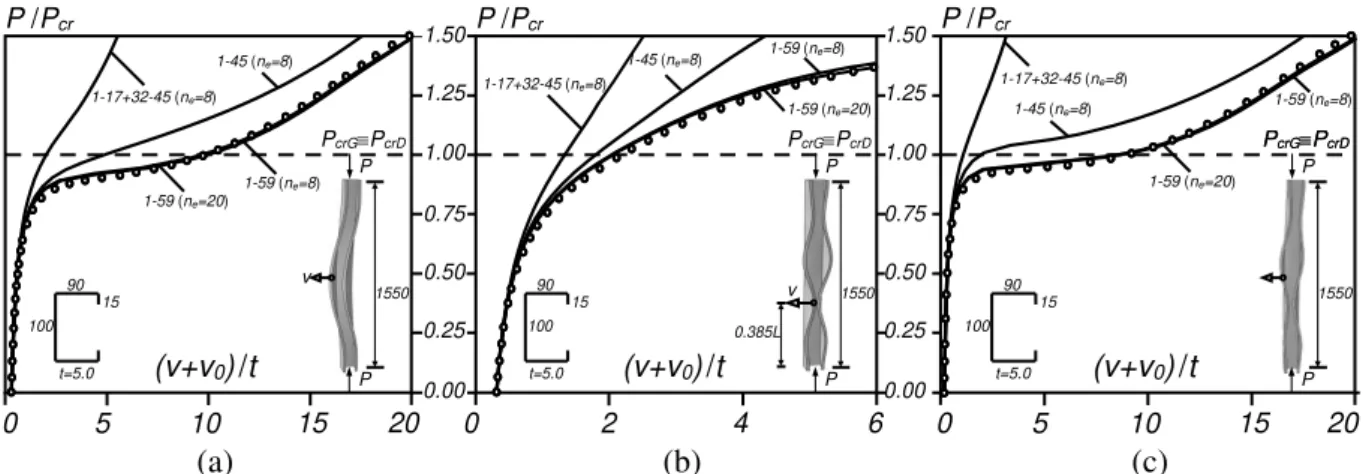
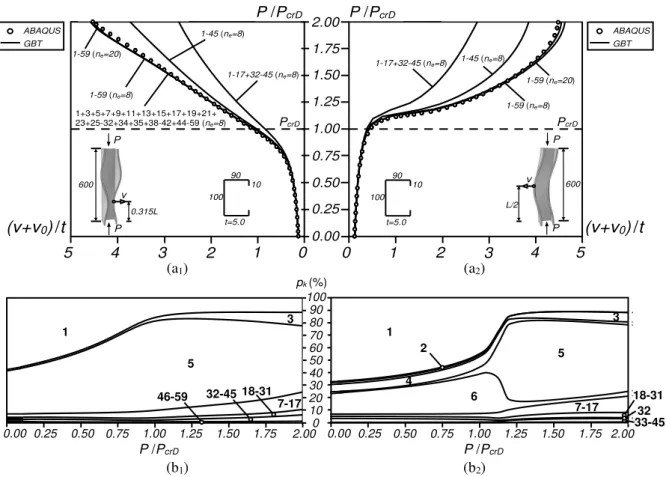
Figs. 3(a)-(c) show the three lipped channel column equilibrium paths P/Pcr vs. (v+v0)/t, where v is
the flange-lip corner vertical displacement caused by the applied load P, i.e., excluding the initial
value, occurring at either mid-span (Figs. 3(a) and 3(c)) or the location of the buckling mode most inward half-wave crest (Fig. 3(b). The initial geometrical imperfection shapes considered are also displayed in Figs. 3(a)-(c) and the equilibrium paths were determined by means of an arc-length
control strategy. In order to assess the relevance of the different deformation mode families tothe
5 In addition, there are inflexion points in the close vicinity of the end cross-sections, which define short “quarter-waves” recall that the columns analysed have fixed end supports. In this work, the half-wave numbers mentioned always exclude these “quarter waves”. 6 Similar conclusions were reported in [13,14].
column post-buckling behaviour,two “approximate analyses” were performed, including the most
relevant (i) conventional and linear transverse extension modes (1-17+32-45), and (ii) conventional,
shear and linear transverse extension modes (1-45) the column was axially discretised into 8 finite
elements. In addition, analyses including all modes (1-59) and with discretisations into 8 and 20 finite
elements were also performed. The observation of the above results prompts the following remarks:
(i) The GBT equilibrium paths obtained with deformation modes 1-17+32-45 and 1-45 provide
accurate results only up to fairly early loading stages. As shown in [18,19], only the inclusion of
the quadratic transverse extension modes (46-59 see Fig. 1) makes it possible to replicate the
“exact” ABAQUS SFEA solution, by eliminating the membrane locking effects. It is worth noting
that, since the column deformation is not symmetric (as will be shown later), more deformation modes need to be included in the analyses than in similar previous studies dealing with column
L-D interaction8– the exception is the CDG+D column (also addressed latter).
(ii) Sincethereisvirtuallynodifferencebetweenthesolutionsobtainedwith8 and 20 finite elements,
it may be concluded that the adoption of the cross-section discretisation shown in Fig. 1 and 8
finite elements leads to very accurate (virtually “exact”) results. Thus, only GBT buckling and
post-bucklingresults obtained with such cross-section and longitudinal discretisations arepresented
and discussed here, in the context of the study of D-G interaction in lipped channel columns.
P /Pcr
(v+v0)/t
15 10
5
0 20
90 15 .5 100
t=5.0
PcrGPcrD 1-45 (ne=8)
1-17+32-45 (ne=8)
1-59 (ne=20)
1-59 (ne=8)
1550
v P
P
0.25
0.00 0.75
0.50 1.25
1.00 1.50 P /Pcr
(v+v0)/t
4 2
0 6
90 15 .5 100
t=5.0
PcrGPcrD
1550
v P
1-45 (ne=8)
1-17+32-45 (ne=8)
1-59 (ne=20)
1-59 (ne=8)
P
0.25
0.00 0.75
0.50 1.25
1.00 1.50
0.385L
(v+v0)/t
15 10
5 25
00
0 20
75
90 15 .5 100
t=5.0
PcrGPcrD
50
25 1-59 (ne=8)
1-17+32-45 (ne=8)
1-59 (ne=20)
1-45 (ne=8)
00 50 P /Pcr
PcrGPcrD
1550
P
P
(a) (b) (c)
Figure 3: GBT P/Pcr vs. (v+v0)/t paths of lipped channel columns undergoing “true D-G interaction” with
(a) “global”, (b) distortional and (c) combined “global”-distortional initial geometrical imperfections
4.2 Distortional-global interaction
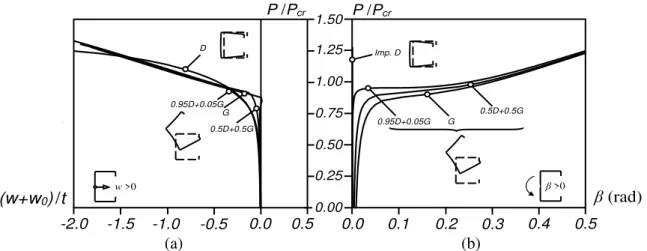
Figs. 4(a)-(b) show the column equilibrium paths P/Pcr vs. (w+w0)/t and P/Pcr vs. β+β0, where w
andβare the mid-span mid-web transverse displacement and web chord rigid-body rotation due to
the applied load P – thecurveslabelledD, G and 0.5D+0.5G concern the CDG+D, CDG+G and
CDG+{0.5G+0.5D} columns, respectively9. These equilibrium path pairs were chosen to assess the
column (i) distortion (through w, not influenced by the torsional mode 4) and (ii) torsional rotation
(through β, not influenced by the deformations caused by the distortional modes 5+6). Moreover, the
above figures also display a few illustrative mid-span cross-section deformed configurations. The comparative analysis of these post-buckling results prompts the following remarks:
(i) Generally speaking, the CDG+G and CDG+{0.5G+0.5D} columns exhibit similar post-buckling
equilibrium paths (behaviours) see Figs. 4(a)-(b). Moreover, the two paths merge into a
common curve at the advanced post-buckling stages. The fact that both columns experience significant distortional deformations (Fig. 4(a)) and rigid-body rotations (Fig. 4(b)) means that fairly strong D-G interaction is taking place.
8 The numbers of deformation modes that had to be considered are similar to those involved in the analysis of beams [18]. 9 Figs. 4(a)-(b) also show C
André D. MARTINS et al.
(w+w0)/t
0.0 -1.0
-1.5 25
00
-2.0 0.5
75 25 0
50 0
-0.5 00
75 P /Pcr
G
0.5D+0.5G
w >0
D
P/P cr
0.95D+0.05G
β(rad) 0.4
0.2 0.1 0.25
0.00
0.0 0.5
1.00
0.50 1.25
0.3 0.75
1.50 P /Pcr
G
0.5D+0.5G Imp. D
β >0 0.95D+0.05G
(a) (b)
Figure 4: (a) P/Pcr vs. (w+w0)/t and (b) P/Pcr vs. (β+ β0) post-buckling equilibrium paths of columns containing
several initial geometrical imperfections
(ii) Hovewer, the post-buckling behaviour of the CDG+D column is completely different: (ii1) the
P/Pcr vs. (w+w0)/t path does not merge with its CDG+G and CDG+{0.5G+0.5D} counterparts
and (ii2) there is a complete absence of rigid-body rotations (Fig. 4(b)). Thus, D-G interaction
does not occur and the behaviour appears to be pure distortional. This surprising behavioural
featurewas first reported in [13,14] and termed “a different type of D-G interaction”. Special
attention is devoted here to this column, in order to clarify its post-buckling behaviour GBT,
rather than the SFEA employed in [13,14], is ideally suited for this task.
(iii) Regardeless of the imperfection type/shape, the column exhibits significant post-critical strength
much higher than the simply supported column affected by D-G interaction that was analysed
in [13]. Obviously, these columns also exhibit a much higher post-critical strength than those
experiencing a “pure global” post-buckling behaviour.
In order to shed fresh light on the mechanics of the above three columns, (i) modal participation diagrams, (ii) column deformed configurations and (iii) modal displacements profiles are presented and discussed in the remainder of the paper. The modal participation factors can be evaluated on the
basis of several criteria, involving specific displacements (e.g., [26]), the strain energy (e.g., [25]) or
the modal amplitude functions (e.g., [27]). This work adopts the last criterion, which was found to
describe more adequately the behaviour of the columns analysed. The participation of a given
deformation mode k in the columns deformed configuration, termed pk, is given by either
1
ˆ( )
ˆ( )
T k L
k N N
j j
L x dx p
x dx
or,
, 1
ˆ ( )
ˆ ( )
T k x L
k N N
j x j
L x dx p
x dx
(8.1)-(8.2)depending on the nature of the deformation mode k. Eq. (8.1) is used to determine the participation
factors of the conventional (excluding axial extension) and transverse extension deformation modes. Eq. (8.2), on the other hand, is employed for the participation factors of the axial extension and shear
modes, i.e., those involving only warping displacements. In these equations, (i) N is the number of
deformation modes included in the analysis, (ii) ˆk( )x k( )x k( )x and (iii) NT is the total number
of deformation modes obtained from the cross-section analysis (for a given discretisation). However, the main drawback of the above criterion is the dependence on the deformation mode normalisation. In order to overcome this drawback, the following normalisation is adopted: unit (i) translation for the axial extension and major/minor-axis bending modes, (ii) maximum in-plane displacement
(
2 2
1
max v w ) for the torsion10 and distortional modes, (iii) maximum transverse displacement
(max w
1) for the local modes, (iv) maximum warping displacement (max u
1) for the shearmodes and (v) transverse extension (v,s=1) for the transverse extension modes.
4.2.1 Columns CDG+G and CDG+{0.5G+0.5D}
Since columns CDG+G and CDG+{0.5G+0.5D} exhibit similar post-buckling behaviours (see Fig.
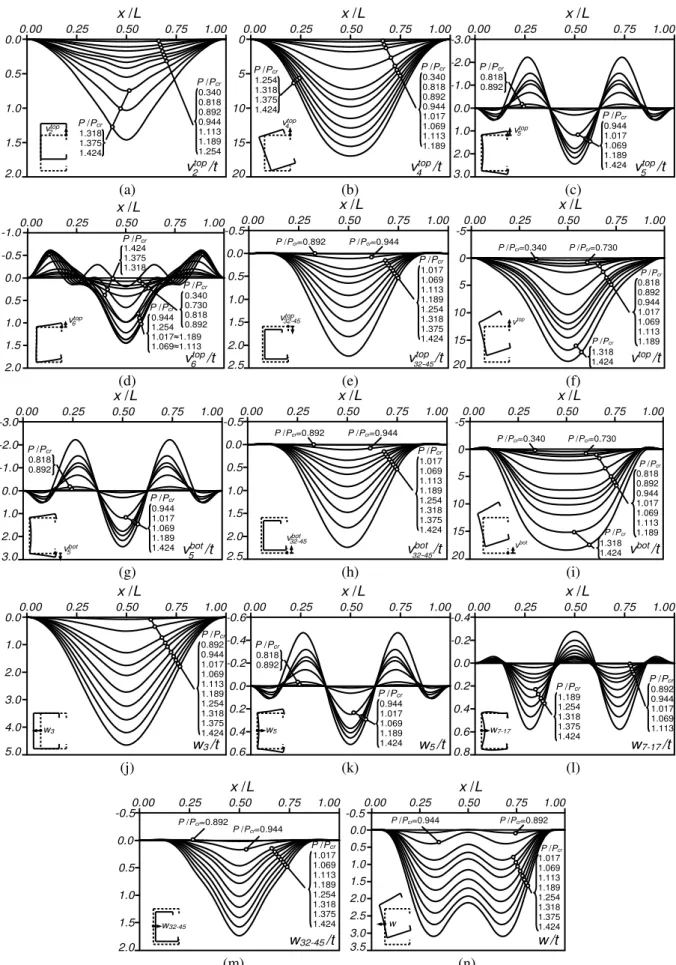
4), the corresponding results are presented and discussed jointly. Figs. 5(a)-(b), 6(a1)-(b5), 7(a)-(n) and
8(a)-(n) show, for both columns, the (i) modal participation diagrams, providing the evolution of the relative contributions of the various deformation modes to the column deformed configuration, (ii)
deformed configurations at five loading stages (P/Pcr=0.50-0.75-1.00-1.25-1.50 amplifications
given inside brackets) and (iii) the evolution of the top/bottom flange-lip corner vertical displacement
profiles (v2top, v4top, v5top, v6top, v32-45top, v1-59topvtop, v5bot, v32-45bot and v1-59botvbot note that the
contributions from modes 3, 7-17 and 46-59 are null) and mid-web transverse displacement
profiles (w3, w5, w7-17, w32-45 and w1-59w), caused by various deformation modes or mode sets.
The observation of all these post-buckling results leads to the following conclusions:
(i) The comparison of the two modal participation diagrams shown in Fig. 5(a)-(b) shows that the
major differences between the two column deformed configurations occur mostly for P/Pcr<1.00.
Indeed, besides the equally predominant contribution from mode 1, there are differences between
columns CDG+G and CDG+{0.5G+0.5D} concerning the remaining modal contributions. For
instance, at P/Pcr=0.50 one has: mode 2 (4% vs. 2%), mode 4 (36% vs. 18%) mode 5 (0% vs.
21%) and mode 6 (7% vs. 4%). These differences reflect the distinct initial geometrical
imperfection shapes. As loading progresses, the mode 1 participation is gradually decreases
(from 65% to 50%)and is replaced by increases in the remaining mode contributions, with one
exception: mode 2, whose contribution remains practically unaltered (in both columns).
(ii) In column CDG+G (see Fig. 5(a)), mode 5 appears at P/Pcr≈0.75 and its participation rises quickly
from 2% to 11% at P/Pcr≈0.90 for P/Pcr>0.90, p5 starts to decrease slowly and smoothly. As
for mode 3, it emerges at the peak of p5 (P/Pcr=0.90) and becomes progressively more relevant:
p3 grows from 2% at P/Pcr≈0.90 to 14% at P/Pcr=1.50, which stems from increasing effective
centroid shift effects (stress redistribution caused by the increasing distortional deformations).
(iii) In column CDG+{0.5G+0.5D} (see Fig. 5(b)), on the other hand, p5 reaches a peak value of 28%
at P/Pcr≈0.87 and then decreases continuously until 7% at P/Pcr=1.50. Conversely, p3, which
emerges again at the peak of p5, increases quickly from 3% to 14%.
(iv) The evolutions of the remaining modal participations are quite similar in both columns. First of
all, mode 4 dominates the column response (see also Fig. 6): its participation reaches 57% at
P/Pcr≈1.05andthendecreasesveryslowlyto55%atP/Pcr=1.50(due to the p3 increase). As
for mode 6, its participation reaches a peak of 11% (9%) at P/Pcr≈0.90 (0.97) and decreases
0.00
100
1
90 80 70 60 50 40 30 20 10 0 0.25 0.50 0.75 1.00 1.25 1.50
4
3 2
5 6
P
P
P /Pcr
pk (%)
0.00 1
0.25 0.50 0.75 1.00 1.25 1.50 4
3 2
5 6 100
0 0 0 0 0 0 0 0 0
P
P
P /Pcr
20 10 0 1.25 1.50
32
18-31
33-45 7-17
46-59
6
00 25 50 75 .00 1.25 1.50
5
6
7-17 18-31 32
33-45 6
(a) (b)
André D. MARTINS et al.
P/Pcr=0.50 P/Pcr=0.75 P/Pcr=1.00 P/Pcr=1.25 P/Pcr=1.50
(a1) (b1) (a2) (b2) (a3) (b3) (a4) (b4) (a5) (b5)
Figure 6: ABAQUS deformed configurations of columns (a) CDG+G and (b) CDG+{0.5G+0.5D} columns at the
loading stages defined by P/Pcr equal to (1) 0.50, (2) 0.75, (3) 1.00, (4) 1.25 and (5) 1.50
drastically to 1% at P/Pcr=1.50. The joint participation of the local modes (mostly mode 7) never
exceeds 2% and the shear modes only emerge at P/Pcr≈0.90, with a joint participation (modes18,
19 and 20 mostly mode 19) that never exceeds 4%. Finally, even if the joint participation of the
transverse extension modes only becomes visible for P/Pcr>0.90 and reaches a maximum of 6%,
it should be noted that mode 32 is present since the early loading stages and its inclusion in
the analysis is essential to obtain accurate results, even if p32 only varies between 1% and 3%
the remaining 3% are due to modes 33 (0.7%), 34 (0.2%), 35 (0.2%), 36 (0.8%) and 37 (0.9%).
(v) In the CDG+G column, the displacement profiles due to the contributions of modes 2 and 4 (see
Figs. 7(a)-(b)) retain more or less their initial shapes (one half-wave “better shaped” in the case
of mode 4) as loading progresses they practically coincide with vtop and vbot at the early loading
stages(seeFigs.7(f)+(i))11. Likewise,the v
5top and v5bot displacement profiles, which only become
visible at P/Pcr=0.818, retain their 5 half-wave shape (akin to the second distortional buckling
mode – see the configurations at P/Pcr=0.818 in Figs. 7(c)+(g). This apparently surprising
emergence of distortional deformations akin to the second distortional bucking mode (instead of
the critical one, which has 4 half-waves see Fig. 2(a)), is due to the (v1) near coincidence of the
buckling loads associated with the first two distortional buckling modes (1273kN vs. 1281kN)
and (ii2) shared axial symmetry of the second distortional and critical “global” buckling modes,
which favours the interaction between them. Indeed, Fig. 7(a3), concerning P/Pcr=1.00,
provides clear evidence of the occurrence of D-G interaction, combining distortional and global
deformations symmetric and anti-symmetric with respect to the the major-axis, respectively.
The presence, since the early loading stages, of deformation patterns akin to the distortional and
global buckling modes characterises the so-called “true D-G interaction”12.
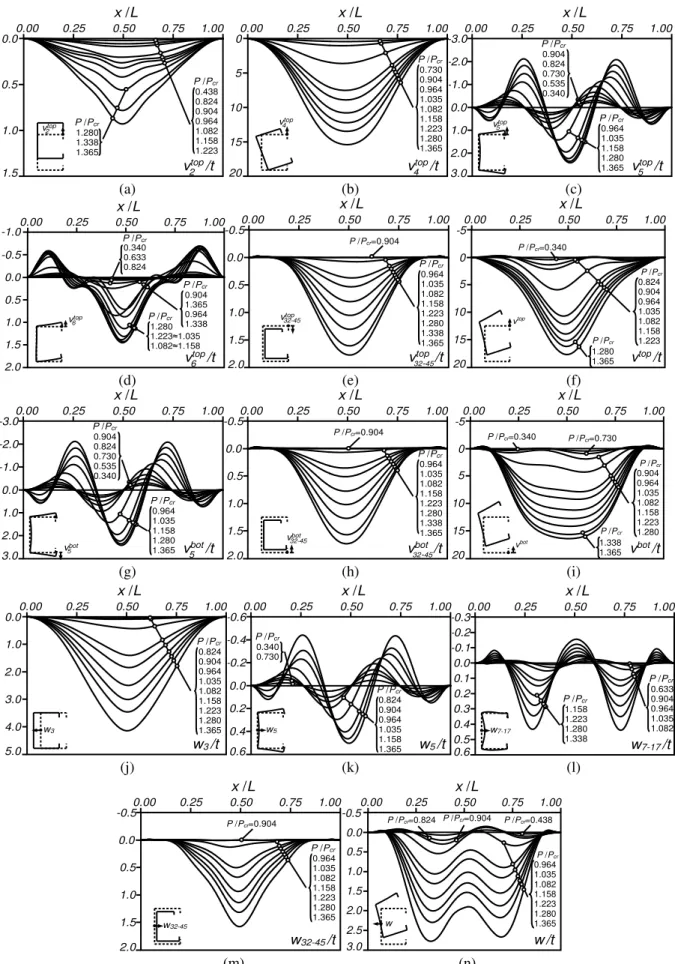
(vi) Since the CDG+{0.5G+0.5D} column contains initial geometrical imperfections that combine
“global” (modes 2+4+6) and distortional (mode 5) components, exhibiting 1 and 4 half-waves13,
respectively,thequalitative changesobservedin the evolution of the displacement profiles shown
in Figs. 8(a)-(n) are more significant than those occurring in their CDG+G column counterparts,
displayed in Figs. 7(a)-(n). For instance, Figs. 8(c)+(g) clearly show that, for P/Pcr>0.904, the
11 The displacement profile due to the contribution of mode 6 (see Fig. 7(d)) changes gradually from 3 half-waves (akin to its component in the initial geometrical imperfections) to 7 half-waves between P/Pcr=0.818 (when mode 5 emerges) and P/Pcr=1.424 the mechanics behind this behavioural feature change are not yet well understood, particularly because mode 6 does not participate in the distortional buckling modes. Nevertheless, it should be also mentioned that the above change is accompanied by a decrease in relevance of mode 6, as far as the column deformed configuration is concerned.
12 Columns with global-to-distortional critical buckling load ratios higher than 1.00 (distortional buckling precedes global buckling) may also experience D-G interaction, termed “secondary distortional-bifurcation D-G interaction” however, this type of D-G interaction is not addressed here. Conversely, columns with global-to-distortional critical buckling load ratios lower than 1.0 are not expected to undergo D-G interaction, due to the minute column global post-critical strength reserve.
13 Recall that the mode 6 amplitude function exhibits 3 half-waves.
P /Pcr 0.340 0.818 0.892 0.944 1.113 1.189 1.254
x /L
0.00 0.0
0.25 0.50 0.75 1.00
vtop/t
vtop P /Pcr
1.318 1.375 1.424 0.5 1.0 1.5
2.0 2
2
P /Pcr
0.340 0.818 0.892 0.944 1.017 1.069 1.113 1.189
x /L
0.00 0
0.25 0.50 0.75 1.00
vtop/t
vtop P /Pcr
1.254 1.318 1.375 1.424 5 10 15
20 4
4
P /Pcr
0.944 1.017 1.069 1.189 1.424
x /L
0.00 -3.0
0.25 0.50 0.75 1.00
vtop/t
vtop P /Pcr
0.818 0.892 5 5 -2.0 -1.0 0.0 1.0 2.0 3.0
(a) (b) (c)
x /L
0.00 0.25 0.50 0.75 1.00
0.0 2.0 0.5 -0.5 1.5 1.0 -1.0
P /Pcr
0.340 0.730 0.818 0.892 1.424 1.375 1.318
P /Pcr
vtop/t 6
vtop 6
P /Pcr
0.944 1.254
1.017≈1.189
1.069≈1.113
P /Pcr
1.017 1.069 1.113 1.189 1.254 1.318 1.375 1.424
x /L
0.00
-0.5 0.25 0.50 0.75 1.00
vtop
/t vtop
0.0
1.0
32-45
32-45
0.5
1.5
2.0
2.5
P /Pcr=0.892 P /Pcr=0.944
P /Pcr
0.818 0.892 0.944 1.017 1.069 1.113 1.189
x /L
0.00 0.25 0.50 0.75 1.00
vtop/t
-5
0
vtop
1.318 1.424 P /Pcr
P /Pcr=0.340 P /Pcr=0.730
5
10
15
20
(d) (e) (f)
P /Pcr
0.944 1.017 1.069 1.189 1.424
x /L
0.00 -3.0
0.25 0.50 0.75 1.00
vbot/t
vbot P /Pcr
0.818 0.892 5 5 -2.0 -1.0 0.0 1.0 2.0 3.0
P /Pcr
1.017 1.069 1.113 1.189 1.254 1.318 1.375 1.424
x /L
0.00 -0.5
0.25 0.50 0.75 1.00
vbot
/t vbot
0.0
1.0
32-45
32-45
0.5
1.5
2.0
2.5
P /Pcr=0.892 P /Pcr=0.944
P /Pcr
0.818 0.892 0.944 1.017 1.069 1.113 1.189
x /L
0.00 0.25 0.50 0.75 1.00
vbot/t
-5
0
vbot 1.318
1.424 P /Pcr
P /Pcr=0.340 P /Pcr=0.730
5
10
15
20
(g) (h) (i)
x /L
0.00 0.0
0.25 0.50 0.75 1.00
w3/t
w3 2.0 3.0 5.0 1.0 4.0
P /Pcr
0.892 0.944 1.017 1.069 1.113 1.189 1.254 1.318 1.375 1.424
P /Pcr
0.944 1.017 1.069 1.189 1.424
x /L
0.00 -0.6
0.25 0.50 0.75 1.00
w5/t
P /Pcr
0.818 0.892 -0.4 -0.2 0.0 0.2 0.4 0.6 w5
P /Pcr
1.189 1.254 1.318 1.375 1.424
x /L
0.00 -0.4
0.25 0.50 0.75 1.00
-0.2
0.0
0.4
0.6
0.8
0.2 P 0.892 /Pcr
0.944 1.017 1.069 1.113
w7-17/t
w7-17
(j) (k) (l)
P /Pcr
1.017 1.069 1.113 1.189 1.254 1.318 1.375 1.424
x /L
0.00
-0.5 0.25 0.50 0.75 1.00
0.0
0.5
1.0
1.5
2.0
P /Pcr=0.892
w32-45/t
w32-45
P /Pcr=0.944
P /Pcr
1.017 1.069 1.113 1.189 1.254 1.318 1.375 1.424
x /L
0.00 0.25 0.50 0.75 1.00
w/t
-0.5 0.0
P /Pcr=0.944 P /Pcr=0.892
1.5 2.0 3.0 3.5 2.5 1.0 w 0.5
(m) (n)
Figure 7: CDG+G column displacement profiles: top flange-lip corner vertical displacement (a) v2top, (b) v4top,
(c) v5top, (d) v6top, (e) v32-45top, (f) v1-59topvtop, bottom flange-lip corner vertical displacement (g) v5bot, (h) v32-45bot,
André D. MARTINS et al.
P /Pcr
0.438 0.824 0.904 0.964 1.082 1.158 1.223
x /L
0.00 0.0
0.25 0.50 0.75 1.00
vtop/t
vtop P /Pcr
1.280 1.338 1.365
0.5
1.0
1.5 2
2
P /Pcr
0.730 0.904 0.964 1.035 1.082 1.158 1.223 1.280 1.365
x /L
0.00 0
0.25 0.50 0.75 1.00
vtop/t
vtop
5
10
15
20 4
4 P /Pcr
0.964 1.035 1.158 1.280 1.365
x /L
0.00 -3.0
0.25 0.50 0.75 1.00
vtop/t
vtop
P /Pcr
0.904 0.824 0.730 0.535 0.340 5 5 -2.0 -1.0 0.0 1.0 2.0 3.0
(a) (b) (c)
x /L
0.00 0.25 0.50 0.75 1.00
0.0 2.0 0.5 -0.5 1.5 1.0 -1.0
P /Pcr
0.904 1.365 0.964 1.338 0.340 0.633 0.824
P /Pcr
vtop/t 6
vtop 6
P /Pcr
1.280
1.223≈1.035
1.082≈1.158
P /Pcr
0.964 1.035 1.082 1.158 1.223 1.280 1.338 1.365
x /L
0.00
-0.5 0.25 0.50 0.75 1.00
vtop
/t vtop
0.0
0.5
32-45
32-45
1.0
1.5
2.0
P /Pcr=0.904
P /Pcr
0.824 0.904 0.964 1.035 1.082 1.158 1.223
x /L
0.00 0.25 0.50 0.75 1.00
vtop/t
-5
0
vtop
1.280 1.365 P /Pcr
P /Pcr=0.340
5
10
15
20
(d) (e) (f)
P /Pcr
0.964 1.035 1.158 1.280 1.365
x /L
0.00 -3.0
0.25 0.50 0.75 1.00
vbot/t
P /Pcr
0.904 0.824 0.730 0.535 0.340 5 -2.0 -1.0 0.0 1.0 2.0
3.0 v
bot 5
P /Pcr
0.964 1.035 1.082 1.158 1.223 1.280 1.338 1.365
x /L
0.00 -0.5
0.25 0.50 0.75 1.00
vbot
/t vbot
0.0
32-45
32-45
0.5
1.0
1.5
2.0
P /Pcr=0.904
P /Pcr
0.904 0.964 1.035 1.082 1.158 1.223 1.280
x /L
0.00 0.25 0.50 0.75 1.00
vbot/t
-5
0
vbot 1.338
1.365 P /Pcr
P /Pcr=0.340 P /Pcr=0.730
5
10
15
20
(g) (h) (i)
P /Pcr
0.824 0.904 0.964 1.035 1.082 1.158 1.223 1.280 1.365
x /L
0.00 0.0
0.25 0.50 0.75 1.00
w3/t
w3 2.0 3.0 5.0 1.0 4.0
P /Pcr
0.824 0.904 0.964 1.035 1.158 1.365
x /L
0.00 -0.6
0.25 0.50 0.75 1.00
w5/t
P /Pcr
0.340 0.730 -0.4 -0.2 0.0 0.2 0.4 0.6 w5
P /Pcr
1.158 1.223 1.280 1.338
x /L
0.00 -0.3
0.25 0.50 0.75 1.00
-0.2 0.0 0.1 0.3 0.5 0.6 -0.1 0.4 0.2
P /Pcr
0.633 0.904 0.964 1.035 1.082
w7-17/t
w7-17
(j) (k) (l)
P /Pcr
0.964 1.035 1.082 1.158 1.223 1.280 1.365
x /L
0.00
-0.5 0.25 0.50 0.75 1.00
0.0
0.5
1.0
1.5
2.0
P /Pcr=0.904
w32-45/t
w32-45
P /Pcr
0.964 1.035 1.082 1.158 1.223 1.280 1.365
x /L
0.00 0.25 0.50 0.75 1.00
w/t
-0.5
0.0
P /Pcr=0.824 P /Pcr=0.438
1.0 1.5 2.5 3.0 2.0 0.5
P /Pcr=0.904
w
(m) (n)
Figure 8: CDG+{0.5G+0.5D} column displacement profiles: top flange-lip corner vertical displacement (a) v2top,
(b) v4top, (c) v5top, (d) v6top, (e) v32-45top, (f) v1-59topvtop, bottom flange-lip corner vertical displacement (g) v5bot, (h)
shapes of the displacements profiles v5top and v5bot switch gradually from 4 half-waves (akin to
the distortional critical buckling mode) to 5 half-waves (akin to the second distortional bucking mode), due to the longitudinal symmetry of the latter (favouring the interaction with the global
buckling mode) – at P/Pcr=1.365, both v5top and v5bot are already perfectly symmetric. As a result
of the above v5top and v5bot “shape switch”, the displacement profiles vtop, vbot and w exhibit
an asymmetry that only vanishes completely at P/Pcr=1.365. At the advanced loading stages
(P/Pcr=1.25 and P/Pcr=1.50), there is a high similarity between the displacement profiles and
deformed configurations of the CDG+G and CDG+{0.5G+0.5D} columns (see Fig. 6(a4)-(b4),
6(a5)-(b5), 7(a)-(n) and 8(a)-(n)), which agrees with the fact that the corresponding equilibrium
paths merge into a common curve (see Figs. 4(a)-(b)).
(vii) Asshownin Figs.7(b)+(f)+(i)and8(b)+(f)+(i),thedominantcontributionstovtopand vbot come
from mode 4, a typical feature in column D-G interaction. Indeed, the v2 values are about 10% of
the v4 ones during the whole loading range – see Figs. 5(a)-(b).
(viii) Asshownin Fig. 7(j)-(n) and 8(j)-(n), the dominant contribution to w comes from mode 3, which
appears due to the effective centroid shift effects stemming from the substantial cross-section
stressredistributionoccurringattheadvancedloadingstages (duetodistortionaldeformations).
(ix) The joint contribution of the local deformation modes (mostly mode 7) to w is very small and
stems from their participation in the first two distortional buckling modes, which explains why the number of local half-waves is always fairly small.
(x) The joint contribution of the linear transverse extension deformation modes (mostly mode 36
global deviatoric) to vtop, vbot and w is not negligible in the last case, it significantly
“opposes” the contribution from mode 3, which explains the large difference between w3 and w.
It is worth noting that including the linear and quadratic transverse extension modes is absolutely essential to obtain accurate results (see Figs. 3(a)-(b)), even if the latter have virtually no impact
on the displacement profiles in the case of the linear modes such impact is restricted to the
column central region (see Figs. 7(h)+(m) and 8(h)+(m)).
4.2.2 Column CDG+D
The singular geometrically non-linear behaviour of column CDG+D, containing pure distortional
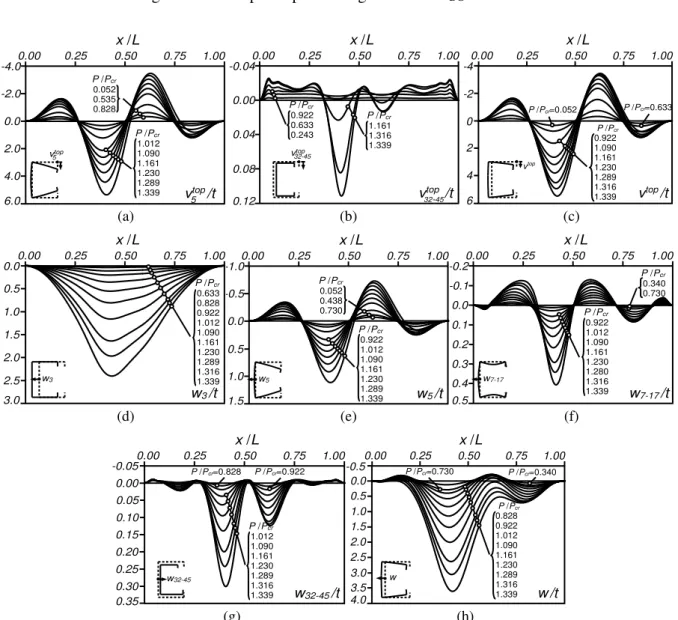
initial geometrical imperfections, is adresses in detail in this section14. Fig. 9 shows the evolution of
themodalparticipationsasloadingprogresses, while Figs. 10(a)-(h) display the evolution of the (i) top
flange-lip corner vertical displacement profiles v5top, v32-45top and v1-59topvtop, and (ii)mid-web transverse
displacement profile w3, w5,w7-17, w32-45 and w1-59w. Finally, Figs. 11(a1)-(a5) show column deformed
configurations at P/Pcr={0.50; 0.75; 1.00; 1.25; 1.40} – the amplifications considered, for some of
them, are given between brackets. The observation of these leads to the following conclusions:
(i) The modal participation diagram in Fig. 9 bears no resemblance with those of columns CDG+G
and CDG+{0.5G+0.5D} (see Figs. 5(a)-(b)), thus evidencing this column singular behaviour,
which is not affected by D-G interaction. Naturally, mode 1 governs at the early loading stages
(p1>60%), after which it is gradually replaced by modes 5 (mostly), 7 and 9– the modes that
contribute to the column initial geometrical imperfections (participations of 95%, 3%, 1%, respectively, which change very little during the early loading stages). As loading progresses,
until P/Pcr≈1.05, mode 3 emerges and its contribution gradually increases up to 14%, together
with a similarly gradual growth of the participation of mode 5, reaching a maximum of 56%.
Beyond P/Pcr≈1.05, the contributions of modes 3 and 5 part ways: the former further increases
up to 33% at P/Pcr=1.40, while the latter reduces to 42%. As for the local mode contributions,
they exhibit a smooth and small increase throughout the whole loading range, reaching 4.4% at
P/Pcr=1.40 – modes 11 and 13 emerge at the advanced loading stages, but their contributions
André D. MARTINS et al.
P /Pcr
pk (%)
1 3
5 100 90 80 70 60 50 40 30 20 10 0 P P 18-31
0.2 0.4 0.6 0.8 1.0 1.2
0.0 1.4
7-17 32-45
46-59
Figure 9: Modal participation diagram of the CDG+Dcolumn
P /Pcr
1.012 1.090 1.161 1.230 1.289 1.339
x /L
0.00
-4.0 0.25 0.50 0.75 1.00
vtop/t
P /Pcr
0.052 0.535 0.828 5 -2.0 0.0 2.0 4.0 6.0 vtop 5
P /Pcr
1.161 1.316 1.339
x /L
0.00 0.25 0.50 0.75 1.00
vtop
/t vtop
32-45
32-45 0.12 0.08 0.04 0.00 -0.04
P /Pcr
0.922 0.633 0.243
P /Pcr
0.922 1.090 1.161 1.230 1.289 1.316 1.339
x /L
0.00 0.25 0.50 0.75 1.00
vtop/t
-4
vtop
P /Pcr=0.052
2
4 -2
0
6
P /Pcr=0.633
(a) (b) (c)
w3/t
P /Pcr
0.633 0.828 0.922 1.012 1.090 1.161 1.230 1.289 1.316 1.339
x /L
0.00
0.0 0.25 0.50 0.75 1.00
w3 1.0 1.5 3.0 0.5 2.5 2.0
P /Pcr
0.922 1.012 1.090 1.161 1.230 1.289 1.339
x /L
0.00
-1.0 0.25 0.50 0.75 1.00
w5/t
P /Pcr
0.052 0.438 0.730 -0.5 0.0 0.5 1.0 1.5 w5
P /Pcr
0.922 1.012 1.090 1.161 1.230 1.280 1.316 1.339
x /L
0.00
-0.2 0.25 0.50 0.75 1.00
0.0 0.1 0.4 0.5 -0.1 0.3 0.2
P /Pcr
0.340 0.730
w7-17/t
w7-17
(d) (e) (f)
P /Pcr
1.012 1.090 1.161 1.230 1.289 1.316 1.339
x /L
0.00 0.25 0.50 0.75 1.00
0.10
P /Pcr=0.828
w32-45/t
w32-45 0.15 0.20 0.25 0.30 0.35 0.05 0.00 -0.05
P /Pcr=0.922
P /Pcr
0.828 0.922 1.012 1.090 1.161 1.230 1.289 1.316 1.339
x /L
0.00 0.25 0.50 0.75 1.00
w/t
-0.5
0.0 P /Pcr=0.730 P /Pcr=0.340
1.5 2.0 3.5 4.0 2.5 1.0 w 0.5 3.0
(g) (h)
Figure10:CDG+Dcolumndisplacementprofiles:topflange-lipcornerverticaldisplacement(a)v5top,(b)v32-45top,
(c) v1-59topvtop, and mid-web transverse displacement (d) w3, (e) w5, (f) w7-17, (g) w32-45 and (h) w1-59w
remain very tiny15. The shear modes (mostly mode 19, but also modes 21, 23, 25 and 26) emerge at
P/Pcr≈0.83 – their joint participation reaches 2.2% at P/Pcr=1.40 (with p19=1.4%). Finally, the
transverse extension modes 32 (mostly) and 35 are the most relevant for the column response, even if
modes 34, 38-42, 44 and 45 also have minute contributions – their joint contribution never exceeds
4%, with p32=1.0% and p35=0.8%.
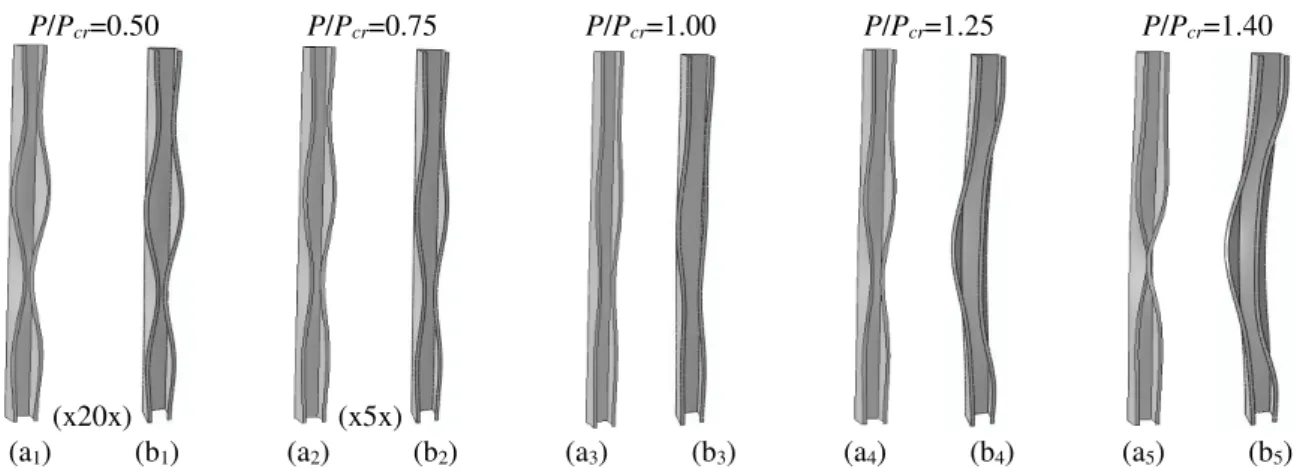
P/Pcr=0.50 P/Pcr=0.75 P/Pcr=1.00 P/Pcr=1.25 P/Pcr=1.40
(x20x) (x5x)
(a1) (b1) (a2) (b2) (a3) (b3) (a4) (b4) (a5) (b5)
Figure 11: ABAQUS deformed configurations of the (a) CGD+D (b) CGD+{0.95D+0.05G} columns at loading
stages defined by P/Pcr equal to (1) 0.50, (2) 0.75, (3) 1.00, (4)1.25 and (5) 1.40
(ii) Figs. 10(a)-(c) show that the flange-lip corner vertical displacements profile (vtop) consists
essentially of the contribution from mode 5– the small difference between vtop and v5top is due to
the transverse extension modes (see Fig. 10(b)), which confirms that, indeed, this column is not
affected by D-G interaction, despite the near coincidence of the distortional and “global” critical
buckling loads. There are no contributions from modes 2, 4 and 6 (those participating in the
“global” critical buckling mode) compare the deformed configurations shown in Figs. 11(a1
)-(a5) and 6(a1)-(b5). In fact, the post-buckling behaviour of column response of this column
resembles a typical distortional post-buckling behaviour (assertion that will be discussed after).
(iii) From Figs. 10(a)+(c) show that the shape of v5top changes gradually from 4 equal half-waves
(akin to the initial geometrical imperfection –e.g., at P/Pcr=0.828) to unequal ones the inner
half-waves outgrow the outer ones (particularly that involving inward flange lip-motions).
(iv) Theeffectivecentroidshift caused by the stress redistribution due to the distortional deformations
originates minor-axis bending, as shown in Fig. 10(d) – the w3 and w5 shapes are in accordance:
asymmetric and with the higher values occurring to the left of the mid-span cross-section. Once
more, the contribution of w7-17 and w32-45 to w is minute w is practically the sum of w3 and w5.
In order to shed further light on the singular post-buckling behaviour exhibited by the CDG+D column,
the column characterised in Fig. 2(b), which has a critical distortional buckling load much lower than
its local and global counterparts (i.e., a pure distortional post-bucking behaviour), is analysed next.
Because it was not possible to find a column buckling in a mode with 4 distortional half-waves not experiencing L-D interaction, the column selected buckles in a mode with 2 distortional half-waves.
Two initial geometrical imperfections are considered, namely (i) pure distortional (CD+D column)
and (ii) pure global (CD+G column)16, making it possible to compare their post-buckling behaviours
with those exhibited by of the CDG+D and CDG+G columns (addressed previously).
Fig. 12(a1)-(a2) show the equilibrium paths P/PcrD vs. (v+v0)/t of columns CD+D and CD+G,
wherevistheflange-lipcornerverticaldisplacementatthe location of the buckling mode most inward
half-wave crest and at mid-span, respectively, normalised to an L/1000 amplitude Figs. 12(b1)-(b2)
provide the corresponding modal participation diagrams. Figs. 13(a)-(h) and 14(a)-(n) are similar to
Figs. 10(a)-(h) and Fig. 7(a)-(n), respectively. Finally, Figs. 15(a1)-(b5) show CD column deformed
configurationsatloadingstagesP/Pcr={0.50,1.00,1.25, 1.50,1.75, 2.00} – the amplifications adopted
are given inside brackets. The observation and comparison of the post-buckling results concerning the four columns under consideration makes it possible to draw the following conclusions: