Abstract
This work reports a numerical investigation on the distortional buckling/post-buckling behaviors, ultimate strength and Direct Strength Method (DSM) design of cold-formed steel S-beams, commonly used in industrial rack systems. The analyzed beams are single-span, under uniform bending, exhibiting two different end support conditions and 5 cross-sections dimensions. The post-buckling equilibrium paths and ultimate moments are obtained from shell finite element non-linear analysis through the software ANSYS. The reported results evidenced that current codified DSM distortional curve is unable to provide safely strength predictions for the selected beams.
Keywords
Distortional failure, cold-formed steel beams, shell finite element.
Distortional Failure and DSM Design of Cold-Formed
Steel S-Shaped Beams Under Uniform Bending
1 INTRODUCTION
The usage of cold-formed steel (CFS) structures in the construction industry has grown steadily during the last few years, particularly in low-rise storage, residential and industrial buildings. On the other hand, the search for economical solutions leads to the use of quite slender cold-formed steel members, which are invariably prone to various instability phenomena that often govern their strength and safety. Regarding the distortional failure of cold-formed steel beams, the research work available includes experimental investigations (e.g., Yu and Schafer (2005, 2006, 2007) and Wang and Young (2014)), numerical simulations (e.g., Landesmann and Camotim 2015) and design pro-posals, mainly concerning the development/improvement of methodologies based on the Direct
Carolina Barichello a, * Alexandre Landesmann b Dinar Camotim c
a,b Civil Engineering Program, COPPE, Federal University of Rio de Janeiro, Brazil. [email protected]; [email protected]
c Civil Engineering Department, ICIST, Instituto Superior Técnico, University of Lisbon, Portugal; [email protected] * Corresponding author
http://dx.doi.org/10.1590/1679-78253616 Received 14.12.2016
Strength Method (DSM) (e.g., Schafer and Peköz (1998), Schafer (1997, 2006) and Yu and Schafer (2005)). Indeed, the DSM appearing in the American Iron and Steel Institute (AISI 2012), Australi-an/New Zealand (AS/NZS 2005) and Brazilian (ABNT 2010) specifications for cold-formed steel structures, contains specific provisions (strength curves) for the design of columns and beams against distortional failure. Their application requires only knowing the member yield stress and distortional buckling load/moment. DSM was developed through experimental tests and its data base consisted basically of plane lipped channels (PLC) and Z cross-sections specimens. Due to this fact, AISI (2012) presents geometrical and material restrictions to the application of the DSM de-sign curves and the sections that fulfill these requirements are called “qualified”. This pre-qualification reduces to a limited range the application of the DSM.
Recently, the authors (Landesmann and Camotim 2015) reported a shell finite element (SFE) investigation on the distortional post-buckling behavior, ultimate strength and DSM design of CFS single-span lipped channels beams exhibiting (i) several geometries (cross-section dimension ratios and lengths), and (ii) two end support conditions, differing in the warping and local displace-ment/rotation restraints – either completely free or fully prevented. The paper showed that the currently codified DSM design curve failed to predict adequately the distortional failure moments of some of the beams analyzed, particularly in the moderate-to-high slenderness range. Moreover, alt-hough the remarkable commercial use of CFS “S” type sections (namely, S45 and S90 cross-section shapes – see schematic cross-sections in Table 1), there is a lack of information if the current codi-fied DSM design is able to predict, safely and accurately, their ultimate strength. Therefore, the aim of this work is to extend the scope of previous studies (e.g., Landesmann and Camotim 2015; Mar-tins et al. 2016), by presenting and discussing the results of a SFE investigation on the distortional post-buckling behavior, ultimate strength and DSM design of CFS single-span beams S45 and S90 cross-sections shapes–all analyzed beams are not pre-qualified and fail in “pure” distortional modes.
To achieve the main objective, this work proposes to: (i) perform a beam geometry selection through Generalized Beam Theory approach (GBT, through the GBTul code, Bebiano et al.
2010a,b) buckling/bifurcation analysis aiming at studying the distortional buckling modes and lengths involved in the selected beams failures, (ii) perform non-linear analysis in ANSYS (2009) to acquire numerical data for the post-buckling behavior study, and (iii) apply the DSM codified method to enable comparison with the numerical data of the ultimate bending moments.
2 BEAM GEOMETRY SELECTION AND BUCKLING/BIFURCATION BEHAVIOR
For the purpose of this work, the selected beams (i) were simply supported with respect to major-axis bending, (ii) had their end cross-section torsional rotations prevented and (iii) differed in the end cross-section warping (this designation covers here (i) differential longitudinal displacements and (ii) wall/local displacements and rotations) and minor-axis flexural rotation restraints. Two different end support conditions were considered, namely (i) free warping and minor-axis flexural rotations, termed here “F” and (ii) prevented warping and minor-axis flexural rotations, termed here “P”.
modal nature, it is possible to obtain buckling/bifurcation moments corresponding to “pure” local, distortional and global (lateral-torsional) modes), but also through Ansys (2009) SFE analysis. Basi-cally, the beams to be selected should fulfill (as much as possible) the following requirements:
(i) Beams buckling/bifurcating and failing in “pure” distortional modes. This goal is achieved by ensuring that the critical buckling/bifurcation moment (i1) is clearly distortional and (i2)
falls considerably below its lowest local and global counterparts.
(ii)Cross-section (S beams) dimensions associated with “pure” distortional failures and the two end support conditions dealt with here (only the lengths are different).
(iii)Beam lengths (iii1) whenever is achievable, associated with single half-wave buckling modes
and (iii2) as close as possible to the values of the F beam minimum distortional critical
buckling/bifurcation moments.
(iv)Cross-section dimensions commonly used in practice and, if feasible, distinct wall width pro-portions, namely the web-to-flange (bw/bf) and flange-to-lip (bf/bl) width ratios. This
re-quirement is intended to enable assessing whether such width proportions have a meaningful influence on the beam distortional post-critical strength.
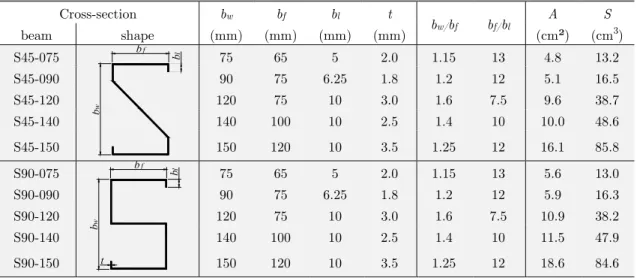
The output of this effort are the 10 beams cross-section dimensions (bw, bf, bl, t) given in Table
1 (see schematic cross-sections) – their area (A), major-axis elastic section modulus (S), web-to-flange (bw/bf) and flange-to-lip (bf/bl) width ratios are also displayed, note that bw/bf and bf/bl
range from 1.15 to 1.6 and from 7.5 to 13, respectively.
Cross-section bw bf bl t
bw/bf bf/bl A S
beam shape (mm) (mm) (mm) (mm) (cm²) (cm3)
S45-075 bf bl
b
w
75 65 5 2.0 1.15 13 4.8 13.2
S45-090 90 75 6.25 1.8 1.2 12 5.1 16.5
S45-120 120 75 10 3.0 1.6 7.5 9.6 38.7
S45-140 140 100 10 2.5 1.4 10 10.0 48.6
S45-150 150 120 10 3.5 1.25 12 16.1 85.8
S90-075 bf bl
b
w
t
75 65 5 2.0 1.15 13 5.6 13.0
S90-090 90 75 6.25 1.8 1.2 12 5.9 16.3
S90-120 120 75 10 3.0 1.6 7.5 10.9 38.2
S90-140 140 100 10 2.5 1.4 10 11.5 47.9
S90-150 150 120 10 3.5 1.25 12 18.6 84.6
Table 1: Selected S45 and S90 beams cross-section geometrical parameters.
For all beams analyzed in this work, Table 2 provides (i) the length associated with critical dis-tortional buckling/bifurcation (LD), (ii) corresponding critical (distortional) buckling/bifurcation
bending moment (McrD) – obtained by means of GBTul buckling/bifurcation analysis including all
deformation modes, and (iii) their ratios with respect to the lowest local (MbL) and global (MbG)
information stated in Table 2 that all beams first “non-distortional” bifurcation bending moments are significantly above McrD and correspond to local modes.
Beam
F beams P beams
LD McrD MbL MbG LD McrD MbL MbG
(cm) (kNcm) McrD McrD (cm) (kNcm) McrD McrD
S45-075 25 226.6 7.4 130.0 35 318.8 5.4 106.8
S45-090 35 210.9 4.8 123.8 50 301.5 3.5 96.2
S45-120 40 1310.5 4.5 46.4 60 1920.7 3.1 31.9
S45-140 50 725.5 4.0 105.7 80 1075.1 2.7 63.1
S45-150 40 1426.4 5.4 192.6 75 1995.3 4.0 88.8
S90-075 20 292.5 4.2 292.1 30 421.2 3.0 204.3
S90-090 25 280.3 3.1 330.1 40 408.5 2.2 200.5
S90-120 30 1744.9 3.3 95.4 50 2530.6 2.3 53.7
S90-140 40 982.0 2.8 201.7 65 1437.0 1.9 118.3
S90-150 40 1983.5 3.5 242.7 65 2659.6 2.7 156.7
Table 2: Selected beam lengths, critical buckling moments and bifurcation-to-critical moment ratios.
The buckling/bifurcation analysis performed on GBTul also produced the curves Mcr vs. L
(with L in logarithmic scale) to allow the comparison between different beams. These curves are shown in Figure 1 for S45 and S90 075 beams, as an example, where the length value (LD) and the
corresponding distortional critical buckling mode shape are illustrated. One notices that all beams exhibit similar single half-wave buckling mode shape comparing the “P” and “F” conditions, accord-ing to the last specification for beam selection.
0 200 400 600
10 100 1000
0 200 400 600
10 100 1000
0 200 400 600
10 100 1000
0 200 400 600
10 100 1000
LD Mcr(kN∙cm)
L (cm)
LD
Mcr(kN∙cm)
Mcr(kN∙cm) Mcr(kN∙cm)
LD
LD
L (cm)
L (cm) L (cm)
(a1)
(b1)
(a2)
(b2)
3 NUMERICAL MODEL – FE ANALYSIS
The beam distortional post-buckling equilibrium paths and ultimate strength values were deter-mined through ANSYS (2009) geometrically and materially non-linear SFEA – employing models similar to those used in previous studies (e.g., Martins et al. 2016). The beams were discretized into SHELL181 elements (ANSYS nomenclature – 4-node shear deformable thin-shell elements with six degrees of freedom per node and full integration). The analyses were performed by means of an incremental-iterative technique combining Newton-Raphson’s method with an arc-length control strategy - in some cases, the stabilization control strategy substituted the arc-length, aiming a faster convergence. After several mesh tests (Barichello 2016), a satisfactory accuracy was reached for a 5mm × 5mm mesh. The material behavior was deemed either perfectly elastic or elastic-perfectly plastic (Prandtl-Reuss model: von Mises yield criterion and associated flow rule), with an elastic modulus E = 210 GPa, a Poisson’s ratio ν= 0.3 and various yield stresses fy. Several yield stresses
considered in this work are unrealistically high, corresponding to E/fy values as low 60, i.e., largely
below the 340 limit value currently prescribed by AISI (2012) for the application of the DSM pre-qualified beams. Such high yield stresses were selected to enable the analysis of beams with high slenderness values, thus making it possible to cover a wide (distortional) slenderness range. Strain-hardening, residual stresses and rounded corner effects were not included in this work note that it has been reported in the literature (e.g., Ellobody and Young 2005 and Shi et al. 2011) that the combined influence of strain hardening, residual stresses and rounded corner effects has little impact on the failure loads.
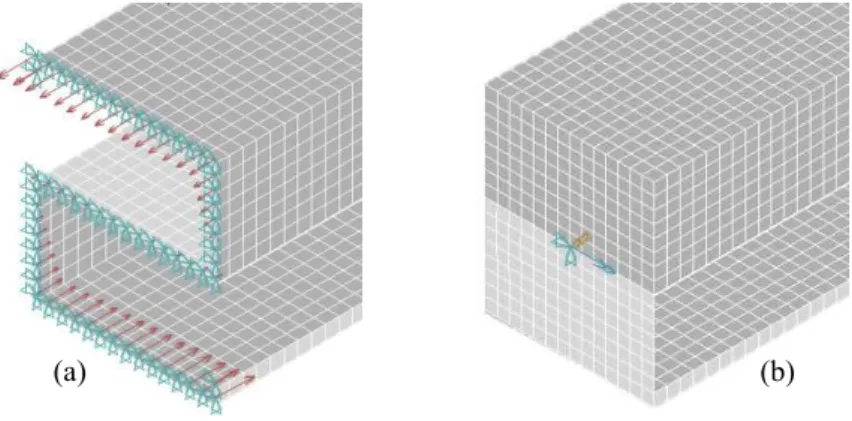
Figure 2 depicted the two types end support conditions considered in this work: F and P beams. For the F beams (Fig. 2a), the nodes of the end cross-section are simply restricted in the vertical and transversal direction while, for the P beams (Fig. 2b), a rigid plate was attached to the end cross-sections in order to restricted warping and local/global displacements and rotations. In both cases (F or P beams), the rigid-body axial translation is free at end sections due to the load applica-tion.
Figure 2: End support conditions and applied bending moment details at S90-075 (a) F and (b) P beams.
The uniform bending is achieved through the application of either (i) sets of concentrated forces acting on the nodes of both end cross-sections section (F beam, Fig 2a) or (ii) two concentrated
moments acting on the rigid end-plates (P beams, Fig. 2b). In both cases, moment application was increased in small increments, by means of the ANSYS automatic load stepping procedure. All the beams contained initial geometrical imperfections with a critical-mode (distortional) shape and small amplitude (10% of the wall thickness t). These initial imperfections involve inward com-pressed flange-lip motions, since they are most detrimental, in the sense of leading to lower post-buckling strengths (e.g., Barichello 2016). Each critical buckling mode shape was determined by means of a preliminary ANSYS buckling/bifurcation analysis, performed with exactly the same shell finite element mesh employed to carry out the subsequent non-linear (post-buckling) analysis – this procedure makes it very easy to “transform” the buckling analysis output into a non-linear analysis input.
4 DISTORTIONAL POST-BUCKLING RESPONSE
The results for the elastic post-buckling behavior of the S45 and S90 sections are illustrated on sec-tion 4.1, while the inelastic post-buckling is discussed on secsec-tion 4.2. Finally, the results obtained for the analyzed sections are compared with the DSM estimates for ultimate strength on section 4.3.
4.1 Elastic Post-Buckling Behavior
Considering that the inward compressed flange-lip motion leads to lower post-buckling strengths for CFS beam sections – as stated in Prola and Camotim (2002), Landesmann and Camotim (2015) and Martins et al. (2016), the elastic post-buckling analyses were carried out in this work compris-ing this condition. For comparison purposes, the elastic post-bucklcompris-ing equilibrium paths relatcompris-ing the applied bending moment M, normalized with respect to McrD, to the normalized displacement |δ|/t,
where |δ| is the mid-span (maximum) vertical displacement of the compressed flange-stiffener corner and t is the wall thickness, for the S F and P beams are plotted in Figure 3 (note that the numbers included in Fig. 3 represent the S beams identification (values of bw) provided in Table 1). The
ob-servation of these two sets of distortional post-buckling equilibrium paths prompts the following remarks:
(i) First of all, the higher stiffness and strength exhibited by the P beams is clearly evidenced by comparing Figs. 3(a) and 3(b). Moreover, there is also a clear difference between the P and F beam equilibrium path configurations: while the former exhibit a progressive stiffness degradation, leading to elastic limit points, the latter display a perceptible stiffness increase, which is provided by the end cross-section warping fixity and precludes the occurrence of elastic limit points (at least for acceptable, i.e., not too large displacement values).
0 1 2 3
0 5 10 15
075 090
120 140
150
0 1 2 3
0 5 10 15
075 090
120 140 150
0 1 2 3
0 5 10 15
075
140 090150
120
0 1 2 3
0 5 10 15
075
140 090
150 120
M/M
crDM/M
crDM/M
crDM/M
crD|
δ
|/
t
|
δ
|/
t
|
δ
|/
t
|
δ
|/
t
(a
1)
(b
1)
(a
2)
(b
2)
Figure 3: Elastic equilibrium paths M/McrD vs.|δ|/t of the F (a) and P (b) for S45 (1) and S90 (2) beams.
4.2 Elastic-Plastic Post-Buckling Behavior
The same ANSYS finite element model described on section 3 was applied to develop a parametric study with the purpose of assessing the elastic-plastic post-buckling and ultimate strength of ana-lyzed beams. Therefore, the results presented in this section concern to 280 beams, including (i) the
2x5 geometries presented in Table 1 (S45 and S90 shapes), (ii) the 2 end support conditions consid-ered (F and P), and (iii) 14 distortional slenderness values (λD varying between 0.25 and 3.5 with 0.25 intervals) – recalling that λD = [My/McrD]0.5 and My = S∙fy. All beams were modeled with
in-ward initial imperfections (according to the discussion on section 3). Figure 4 reproduces the S45-075 F and P beams deformed configurations in the proximity of failure for λD = 1.5 (which
corre-sponds to fy = 387 and 545 MPa, respectively for F and P beams), where the distortional behavior
of the beam failure modes is visible. All 280 beams analyzed exhibit failure modes characterized by inward flange-lip motions.
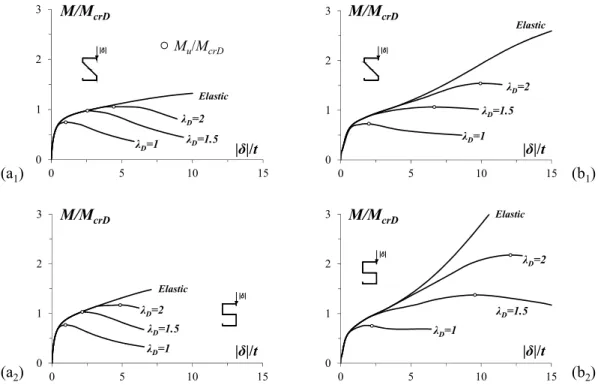
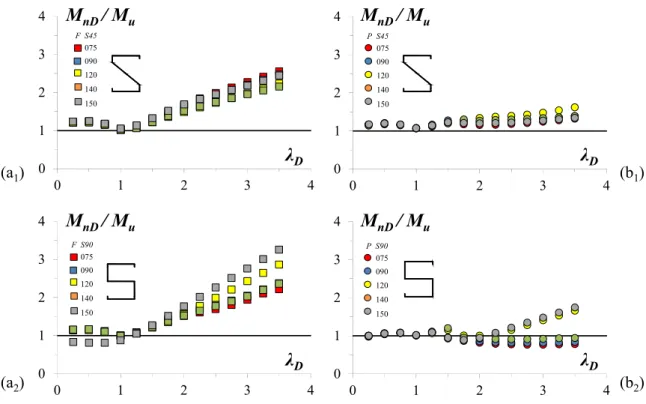
Figure 5 illustrates the non-linear and elastic-plastic equilibrium paths M/McrD versus |δ|/t and
used to obtain the ultimate moments Mu (represented by white circles) for the S45 and S90 075 (F
and P beams), with λD = 1.0, 1.5 and 2.0. On the other hand, Figure 6 displays the ratios Mu/McrD
versus λD for S45 and S90 (F and P beams). Tables A1 and A2 in Annex A of the paper (which
about the (i) distortional slenderness, (ii) the (|δ|/t)lim value (associated to the ultimate moment),
(iii) the yielding moment My, (iv) the numerical ultimate bending moment Mu,(v) DSM ultimate
moment estimate MnD, and (vi) the ratio Mu/ McrD. The observation of the results displayed in
these plots and Tables A1 and A2, leads to the following comments:
Figure 4: Distortional failure modes of S45-075 (a) F and (b) P beams.
0 1 2 3
0 5 10 15
0 1 2 3
0 5 10 15
0 1 2 3
0 5 10 15
0 1 2 3
0 5 10 15
|δ|/t
Elastic
|δ|/t
|δ|/t
|δ|/t Elastic
Elastic Elastic
λD=1.5 λD=1
λD=1
λD=1
λD=1 M/McrD M/McrD
M/McrD M/McrD
λD=1.5
λD=1.5
λD=1.5
λD=2
λD=2
λD=2
λD=2
(a1) (b1)
(a2) (b2)
Mu/McrD
Figure 5: Elastic-plastic equilibrium paths M/McrD vs. |δ|/t of the F (a) and P (b) for S45 (1) and S90 (2) beams.
(i) The ultimate moment Mu and respective (|δ|/t)lim values increase as the slenderness
increas-es, for all the analyzed beams and for both end support conditions. This behavior is also ev-idenced by the Figure 6: regarding the ones with ratio Mu/McrD ≤1, as they fail below the critical bending moment, they present a little elastic-plastic strength reserve and a small ductility preceding the failure. In this range, the curves for F and P beams have almost the same behavior. On the other hand, for ratios Mu/McrD >1 the behavior is completely
ent: F beams practically collapse right after the onset of yielding, while the P beams present a pronounced elastic-plastic strength reserve, which is attributed to the increase of the stiff-ness near the beam ends constrained.
(ii)The influence of the flange-lip width ratio (bf /bl) on the S-beam post-critical strength
re-serve (particularly the P beam one), which can be confirmed by looking at Figs. 6(b1)-(b2).
Indeed, while the 075 beams (bf /bl = 13) display the highest ultimate strengths (more
visi-ble for λD >1.5), the 120 ones (bf /bl = 7.5), exhibit the lowest ones (or very close to them).
Naturally, such differences entail a “vertical dispersion” of the set of Mu/My values
corre-sponding to a given λD recall that the DSM distortional strength curve depends solely on
λD, determined on the sole basis of the critical buckling/bifurcation and yield moments).
(a1) 0 1 2 3 4
0 1 2 3 4
0 1 2 3 4
0 1 2 3 4
0 1 2 3 4
0 1 2 3 4
0 1 2 3 4
0 1 2 3 4
M
u/ M
crDλ
DM
u/ M
crDM
u/ M
crDM
u/ M
crDλ
Dλ
Dλ
D (b1)(a2) (b2)
F S45
075 090 120 140 150
P S45
075 090 120 140 150
F S90
075 090 120 140 150
P S90
075 090 120 140 150
Figure 6: Plots of the F (a) and P (b) for S45 (1) and S90 (2) beams Mu/McrD ratios against the distortional slenderness λD.
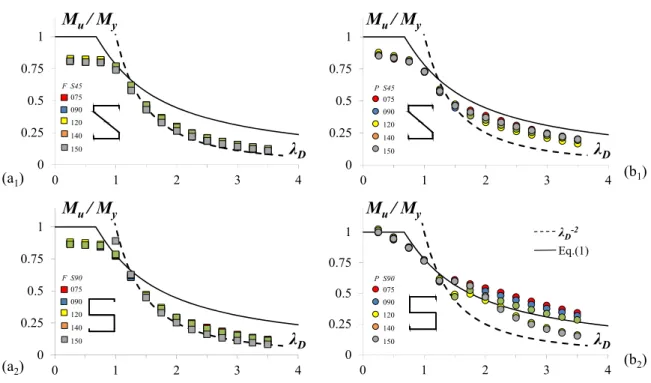
The observation of the ratios Mu/My versus λD (plotted in Figure 7) prompts the following
re-marks:
(i) The slenderer beams (λD ≥ 1.25) follow the trend of the elastic buckling strength curve
(1/λD 2), specially the F ones.
(ii)The P beams present some vertical dispersion in comparison to the curve (1/λD 2) – their
beams are the ones that exhibited the highest dispersion. It is worth noting that the disper-sion increases with the slenderness λD.
Figure 8 illustrates the S45-075 F and P beam with λD = 1.0 (with the corresponding fy = 172
and 242 MPa) elastic and elastic-plastic equilibrium paths and the progression of their deformed configurations and respective von Mises stress (fVM) contours – before, at and beyond the peak
mo-ment. The sets of diagrams correspond to the equilibrium states marked on the respective equilibri-um path. It shall be considered that (i) the deformed configurations are magnified by 3 times scale, and (ii) the point named state II refers to the beam failure. The plots in Figure 8 lead to the follow-ing observations:
(i) The yielding initiates at the compressed lip free edge mid-span area – as shown in state I. The occurrence of the collapse for both beams is associated to the complete yielding of the web-flange corner at mid-span, inducing the creation of a “distortional plastic hinge” – de-picted in state II, which implies that the plasticity has already propagated over the com-pressed lip mid-span zone.
(ii)The compressed flange yielding occurs regularly over the descendent branch of the equilibrium path – shown in state III and IV. However, the spread of plasticity rate, after the onset of yield-ing, is much higher in the F beams than in their P counterparts. Moreover, the stress diagrams IV indicate the occurrence of elastic unloading in the mid-span compressed flange regions of the F (mostly) and P beams. Similar behavior is observed and reported in Landesmann and Camo-tim (2015). 0 0.25 0.5 0.75 1
0 1 2 3 4
0 0.25 0.5 0.75 1
0 1 2 3 4
0 0.25 0.5 0.75 1
0 1 2 3 4
0 0.25 0.5 0.75 1
0 1 2 3 4
M
u/ M
yλ
DM
u/ M
yM
u/ M
yM
u/ M
yλ
Dλ
Dλ
D(a1) (b1)
(a2) (b2)
F S45 075 090 120 140 150
P S45 075 090 120 140 150
F S90 075 090 120 140 150
P S90 075 090 120 140 150
λD-2
Eq.(1)
0 1 2 3
0 2.5 5 7.5 10
M/McrD
|δ|/t
λD=1
Elastic
I
IV III II
0 1 2 3
0 2.5 5 7.5 10
M/McrD
|δ|/t
λD=1
Elastic
I II III IV
0 0.17 0.33 0.50 0.66 0.83 1.0 fv M. fy
I
II
III
IV I
II
III
IV
(a)
(b)
Figure 8: S45-075 (a) F and (b) P beam elastic and elastic-plastic equilibrium paths, deformed configurations (including the collapse mechanisms) and von Mises stress contours (λD =1.0).
4.3 Direct Strength Method
This section addresses the applicability of the current Direct Strength Method (DSM) distortional design curve to predict the ultimate moments of the S beams analyzed in this work. The nominal ultimate bending moment of cold-formed steel beams failing in distortional modes is given by the DSM equation/curve (Eq. 1)
0.5
0.5for
0.673
1-0.22
for
0.673
D
D y
nD
y crD y crD y
M
M
M
M
M
M
M
(1)
Figure 7 (previously depicted in Section 4.) compares the current DSM distortional design curve with the numerical ultimate moment ratios Mu/My obtained in this work (values in Tables A1 to
A2 of the Annex A). Figure 9, on the other hand, plots the ratios MnD /Mu against the distortional
slenderness λD, thus providing pictorial representations of the accuracy and safety of the DSM
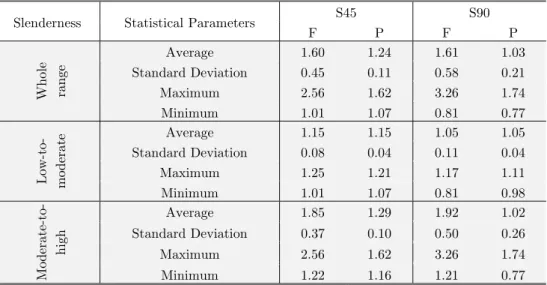
dis-tortional ultimate moment estimates. Finally, Table 3 provides the averages, standard deviations and maximum/minimum values of MnD /Mu. The observation of these two figures and results leads
(i) The behavior of the beams can be clearly distinguished in low-to-moderate slenderness (i.e., λD < 1.25) and moderate-to-high slenderness (λD ≥1.25) and there is a significant difference
in the behavior of F and P beams, as suggested in section 4.2.
(ii)In the low-to-moderate slenderness region, the numerical results for S45 and S90 F beams, the DSM overestimates the ultimate bending moments considerably. While for the P beams, the DSM curve overestimates the ultimate bending for the “S” type beams.
(iii)In the moderate-to-high slenderness region, the F beams practically follow the trend of the elastic buckling strength curve (1/λD 2), thus, the DSM is clearly overestimating these
ulti-mate moments. For the P beams, in the same region, there is an overestimation, while for the S90 P beams there is mostly underestimation, by the DSM curve.
(iv)The observation of the statistical parameters enhances the DSM curve behavior above men-tioned. The average values for S45 and S90 beams ratios MnD/Mu are substantially lower for
the low-to-moderate slenderness range and higher for the moderate-to-high than the same values considering the whole range, indicating that the DSM predictions best fit occurs in the low-to-moderate slenderness range for both end support conditions. Besides, the average and standard deviation for the F beams are also higher than the P ones, confirming that the DSM predictions are less accurate for the former end support condition.
(v)The results obtained in this study evidence that the DSM distortional curve predictions for ultimate bending moments lead to an overestimation of the analyzed beam type’s strength, especially in the moderate-to-high slenderness region.
0 1 2 3 4
0 1 2 3 4
0 1 2 3 4
0 1 2 3 4
0 1 2 3 4
0 1 2 3 4
0 1 2 3 4
0 1 2 3 4
M
nD/ M
uλ
DM
nD/ M
uM
nD/ M
uM
nD/ M
uλ
Dλ
Dλ
D(a1) (b1)
(a2) (b2)
F S45
075 090 120 140 150
P S45
075 090 120 140 150
F S90
075 090 120 140 150
P S90
075 090 120 140 150
Slenderness Statistical Parameters S45 S90 F P F P
Whole range
Average 1.60 1.24 1.61 1.03
Standard Deviation 0.45 0.11 0.58 0.21
Maximum 2.56 1.62 3.26 1.74
Minimum 1.01 1.07 0.81 0.77
Low-to- moderate
Average 1.15 1.15 1.05 1.05
Standard Deviation 0.08 0.04 0.11 0.04
Maximum 1.25 1.21 1.17 1.11
Minimum 1.01 1.07 0.81 0.98
Mode
rate
-to-high
Average 1.85 1.29 1.92 1.02
Standard Deviation 0.37 0.10 0.50 0.26
Maximum 2.56 1.62 3.26 1.74
Minimum 1.22 1.16 1.21 0.77
Table 3: Statistical parameters for the ratios MnD/Mu sample.
5 CONCLUDING REMARKS
This paper reported the available results of a numerical investigation on the distortional post-buckling behavior, ultimate strength and design of cold-formed steel beams. These results concerned single-span beams (i) displaying 2 different cross-sections types (S45 and S90), chosen to ensure pure distortional buckling and failure modes, (ii) exhibiting several yield stresses, selected to cover a wide distortional slenderness range, and (iii) comprising 2 end support conditions – differing only about the warping and minor-axis flexural rotations constraint. The final goal of this research effort is to contribute towards the development and validation of an efficient DSM design approach for such members. Out of the various findings obtained in the course of this work, the following ones deserve to be specially mentioned:
(i) As expected, the cross-section dimensions influenced the distortional post-buckling response and the ultimate moment of the cold-formed S beams. The direct proportion of the ratios
bw/bl and bf/bl and the inverse proportion of the ratio bw/bf with greater distortional
strength were clearly demonstrated in the elastic and elastic-plastic analyses results.
(ii)The end support conditions were determinant in the beams post-buckling behavior. While the F beams practically followed the trend of the elastic buckling strength curve (1/λD 2),
the P beams presented a significant high vertical dispersion. The latter is due to the pro-nounced elastic-plastic strength reserve caused by its end cross-sections constraints.
(iii)Concerning the DSM distortional strength curve, it was verified a good agreement between its results in the low-to-moderate slenderness range. This was expected due to the fact that these section types are part of the data basis from where the DSM was created.
(v)The DSM predictions for the “S” type beams were inaccurate in the whole range of distor-tional slenderness. Thus, it would be necessary to conduct a larger investigation on the be-havior of the ultimate bending moments for the “S” type beams to precede a calibration in the DSM distortional strength curve so that it could be applicable to them.
References
ABNT (Brazilian Standards Association) (2010). Brazilian standard on design of cold-formed steel structures (ABNT NBR 14762:2010) (in Portuguese), Rio de Janeiro.
AISI (American Iron and Steel Institute) (2012). North American Specification (NAS) for the Design of Cold-Formed Steel Structural Members (AISI-S100-12), Washington DC.
Ansys (2009). Reference Manual, Swanson Analysis Systems (SAS), version 12.0.1.
AS/NZS (2005). Cold-formed steel structures (Standards of Australia/Standards of New Zealand), Sydney-Wellington.
Barichello, C. (2016). B., Behavior and DSM design of cold-formed steel “S” type beams experiencing distortional failure. M.Sc. Tthesis (in Portuguese), COPPE – Federal University of Rio de Janeiro/UFRJ, Rio de Janeiro, RJ, Brasil, 2016, Brazil.
Bebiano, R., Pina, P., Silvestre, N. and Camotim, D., (2010a.). GBTUL 1.0β – Buckling and Vibration Analysis of Thin-Walled Members – GBT Theoretical Background, DECivil/IST, Technical University of Lisbon. (http://www.civil.ist.utl.pt/gbt).
Bebiano, R., Pina, P., Silvestre, N. and Camotim, D., (2010b). GBTUL 1.0 β – Buckling and Vibration Analysis of Thin-Walled Members - User Manual, DECivil/IST, Technical University of Lisbon. (http://www.civil.ist.utl.pt/gbt).
Camotim, D., Dinis, P.B. and Martins A.D., (2016). Direct Strength Method (DSM) A general approach for the design of cold-formed steel structures, Recent Trends in Cold-Formed Steel Construction, C. Yu (ed.), Amsterdam, 69-105.
Ellobody, E. and Young, B. (2005). Behavior of cold-formed steel plain angle columns. Journal of Structural Engi-neering (ASCE), 131(3):469-478.
Landesmann, A. and Camotim, D. (2015). Distortional failure and DSM design of cold-formed steel lipped channel beams under elevated temperatures. Thin-Walled Structures 98:75-93.
Martins, A.D., Landesmann, A., Camotim, D. and Dinis, P.B., (2016). Distortional failure of cold-formed steel beams under uniform bending: behavior, strength and DSM design. Proceedings of the Annual Stability Conference Struc-tural Stability Research Council. Orlando, Florida, April 12-15.
Prola, L.C. and Camotim, D. (2002). On the distortional post-buckling behavior of cold-formed lipped channel steel beams. Advances in Steel Structures 1:331-339.
Schafer B.W. (1997). Cold-Formed steel behavior and design: analytical and numerical modeling of elements and members with longitudinal stiffeners. Ph.D. Dissertation, Cornell University, Ithaca, USA.
Schafer, B.W. (2006). Review: the Direct Strength Method of cold-formed steel member design. International Collo-quium on Stability and Ductility of Steel Structures. Lisbon, Portugal.
Schafer, B.W. and Peköz, T. (1998). Direct strength prediction of cold-formed steel members using numerical elastic buckling solutions. Fourteenth International Specialty Conference on Cold-Formed Steel Structures. St. Louis, Oct. 15-16.
Wang, L. and Young, B. (2014). Design of cold-formed steel channel with stiffened webs subjected to bending. Thin-Walled Structures, 85(Dec):81-92.
Yu, C. and Schafer, B.W. (2005). Distortional buckling of cold-formed steel members in bending. The American Iron and Steel Institute (AISI) Final report, January.
Yu, C. and Schafer, B.W. (2006). Distortional buckling of cold-formed steel members. J. of Structural Eng., 132(4):515-528.
Yu, C. and Schafer, B.W. (2007). Simulation of cold-formed steel beams in local and distortional buckling with ap-plications to the Direct Strength Method. Journal of Constructional Steel Research 63(5):581-590.
ANNEX A
Tables A1 and A2 provide the numerical beam ultimate moments and their DSM estimates. Each table concerns one beam shape (S45 and S90, respectively – geometry given in Table 1) for both P and F end support conditions, and provides information about the (i) distortional slenderness, (ii) the (|δ|/t)lim value (associated to the ultimate moment), (iii) the yielding moment My, (iv) the
nu-merical ultimate bending moment Mu,(v) DSM ultimate moment estimate MnD, and (vi) the ratio Mu/ McrD. Note that all values of bending moments (My,Mu,MnD) are in kNcm.
S45 λD
F beams P beams
(|δ|/t)lim My Mu MnD Mu/ McrD (|δ|/t)lim My Mu MnD Mu/ McrD
S45 λD
F beams P beams
(|δ|/t)lim My Mu MnD Mu/ McrD (|δ|/t)lim My Mu MnD Mu/ McrD
3.25 12.78 2227.94 273.83 639.14 1.30 18.08 3184.43 673.90 913.46 2.24 3.50 14.82 2584.15 280.27 691.92 1.33 19.30 3692.35 711.85 988.71 2.36 120 0.25 0.01 81.27 67.27 81.27 0.05 0.85 119.97 105.36 119.97 0.05 0.50 0.08 328.96 270.72 328.96 0.21 0.60 479.89 408.82 479.89 0.21 0.75 0.33 735.32 602.20 693.34 0.46 1.37 1079.76 885.15 1017.54 0.46 1.00 1.57 1311.96 1006.50 1022.92 0.77 3.31 1919.57 1403.90 1497.57 0.73 1.25 3.19 2047.28 1252.90 1349.66 0.96 5.55 2999.32 1770.35 1977.61 0.92 1.50 4.98 2949.01 1376.25 1677.57 1.05 7.30 4322.89 2048.05 2458.93 1.07 1.75 6.24 4013.29 1474.20 2005.03 1.12 8.99 5882.54 2300.00 2938.77 1.20 2.00 7.43 5240.10 1567.10 2332.22 1.20 11.05 7682.13 2549.40 3418.67 1.33 2.25 8.86 6633.34 1650.35 2660.08 1.26 14.64 9721.67 2839.45 3898.59 1.48 2.50 10.02 8189.11 1726.10 2987.64 1.32 16.36 12005.02 3138.40 4379.31 1.63 2.75 11.21 9911.31 1790.40 3315.68 1.37 17.76 14524.45 3396.10 4859.20 1.77 3.00 11.95 11796.04 1844.10 3643.45 1.41 18.79 17287.70 3611.20 5339.76 1.88 3.25 13.00 13843.32 1885.95 3970.99 1.44 20.37 20287.02 3774.60 5819.64 1.97 3.50 13.73 16053.14 1923.15 4298.37 1.47 21.85 23530.16 3885.55 6300.10 2.02 140 0.25 0.01 43.72 35.32 43.72 0.05 0.33 68.01 58.52 68.01 0.05 0.50 0.06 179.75 144.18 179.75 0.20 0.68 267.20 224.33 267.20 0.21 0.75 0.25 408.08 326.29 384.50 0.45 1.26 602.40 488.30 568.23 0.45 1.00 1.67 723.86 557.05 565.06 0.77 3.35 1073.64 784.55 837.84 0.73 1.25 2.88 1131.94 702.35 746.58 0.97 5.30 1680.90 979.95 1107.76 0.91 1.50 4.40 1632.32 758.20 928.60 1.05 7.32 2419.33 1123.05 1376.22 1.04 1.75 6.10 2220.15 801.55 1109.50 1.10 8.90 3293.79 1262.50 1645.24 1.17 2.00 7.67 2900.28 848.55 1290.93 1.17 17.91 4299.42 1508.70 1913.40 1.40 2.25 9.04 3672.72 898.10 1472.70 1.24 18.53 5441.07 1691.20 2182.05 1.57 2.50 10.26 4532.61 945.00 1653.74 1.30 19.07 6718.75 1885.60 2451.06 1.75 2.75 11.31 5484.79 989.60 1835.14 1.36 19.83 8132.46 2065.00 2720.32 1.92 3.00 12.97 6529.28 1031.45 2016.80 1.42 21.37 9677.33 2234.10 2988.96 2.08 3.25 13.72 7661.22 1070.35 2197.92 1.48 23.11 11353.38 2397.75 3257.13 2.23 3.50 14.84 8885.46 1103.80 2379.30 1.52 23.71 13170.30 2533.90 3526.31 2.36 150 0.25 0.01 85.83 69.40 85.83 0.05 0.38 128.74 109.59 128.74 0.05 0.50 0.05 360.48 288.84 360.48 0.20 0.46 497.81 415.26 497.81 0.21 0.75 0.22 798.21 637.20 753.23 0.45 0.95 1124.37 905.65 1058.85 0.45 1.00 0.89 1424.77 1054.50 1111.78 0.74 2.12 1991.24 1449.45 1554.31 0.73 1.25 1.64 2231.56 1293.85 1470.33 0.91 3.63 3115.61 1795.50 2054.35 0.90 1.50 2.97 3210.02 1376.05 1826.01 0.96 5.42 4488.88 2078.35 2553.81 1.04 1.75 3.05 4368.72 1437.25 2182.51 1.01 11.33 6111.05 2523.20 3052.95 1.26 2.00 5.45 5707.66 1503.90 2539.53 1.05 12.15 7982.13 2957.45 3551.88 1.48 2.25 6.67 7218.25 1584.10 2894.97 1.11 12.34 10102.12 3354.70 4050.68 1.68 2.50 7.52 8917.67 1666.65 3252.76 1.17 13.14 12471.01 3725.70 4549.38 1.87 2.75 8.76 10788.76 1744.75 3609.12 1.22 14.05 15088.81 4062.10 5048.01 2.04 3.00 9.96 12840.08 1816.65 3965.84 1.27 15.00 17955.51 4358.85 5546.59 2.18 3.25 11.18 15063.06 1871.95 4321.52 1.31 15.94 21079.70 4624.20 6046.46 2.32 3.50 11.04 17474.87 1913.60 4678.84 1.34 17.06 24444.21 4863.50 6544.87 2.44
S90 λD
F beams P beams
(|δ|/t)lim My Mu MnD Mu/ McrD (|δ|/t)lim My Mu MnD Mu/ McrD
S90 λD
F beams P beams
(|δ|/t)lim My Mu MnD Mu/ McrD (|δ|/t)lim My Mu MnD Mu/ McrD
1.25 2.72 1536.72 957.30 1012.39 0.97 4.51 2245.23 1351.60 1480.07 0.94 1.50 3.79 2211.72 1025.35 1257.70 1.04 5.58 3231.41 1528.90 1838.74 1.06 1.75 4.74 3006.41 1087.10 1502.18 1.11 15.05 4399.51 2309.85 2198.23 1.61 2.00 5.77 3925.57 1146.80 1747.34 1.17 16.33 5749.52 2758.25 2558.23 1.92 2.25 6.69 4969.20 1207.60 1992.97 1.23 17.52 7276.67 3188.45 2917.51 2.22 2.50 7.63 6137.29 1260.65 2238.91 1.28 18.70 8980.94 3600.40 3276.28 2.51 2.75 8.47 7425.07 1308.00 2484.21 1.33 19.80 10867.13 3987.20 3635.56 2.77 3.00 8.79 8837.32 1343.70 2729.83 1.37 20.77 12935.23 4336.90 3995.21 3.02 3.25 8.84 10374.04 1352.60 2975.70 1.38 21.68 15180.47 4649.60 4354.42 3.24 3.50 10.22 12030.44 1363.30 3221.08 1.39 22.59 17602.83 5000.00 4713.28 3.48 150 0.25 0.01 126.94 152.63 126.94 0.08 0.79 169.25 169.02 169.25 0.06 0.50 0.17 499.28 614.20 499.28 0.31 1.14 668.53 631.90 668.53 0.24 0.75 0.83 1117.03 1297.10 1052.12 0.65 1.31 1497.84 1305.65 1410.79 0.49 1.00 1.88 1980.19 1763.30 1545.47 0.89 2.21 2657.18 2032.70 2073.27 0.76 1.25 3.19 3097.22 1945.40 2042.19 0.98 3.42 4155.02 2507.85 2739.14 0.94 1.50 2.75 4459.66 1997.60 2537.79 1.01 11.17 5982.89 3589.20 3403.88 1.35 1.75 2.75 6075.97 1997.60 3035.16 1.01 12.40 8140.79 4572.90 4067.97 1.72 2.00 2.75 7937.69 1997.60 3531.53 1.01 10.28 10637.18 5000.00 4733.77 1.88 2.25 2.75 10044.82 1997.60 4027.22 1.01 9.25 13463.61 5000.00 5398.84 1.88 2.50 2.75 12397.35 1997.60 4522.44 1.01 8.68 16620.07 5000.00 6063.39 1.88 2.75 2.75 15003.76 1997.60 5018.86 1.01 8.48 20115.02 5000.00 6729.10 1.88 3.00 2.75 17847.11 1997.60 5513.36 1.01 8.40 23940.01 5000.00 7394.27 1.88 3.25 2.75 20952.80 1997.60 6010.28 1.01 8.36 28095.03 5000.00 8059.03 1.88 3.50 2.75 24295.43 1997.60 6505.48 1.01 8.36 32580.07 5000.00 8723.46 1.88