THIN-WALLED STRUCTURES ICTWS2018 Lisbon, Portugal, July 24-27, 2018
POST-BUCKLING BEHAVIOUR OF REGULAR CONVEX POLYGONAL
COLUMNS BUCKLING IN LOCAL AND DISTORTIONAL MODES
André Dias Martins*, Rodrigo Gonçalves** and Dinar Camotim*
* CERIS, ICIST, DECivil, Instituto Superior Técnico, Universidade de Lisboa, 1049-001 Lisbon, Portugal e-mails: [email protected], [email protected]
** CERIS, ICIST and Departamento de Engenharia Civil, Faculdade de Ciências e Tecnologia, Universidade Nova de Lisboa, 2829-516 Caparica, Portugal
e-mail: [email protected]
Keywords: Regular convex polygonal cross-section (RCPS) tubes; Thin-walled columns; Local, distortional and local-distortional interactive buckling; Generalised Beam Theory (GBT); Elastic post-buckling behaviour; Imperfection sensitivity.
Abstract. This paper presents and discusses numerical results concerning (i) the elastic local, distortional and local-distortional interactive post-buckling behaviours and (ii) the imperfection sensitivity of regular convex polygonal cross-section (RCPS) tubes under uniform compression. Although it was shown recently that the local and distortional buckling behaviours are characterised by duplicate bifurcation modes, knowledge concerning the corresponding post-buckling behaviour is still lacking. Moreover, the closeness between the local and distortional critical buckling loads invariably leads to a coupling phenomenon, i.e., local-distortional interaction, which means that sizeable post-critical strength erosion may occur, particularly if the local buckling load is the critical one. The results presented are obtained through a geometrically non-linear Generalised Beam Theory (GBT) formulation combined with a recently reported cross-section analysis specialised for RCPS members. This GBT specialisation is first employed to characterise the bifurcation behaviour, namely by helping to pinpoint the occurrence of the above three distinct buckling behaviours. Then, post-buckling results are presented and discussed for different combinations of the local-to-distortional buckling load ratio and the amplitude of the critical-mode initial geometrical imperfections, in order to assess their influence on the member imperfection sensitivity. For comparison and validation purposes, ABAQUS shell finite element values are reported.
1 INTRODUCTION
Thin-walled tubes with regular convex polygonal cross-sections (RCPS) are widely used in the construction industry, namely in towers and posts supporting lighting equipment and overhead power lines. Although it is undeniable that the local (plate-type) buckling and post-buckling behaviour of hollow-section members (including RCPS members) is currently very well understood (e.g., [1,2]), with the corresponding knowledge already adequately reflected in the current design specifications worldwide, the same is not true for the distortional, local-distortional or distortional-global behaviours of RCPS members – therefore, research concerning these behaviours is needed.
single deformation mode pair is often the solution of a given structural problem, which implies that
this “GBT specialisation” leads to significant computational savings and provides added insight on the RCPS member response. This novel procedure was validated and employed to analyse the first-order [8], vibration [9] and buckling behaviours of prismatic thin-walled tubes in the latter case, under compression [10] and bending and torsion [11]. A summary of the research work carried out on the GBT analysis of RCPS tubes is provided in [12]. This investigation unveiled striking and surprisingly peculiar behavioural features, namely that RCPS members (i) may be susceptible to cross-section distortion (in-plane and out-of-plane deformation), which may govern “intermediate -length” columns, (ii) exhibit duplicate local and distortional buckling (as well as vibration) modes for a wide range of geometries with practical interest, due to the cross-section rotational symmetry, and (iii) may be prone to the interaction between local and distortional buckling, as nearly coincident local and distortional critical buckling loads may occur for some cross-section dimensions. Thus, their post-buckling behaviour is bound to be also affected by local-distortional mode interaction effects. In this regard, it is worth mentioning that, to the authors’ best knowledge, there is no available research work on the influence of local-distortional interaction in RCPS columns. Indeed, most of the available investigations involve almost exclusively lipped open-section thin-walled members with more or less stable1 post-buckling behaviours (local and distortional, respectively) e.g., the recently GBT investigation on (i) simply supported and fixed-ended lipped channel columns [13] and (ii) simply supported uniformly bent lipped channel beams [14] affected by local-distortional interaction.
This paper presents and discusses the available results of an ongoing numerical investigation on the elastic post-buckling behaviour and imperfection sensitivity of uniformly compressed RCPS members buckling in local, distortional and local-distortional interactive modes. The work is carried out in the context of the Research Fund for Coal and Steel (RFCS) project RFCS-2015-709892
“Overall-Slenderness Based Direct Design for Strength and Stability of Innovative Hollow Sections – HOLLOSSTAB”, funded by the European Commission.
The outline of the paper is as follows. Section 2 provides a (i) brief review of the main features exhibited by the bifurcation behaviour of RCPS columns, based on results obtained by means of a computationally efficient GBT formulation, specialised for such members, and (ii) characterises the bifurcation behaviour of the various RCPS columns analysed in this document. Section 3 constitutes the main section of the paper and is devoted to presenting and discussing the local (Section 3.1), distortional (Section 3.2) and local-distortional interactive (Section 3.3) elastic post-buckling behaviours of RCPS columns, obtained by means of a geometrically non-linear GBT formulation [7,15] – for comparison purposes, ABAQUS [16] S4 shell finite element results are also presented. These results comprise several equilibrium paths, relevant displacement profiles, modal participation diagrams and column deformed configurations (2D and/or 3D). In particular, several combinations of critical-mode initial geometric imperfection shapes and amplitudes were considered, in order to assess the column imperfection sensitivity. Finally, Section 4 lists and highlights the most important findings of the work carried out and identifies relevant issues to be investigated in the near future.
2 BUCKLING BEHAVIOUR
2.1 Review
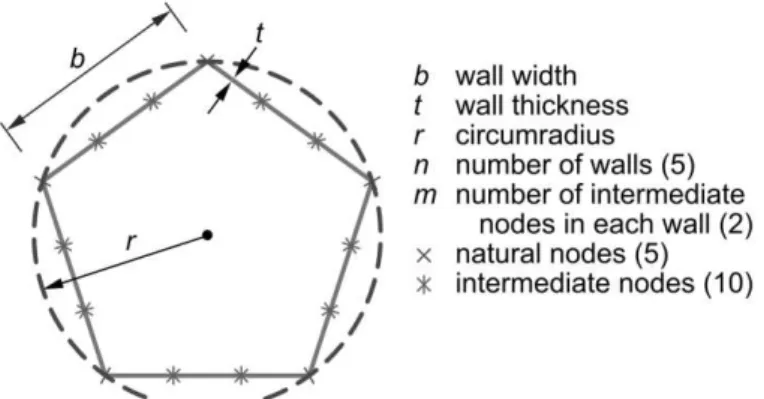
Following previous work by the authors [8-11], Fig. 1 shows the notation employed for the parameters defining the cross-section geometry (r, t, b, n) and the GBT discretisation (m) used to obtain the local deformation modes. Furthermore, two non-dimensional geometrical parameters are defined, namely
1 This statement is relevant since an “unexpected” unstable distortional bifurcation was unveiled in the context of RCPS columns,
Figure 1: Regular convex polygonal section (RCPS) parameters.
,
, 2
1
t r r
L
(1)
whereL isthe column length. In all cases, the elastic constants considered are E=210 GPa and =0.3. Concerning the RCPS member GBT analysis, it was shown in [8] that it is possible to use a GBT-based procedure much more efficient than the conventional one. In particular, the cross-section deformation modes are more efficiently obtained and the equilibrium equations become almost fully uncoupled. This stems from the cross-section rotational symmetry (of order n), leading to symmetric circulant and block-circulant GBT modal stiffness matrices.
Concerning the bifurcation behaviour of uniformly compressed RCPS members, this review focuses on the standard benchmark problem of simply supported columns, for which sinusoidal modal amplitude functions constitute exact solutions, thus leading to semi-analytical formulae. This semi-analytical approach makes it possible to acquire unique and in-depth information about the problem under scrutiny. For instance, the bifurcation stress associated with buckling in a single deformation mode k is given by
1 2 2 ,2
2 2 2
kk kk kk
kk k
b B
a L D
C L a
X
(2)
where Bkk, Ckk, Dkk and Xkk are the GBT stiffness coefficients pertaining to mode k, L is the member length and a is the buckling mode longitudinal half-wave number. The minimum buckling load and corresponding half-wave length are given by (e.g., [17])
2 , 4 / .min
, kk kk
kk kk kk kk
k
b C B
a L X
B C
D
(3)
(a) (c)
(b1) (b2)
Figure 2: Simply supported compressed tubes: (a) “signature” curve, individual mode curves and buckling mode shapes, (b) two-dimension buckling mode spaces for (1) local (n=3) and (2) distortional (n=20) buckling,
and (c) parameter ranges associated with local or distortional critical buckling.
defined by each duplicate solution and any mode lying in such space constitutes a possible critical buckling mode. In particular, Figs. 2(b1-b2) show the shapes of some modes belonging to the first local (n=3) and second distortional (n=20) mode spaces they depend on the amount of “rotation” occurring inside those spaces. Therefore, prescribing a specific critical-mode initial geometrical imperfection, to be employed in a 2nd-order analysis (as in this investigation – see Section 3), requires defining the rotation angle in the associated 2D mode space. However, matching the imperfections considered in shell finite element and GBT post-buckling analyses is far from trivial. For this reason, two MATLAB subroutines were implemented, concerning the SFEA and GBT results, respectively, to define/determine2the “rotation” applied to a given duplicate mode set to yield the desired shape.
Finally, the graph in Fig. 2(c) makes it possible to assess the 2 and n value ranges associated with either local or distortional critical buckling. This graph was obtained for =0.3 and using Eq. (2) for each mode separately therefore, no mode interaction is taken into consideration (this approximation yields small errors, as explained in [10]). Note that (i) members with low 2 and high n values buckle in distortional modes and (ii) the 2 value associated with the critical buckling mode nature transition increases exponentially with n. The dashed lines in Fig. 2(c) correspond to the Eurocode 3 [18] limits separating class 3 and 4 (slender) internal compressed walls and circular tubes made of S460 steel grade (the grade yielding the lowest limits). According to the internal compressed wall criterion, a class 4 cross-section exhibiting a critical distortional buckling mode is only possible for n > 19 and
2 > 90, whereas a much lower 2 limit is obtained with the circular tube criterion. Because the
2 Two approaches can be employed: (i) a trial-and-error approach (the one adopted) or (ii) solving a simple one-dimensional
behaviour of a RCPS member should approach that of a circular tube as n increases, a smooth transition between the two criteria should take place this is not the case. Indeed, the difference between the two criteria seems to indicate that RCPS columns with moderate-to-high n values may be of class 4 for n and 2 values below those provided by the internal compressed wall criterion.
2.2 Column geometry selection
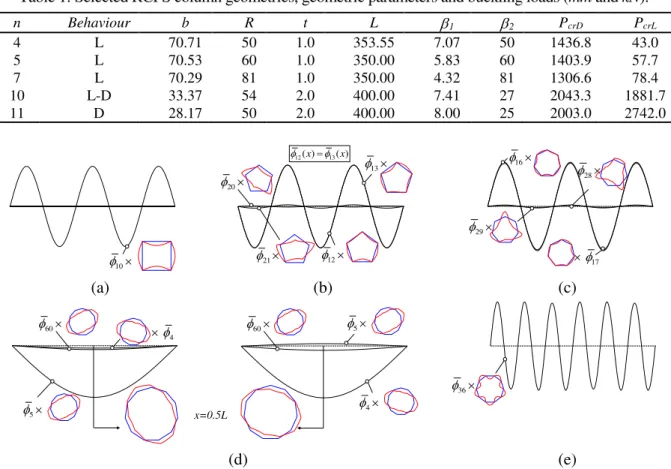
In order to investigate the mechanics underlying the local, distortional and local-distortional interactive geometrically non-linear behaviours of RCPS columns it is indispensable to begin by selecting column geometries (cross-section dimensions and lengths) corresponding to “appropriate” local and distortional critical buckling loads (PcrL and PcrD). Therefore, five simply supported (end cross-sections locally/globally pinned and free to warp) columns geometries were selected, such that (i) the first three exhibit a typical local post-buckling behaviour (n=4, 5 and 7), (ii) one exhibits a typical distortional post-buckling behaviour (n=11) and (iii) the last one is expected to undergo local-distortional interaction (n=10). The above RCPS column geometries were selected taking into account Fig. 2(c): the columns exhibiting local, distortional and local-distortional interactive post-buckling behaviours were selected to fall inside the local region, the distortional region and in the vicinity of the local-distortional transition boundary (thicker line in Fig. 2(c)), respectively. Table 1 shows the cross-section dimensions and lengths of the five columns selected (E=210GPa, v=0.3), as well as their local and distortional critical buckling loads. Moreover, Figs. 3(a)-(e) display the GBT modal amplitude functions of the critical buckling modes corresponding to most of the initial geometrical imperfections adopted in the GBT-based geometrically non-linear imperfect analyses (GNIA) reported in Section 3. Lastly, it should be mentioned that, due to lack of space (several cross-sections shapes are adopted in this study), the deformation mode shapes are omitted here (see [8]).
Table 1: Selected RCPS column geometries, geometric parameters and buckling loads (mm and kN).
n Behaviour b R t L 1 2 PcrD PcrL
4 L 70.71 50 1.0 353.55 7.07 50 1436.8 43.0
5 L 70.53 60 1.0 350.00 5.83 60 1403.9 57.7
7 L 70.29 81 1.0 350.00 4.32 81 1306.6 78.4
10 L-D 33.37 54 2.0 400.00 7.41 27 2043.3 1881.7
11 D 28.17 50 2.0 400.00 8.00 25 2003.0 2742.0
10
13
12
21
20
16
17
29
28
12( )x 13( )x
(a) (b) (c)
5
4
60
36
x=0.5L 5
60
4
(d) (e)
3 POST-BUCKLING BEHAVIOUR
3.1 Local
The post-buckling behaviour of RCPS columns buckling in local (plate-type) modes is addressed first. These buckling modes involve no column fold-line in-plane displacements and the walls buckle in modes similar to that exhibited by a simply supported plate, even if the critical buckling load is slightly higher for odd n, especially if n is small [10]. This post-buckling behaviour has been extensively studied in the past for a wide variety of cross-section shapes. Therefore, it seems fair to expect the local post-buckling behaviour of RCPS columns to be qualitatively similar to that exhibited by columns with other cross-sections.
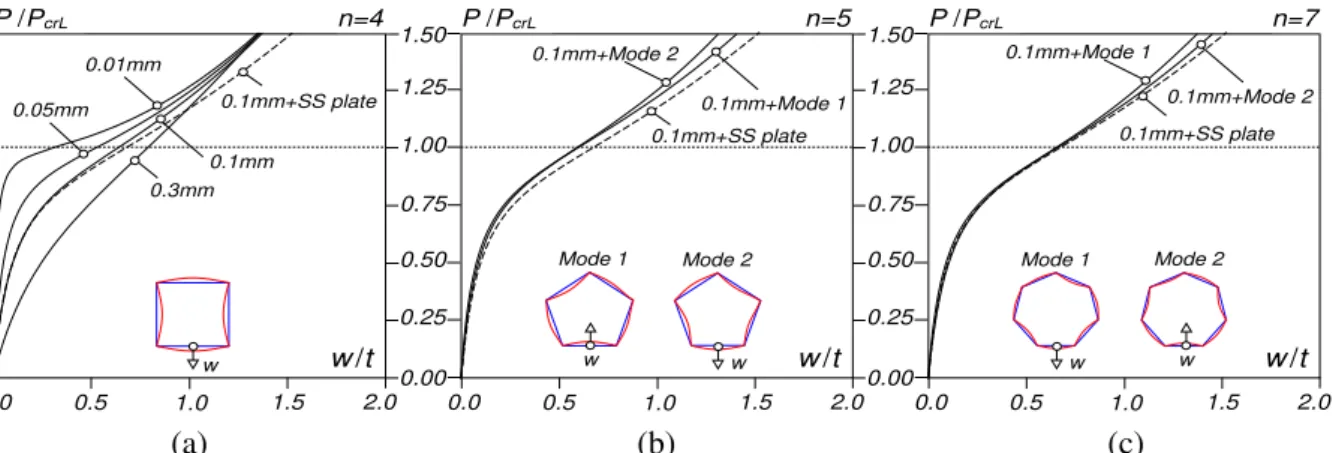
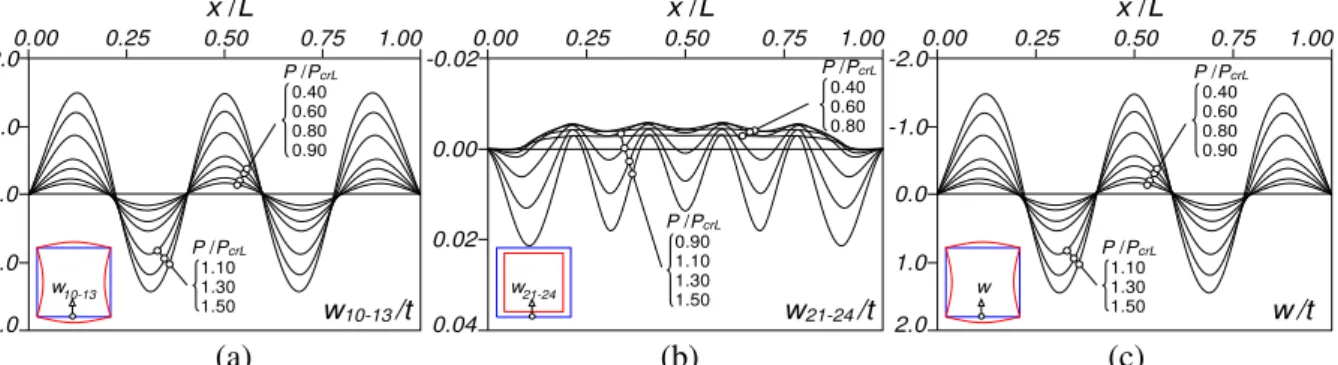
As mentioned in Section 2, n=4, n=5, n=7 RCPS columns (see Table 1) are excellent candidates to exhibit a typical local post-buckling behaviour, since the distortional buckling load is much higher, thus precluding the occurrence of local-distortional interaction. Figs. 4(a)-(c) show the GBT-based equilibrium paths P/PcrL vs. w/t (w is the mid-span mid-bottom wall transverse displacement caused by the applied load P, i.e., excluding the initial imperfections value), concerning the n=4 (Fig. 4(a)),
n=5 (Fig. 4(b)) and n=7 (Fig. 4(c)) RCPS columns, all containing critical-mode (local-type) initial geometrical imperfections. All these results were obtained (i) considering a single intermediate node per wall combined with 10 equally-spaced finite elements, and (ii) adopting a load-controlled incremental procedure. The n=4 column contains initial geometrical imperfections with various amplitudes, namely 0.01, 0.05, 0.1 and 0.3mm, to assess the amplitude sensitivity, while the n=5 and n=7 columns contain only a single amplitude of 0.1mm. Moreover, (i) the post-buckling response of a simply supported plate with a 0.1mm imperfection is also shown in Figs. 4(a)-(c), for comparison purposes, and (ii) the odd-sided columns (n=5 and n=7) are also analysed with initial geometrical imperfections akin to each of the duplicate buckling modes. On the other hand, Figs. 5(a)-(c) provide the evolution, as P/PcrL increases from 0 to 1.50, of the most relevant mid-bottom wall transverse displacement profiles (w(x)) due to the contributions from the (i) local w modes 10-13 (w10-13(x)), (ii) shear modes 21-24 (w21-24(x)), and (iii) all the modes (total displacement w 1-32(x)w(x)). Similarly, Figs. 6(a)-(i) also provide the most relevant mid-bottom wall transverse displacement profiles (w(x)), until P/PcrL=1.50, concerning the n=7 column with an initial geometrical imperfection akin to mode 1 (see Fig. 4(c)) in particular, it provides the contribution from mode(s) (i) 2 (w2(x)) – major-axis flexure, (ii) 3 (w3(x)) – minor-axis flexure, (iii) 4 (w4(x)), 5 (w5(x)), 6 (w6(x)) – distortional, (iv) 16-22 (w16-22(x)) – local w, (v) 24-29 (w24-29(x)) – shear, (vi) 36-42 (w36-42(x)) – linear transverse extension and (vii) all the modes (total displacement w1-56(x)w(x)).
Moreover, Figs. 7(a)-(c) provide the same output for the n=7 column with an initial geometrical imperfectionakintothe mode 2 (see Fig. 4(c)) but concerning only the displacement profiles w16-22(x),
w/t 25
00 75 25 0
w
50 0
0.01mm
0.1mm 0.3mm
00 75
P /PcrL
1.5 0.5
0.0 1.0 2.0
0.05mm
n=4
0.1mm+SS plate
w/t 0.25
0.00 1.00 1.50
0.50 1.25
0.1mm+Mode 2
0.75
P /PcrL
1.5 0.5
0.0 1.0 2.0
n=5
0.1mm+Mode 1 0.1mm+SS plate
w Mode 1
w Mode 2
w/t 0.25
0.00 1.00 1.50
0.50 1.25
0.1mm+Mode 1
0.75
P /PcrL
1.5 0.5
0.0 1.0 2.0
n=7
0.1mm+Mode 2 0.1mm+SS plate
w w
Mode 1 Mode 2
(a) (b) (c)
P /PcrL
1.10 1.30 1.50
x /L 0.00
-2.0
0.25 0.50 0.75 1.00
w10-13/t
-1.0
2.0 1.0 0.0
P /PcrL
0.40 0.60 0.80 0.90 w10-13
P /PcrL
0.90 1.10 1.30 1.50
x /L 0.00
-0.02
0.25 0.50 0.75 1.00
w21-24/t
0.04 0.02 0.00
P /PcrL
0.40 0.60 0.80
w21-24
P /PcrL
1.10 1.30 1.50
x /L 0.00
-2.0
0.25 0.50 0.75 1.00
w/t -1.0
2.0 1.0 0.0
P /PcrL
0.40 0.60 0.80 0.90 w
(a) (b) (c)
Figure 5: n=4 column displacement profiles (a) w10-13(x), (b) w21-24(x) and (c) w1-32(x)w(x).
x /L 0.00
0.0
0.25 0.50 0.75 1.00
w2/t
1.5 1.0
0.5 P /PcrL
0.60 0.80 0.90 1.00 1.10 1.30 1.50 w2 x10-2
x /L 0.00
0.0
0.25 0.50 0.75 1.00
w3/t
3.0 2.0
1.0 P /PcrL
0.60 0.80 0.90 1.00 1.10 1.30 1.50 w3 x10-2
x /L 0.00
0.0
0.25 0.50 0.75 1.00
w4/t
5.0 3.0 1.0
P /PcrL
0.90 1.00 1.10 1.30 1.50 w4 x10-2 2.0 4.0
(a) (b) (c)
x /L 0.00
0.0
0.25 0.50 0.75 1.00
w5/t
3.0 2.0 1.0
P /PcrL
0.80 0.90 1.00 1.10 1.30 1.50 w5 x10-2 2.5 0.5 1.5
x /L 0.00
-0.5
0.25 0.50 0.75 1.00
w6/t
3.0 2.0 0.5
P /PcrL
0.90 1.00 1.10 1.30 1.50 w6 x10-3 2.5 0.0 1.0 1.5
P /PcrL
1.10 1.30 1.50
x /L 0.00
-2.0
0.25 0.50 0.75 1.00
w16-22/t
-1.0
2.0 1.0 0.0
P /PcrL
0.60 0.80 0.90 1.00 w16-22
(d) (e) (f)
x /L 0.00
-2.0 0.25 0.50 0.75 1.00
6.0 4.0
P /PcrL
0.60 0.80 1.00 1.10 1.30 1.50 x10⁻³ 0.0 2.0
w24-29/t w24-29
x /L 0.00
-2.0 0.25 0.50 0.75 1.00
8.0
P /PcrL
0.90 1.00 1.10 1.20 1.30 1.50 x10⁻² 6.0 0.0 2.0 4.0
w36-42/t P /PcrL=0.80 P /PcrL=0.50
w36-42
P /PcrL
1.10 1.30 1.50
x /L 0.00
-2.0 0.25 0.50 0.75 1.00
w/t -1.0
2.0 1.0 0.0
P /PcrL
0.60 0.80 0.90 1.00 w
(g) (h) (i)
Figure 6: n=7+mode 1 column displacement profiles (a) w2(x), (b) w3(x), (c) w4(x), (d) w5(x), (e) w6(x), (f) w16-22(x), (g) w24-29(x), (h) w36-42(x) and (i) w1-56(x)w(x).
P /PcrL
1.10 1.30 1.50
x /L 0.00
-2.0
0.25 0.50 0.75 1.00
w16-22/t
-1.0
2.0 1.0 0.0
P /PcrL
0.60 0.80 0.90 1.00
w16-22
x /L 0.00
-2.0
0.25 0.50 0.75 1.00
6.0 4.0
P /PcrL
0.60 0.80 1.00 1.10 1.30 1.50 x10⁻³
0.0
2.0
w24-29/t w24-29
P /PcrL
1.10 1.30 1.50
x /L 0.00
-2.0
0.25 0.50 0.75 1.00
w/t -1.0
2.0 1.0 0.0
P /PcrL
0.60 0.80 0.90 1.00
w
(a) (b) (c)
Figure 7: n=7+Mode 2 column displacement profiles (a) w16-22(x), (b) w24-29(x) and (c) w1-56(x)w(x).
(a) (b1) (b2)
(c1) (c2)
Figure 8: GBT-based deformed configurations (amplified twice), for P/PcrL=1.50, of columns with 0.1mm amplitude local initial geometrical imperfections and (a) n=4, (b) n=5, (c) n=7 – (1) mode 1, (2) mode 2.
path for the n=4, n=5+mode 2 and n=7+mode 1 columns. The observation of all these GBT-based post-buckling results prompts the following remarks:
(i) Fig. 4(a) shows that the adoption of distinct initial geometrical amplitudes only influences the initial post-buckling stages – indeed, as the applied load increases, all equilibrium paths “merge” into a common curve. Moreover, the comparison between the equilibrium paths in Fig. 4(a), concerning (i1) RCPS columns (critical-mode initial geometrical imperfections with various amplitudes) and (i2) simply supported plates (0.1mm initial geometrical imperfection) confirms the expected similarity, which extends to any other column local post-buckling behaviour. Rigorously speaking, Fig. 4(a)-(c) clearly shows that the similarity between the RCPS column and plate post-buckling behaviours increases with the number of walls.
(ii) Note also that the post-buckling behaviour of RCPS columns with odd n (n=5 and n=7), which have duplicate local buckling modes, is not visibly affected by this peculiar behavioural feature (the differences are discussed in item (iv) below). Indeed, the equilibrium paths shown in Figs. 4(b)+(c) are very close to that associated with a “single” buckling mode (n=4 in this case), regardless of the imperfection shape adopted (associated with the duplicate buckling modes). (iii) Recalling that the local critical mode of the n=4 column exhibits five half-waves (see Fig. 3(a)),
shape/configuration as loading progresses (see Fig. 5(a)). Moreover, the comparison between Figs. 5(c) and 5(a) evidences the major role played by the local w modes in the column response
– the small difference between the two displacement profiles concerns the contribution from the linear transverse extension modes, which also exhibit five half-waves but have unequal amplitudes (more pronounced deformations localised in the regions where w16-22(x) peaks). The contributions from other sources of deformation to w(x) are negligible.
(iv) The longitudinal profiles of the odd-sided columns involve the participation of a higher number of deformation modes, although with small (but not negligible) contributions in particular, the contributions from (iv1) the flexural (2+3) and distortional (4+5+6) modes, both exhibiting a “more or less” perfect half-wave, and (iv2) the shear modes. However, as expected, the five (equal) half-wave contribution of the local w modes also provides the major source of the column deformation. Moreover, the comparison between Figs. 6(i) and 7(c) (and also Figs. 4(b)+(c)) shows that the local half-waves with outward curvature exhibit a stiffer response, when
compared with the “inward local half-waves”, i.e., there is a mild asymmetry with respect to the local initial geometrical imperfection “sign”. The longitudinal profiles depicted in Fig. 6 show that this asymmetry is related to the fact that the flexural and distortional modal deformation contributions always exhibit “inward” curvature therefore, they either reinforce the “inward local half-waves” or oppose the “outward local half-waves”.
(v) The column deformed configurations depicted in Figs. 8(a)-(c2) provide visual confirmation of the local (post-buckling) behaviour features unveiled in all the columns analysed.
(vi) The comparison between the stress resultant-based participation factors shown in Figs. 9(a)-(c) reveals similar qualitative trends: the longitudinal membrane stress resultant (Nxx) is always dominant along the equilibrium path with a weight of 90% until P/PcrL=0.50. For P/PcrL>0.50, its (relative) participation gradually decreases until P/PcrL=1.50. For instance, for the n=4 column: pNxx65%, pNyy2%, pNxy5%, pMxx10%, pMyy9% and pMxy10%.
(vii) All the elastic local post-buckling equilibrium paths obtained make it possible to conclude that, as expected, RCPS columns are able to withstand applied loads much higher than the critical buckling value. Moreover, it is also logical to expect that the provisions for the design against column local failures currently included in design specifications, namely the effective width and direct strength design approaches, should also provide safe, accurate and reliable local failure load estimates for RCPS columns.
P/P
0.00 0.25 0.50 1.00 1.50 0
20 40 60 80 100
0.75 1.25 Nxx
Nxy
Mxx
Myy
Mxy
Nyy
n=4 pk(%)
P/P
0.00 0.25 0.50 1.00 1.50 0
20 40 60 80 100 pk(%)
0.75 1.25 Nxx
Nxy
Mxx
Myy
Mxy
Nyy
n=5+Mode 2
P/P
0.00 0.25 0.50 1.00 1.50 0
20 40 60 80 100 pk(%)
0.75 1.25 Nxx
Nxy
Mxx
Myy
Mxy
Nyy
n=7+Mode 1
(a) (b) (c)
Figure 9: Stress resultant-based participation factors of columns with 0.1mm amplitude local critical-mode initial geometrical imperfections and (a) n=4, (b) n=5 + mode 2 and (c) n=7 + mode 1.
3.2 Distortional
equilibrium paths, where w is the mid-span bottom wall transverse displacement caused by the applied load P and w0 is the corresponding initial value (see the deformed configurations depicted in Figs. 10(a)-(b)), obtained for columns containing initial imperfections with the shapes of each duplicate critical buckling mode and four amplitudes, namely: 0.5, 0.2, 0.1 and 0.01mm (normalised with respect to the maximum in-plane local displacement w (flexural) or v (membrane). It is worth noting that the initial imperfection shape was obtained employing a GBT nodal discretisation with 2 intermediate nodes (yielding 132 deformation modes) and 20 equally spaced finite elements with an incremental arc-length control strategy. Since a perfect match was obtained between the ABAQUS
SFEA and GBT results, the former are omitted from Fig. 10 (for clarity purposes). The observation of the post-buckling results presented in Fig. 10 leads to the following remarks:
(i) All equilibrium paths exhibit a slight negative concavity in the close vicinity of the bifurcation load level, which is typically associated with unstable bifurcations. Therefore, it is just logical to expect a moderate (critical-mode) imperfection sensitivity of the column peak/maximum load Pmax. Indeed, the Pmax/Pcr ratio equals (i1) 0.8672, 0.9370, 0.9684, 1.0108 (imperfection 1) and (i2) 0.8512, 0.9210, 0.9525, 0.9950 (imperfection 2), for imperfection amplitudes of 0.5, 0.2, 0.1, 0.01mm, respectively. As the imperfection amplitude increase, the peak load decreases and occurs for larger displacements. In addition, note that the peak loads associated with the two initial imperfection shapes (1 and 2) virtually coincide.
(ii) The post-buckling equilibrium paths of the n=11 column are very surprising, since they do not exhibit post-critical strength, unlike in the case of (lipped) open-section members (e.g., [19,20]), which always exhibit moderate-to-high distortional post-buckling strengths. Therefore, it may be argued that the post-buckling behaviours of the two column types merely share the designation
“distortional”, while the underlying mechanics are quite different.
The distortional post-buckling mechanics (and also those involved in local-distortional interaction
see Section 3.3) are quite complex, despite the fact that the results shown in Fig. 10 are fairly easy to obtain (either through GBT or SFEA). In order to illustrate this complexity, consider the n=11 column with a 0.02 mm amplitude imperfection 1. Fig. 11(a) shows several P/PcrD vs. (w+w0)/t equilibrium paths obtained either with GBT (thick lines) or with ABAQUS SFEA (dashed lines) – note that the GBT curve depicted in Fig. 11(a), which is represented until (w+w0)/t=2.5, is identical to that shown in Fig. 10(a). Fig. 11(b) shows the stress resultant-based strain energy participation factors and the strain energy associated to each stress resultant along the GBT “trivial” equilibrium path shown in Fig.11(a).Ontheotherhand,Figs.12(a)-(i) and 13(a)-(i) provide the evolution of the most relevant
(w+w0)/t
-0.5 -1.5
0.25
0.00
-2.5 0.0
0.50 0.75 1.25
1.00
Imperfection 1
-1.0 -2.0
w
0.5 1.0 1.5 2.0
w
Imperfection 2
0.25 0.50 0.75 1.25
1.00 P /PcrD
(w+w0)/t
0.00
amplitude
0.01 0.1 0.2 0.5
amplitude
0.01 0.1 0.2 0.5
(a) (b)
(w+w0)/t
4.0 1.0
0.25
0.00
0.0 5.0
0.50 1.00 1.25
2.0 0.75
P /PcrD 0.2mm+imp.1
bifurcation point non-trivial 3.0 trivial GBT SFEA w SFEA-1 SFEA-3 SFEA-2
P/P
0.0 0.8
0 20 40 60 80 100
0.4 0.8
Nyy 100 200 300 400 500 Nxx pk (%) trivial path 0.6 0.2 0.2mm+imp.1 U
(kNcm)
Nxx Nyy Nxy Mxx Myy Mxy 0.6 limit point Nxy Mxx Myy Mxy
(a) (b)
Figure 11: n=11 column (a) post-buckling equilibrium paths concerning imperfection 1 with a 0.2mm amplitude and (b) stress resultant-based participation factors.
x /L 0.00
0.00 0.25 0.50 0.75 1.00
W2/t
0.10
0.35
0.15 P 0.876/PcrD ↓ 0.831↓ 0.785↓ 0.751↓ 0.726↓ 0.707↓ 0.25 w2 0.05 0.20 0.30
P/PcrD
0.490 0.852 0.906 0.923 0.924↓ 0.916↓ x /L
0.00
0.0 0.25 0.50 0.75 1.00
3.0 1.5
2.5 0.5
w4/t w4
1.0
2.0
P/PcrD
0.903↓ 0.894↓ 0.876↓
P /PcrD=0.751↓
x /L 0.00
0.00 0.25 0.50 0.75 1.00
0.10 0.08 0.04 0.02
P/PcrD
0.297 0.693 0.707↓ 0.893 0.831↓ 0.925
w5/t w5
0.06
P/PcrD
0.921↓ 0.910↓ 0.886↓
(a) (b) (c)
x /L 0.00
-0.1 0.25 0.50 0.75 1.00
w6/t
0.4 0.1
P /PcrD
0.876↓ 0.831↓ 0.785↓ 0.751↓ 0.726↓ 0.707↓ w6 0.3 0.2 0.0
x /L 0.00
-0.02 0.25 0.50 0.75 1.00
0.10 0.06 0.02 w8 0.08 0.04 0.00
w8/t P/PcrD
0.751 0.906 0.923 0.924↓ 0.916↓ 0.906↓ 0.886↓
P /PcrD=0.831↓ P /PcrD=0.707↓
x /L 0.00
-0.3 0.25 0.50 0.75 1.00
-0.2
0.3 0.2 0.0
P /PcrD
0.924 0.894↓ 0.886↓ 0.876↓ 0.831↓ 0.707↓
w35-56/t w35-56
-0.1
0.1 P /PcrD=0.606
(d) (e) (f)
P /PcrD
0.751 0.893 0.923 0.924↓ 0.916↓ 0.904↓ 0.894↓ 0.876↓ x /L
0.00
0.0 0.25 0.50 0.75 1.00
w57-66/t
0.6 0.3 0.2 w57-66 0.5 0.1 0.4
P /PcrD
0.831↓ 0.751↓ 0.707↓
P /PcrD
0.921↓ 0.901↓ 0.866↓ 0.876↓ 0.831↓ 0.751↓ 0.707↓
x /L 0.00
-0.2 0.25 0.50 0.75 1.00
w89-99/t
1.0 0.2 w89-99 0.6 0.4 0.0 0.8
P /PcrD
0.893 0.923 0.248
x /L 0.00
0.0 0.25 0.50 0.75 1.00
w/t 5.0 2.0 w 4.0 1.0 3.0
P/PcrD
0.751 0.893 0.923 0.924↓ 0.916↓ 0.904↓ 0.894↓ 0.876↓
P /PcrD
0.831↓ 0.751↓ 0.707↓
(g) (h) (i)
x /L 0.00
0.0
0.25 0.50 0.75 1.00
W2/t
0.2
0.8 0.4
P /PcrD
0.845↓ 0.792↓ 0.688↓ 0.639↓ 0.615↓ 0.597↓ 0.6 w2
P /PcrD
0.792↓ 0.688↓ 0.639↓ 0.615↓ 0.597↓ x /L
0.00 0.0
0.25 0.50 0.75 1.00
4.0 2.0
3.0 1.0
w4/t w4
x /L 0.00
0.00
0.25 0.50 0.75 1.00
0.04 0.03 0.02 0.01
P /PcrD
0.659↓ 0.597↓ 0.730↓ 0.845↓
w5/t w5
(a) (b) (c)
x /L 0.00
-0.1 0.25 0.50 0.75 1.00
w6/t
0.5
0.1 P /PcrD
0.845↓ 0.792↓ 0.688↓ 0.639↓ 0.597↓ 0.3 w6 0.4 0.2 0.0
x /L 0.00
-0.04 0.25 0.50 0.75 1.00
0.10 0.06 0.00 w8 0.08 0.02 -0.02
w8/t
0.04 P /P
crD 0.688↓ 0.639↓ 0.615↓ 0.597↓
P /PcrD=0.845↓ P /PcrD=0.792↓
x /L 0.00
-0.4 0.25 0.50 0.75 1.00
-0.2
0.4 0.2 0.0
P /PcrD
0.792↓ 0.688↓ 0.639↓ 0.597↓
w35-56/t w35-56
(d) (e) (f)
P /PcrD
0.792↓ 0.688↓ 0.639↓ 0.615↓ 0.597↓
x /L 0.00
0.0 0.25 0.50 0.75 1.00
w57-66/t
1.0 0.6 0.4 w57-66 0.8 0.2
P /PcrD
0.792↓ 0.688↓ 0.639↓ 0.615↓ 0.597↓
x /L 0.00
-0.25 0.25 0.50 0.75 1.00
w89-99/t
1.50 0.75 0.25 w89-99 1.00 0.50 0.00 1.25
x /L 0.00
0.0 0.25 0.50 0.75 1.00
w/t 4.0 2.0 w 3.0 1.0
P /PcrD
0.792↓ 0.688↓ 0.639↓ 0.615↓ 0.597↓
(g) (h) (i)
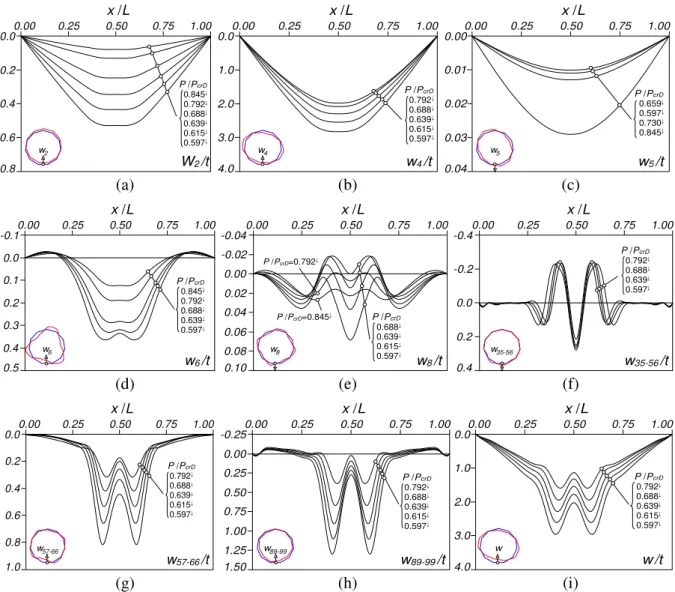
Figure 13: n=11+2=25 column mid-bottom wall transverse displacement profiles: (a) w2(x), (b) w4(x), (c) w5(x),(d) w6(x),(e)w8(x),(f)w35-56(x),(g) w57-66(x),(h) w89-99(x),(i) w1-132(x)w(x) non-trivialequilibrium path.
(a1) (a2) (a3)
(b1) (b2) (b3)
Figure 14: GBT deformed configurations of the n=11+2=25 columns, containing 0.2mm amplitude distortional critical-mode initial imperfections, at the post-buckling stages defined by (w+w0)/t equal to (1) 3.0,
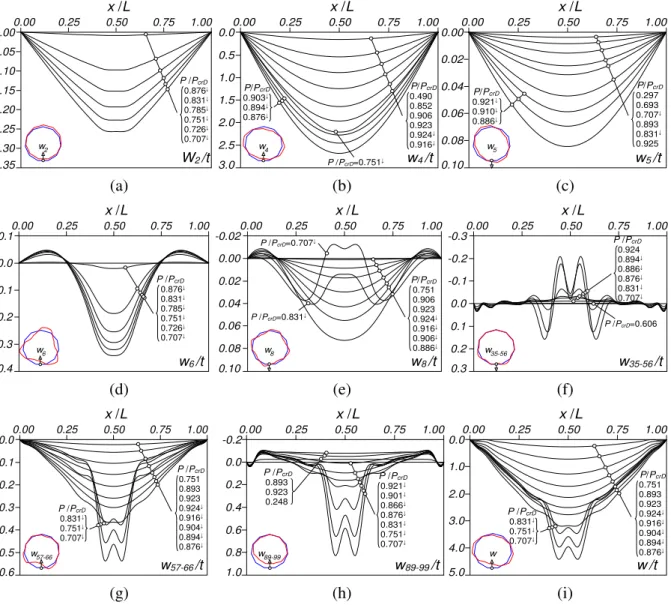
mid-bottom wall transverse displacement profiles (w(x)) along the two GBT equilibrium paths shown in Fig. 11(a), namely the contribution from mode(s) (i) 2 (w2(x) – major-axis flexure), (ii) 4, 5, 6 and 8 (w4(x), w5(x), w6(x), w8(x) – distortional), (iii) 35-56 (w35-56(x) – local w modes), (iv) 57-66 (w57-66(x) – shear modes), (v) 89-99 (w89-99(x) – linear transverse extension modes), and (vi) all the modes (total displacement w(x)w1-132(x)) –Figs. 12 and 13 concern the “trivial” and “non-trivial” equilibrium paths, respectively (as discussed below). Note that the symbol (↓), appearing in Figs. 12(a)-(i) and 13(a)-(i), identifies an equilibrium state located in the equilibrium path descending branch (i.e., after the limit point has been reached). As for Figs. 14(a1)-(b3), they display several GBT-based column deformed configurations concerning equilibrium points defined by (w+w0)/t values approximately equal to (i) 3.0 (Figs. 14(1)), (ii) 4.0 (Figs. 14(2)) and (iii) 5.0 (Figs. 14(3)) – once again, Figs. 14(a) and 14(b) concern the “trivial” and “non-trivial” equilibrium paths, respectively. The observation of all the above post-buckling results prompts the following comments/remarks: (i) The “trivial” equilibrium paths “GBT” and “SFEA-1” (the latter obtained with a maximum
arc-length value of 0.1) practically coincide up to (w+w0)/t=5.0. However, if other maximum arc-length values are adopted in the ABAQUS SFEA, one is led to different equilibrium paths for (w+w0)/t >3.0, which means that there are multiple equilibrium states/trajectories in the vicinity of (w+w0)/t 3.0 this multiplicity suggests the possible presence of a bifurcation point.
Indeed, the “SFEA-2” and “SFEA-3” equilibrium paths depicted in Fig. 11(a) were obtained adopting maximum arc-length values equal to 0.03 and 0.025, respectively (to the authors’ best knowledge, there are no branch switching techniques available on ABAQUS). An eigenvalue analysis of the SFEA tangent stiffness matrix, along the fundamental/“trivial” equilibrium path reveals several negative eigenvalues near the supposed bifurcation point. However, the GBT tangent stiffness matrix only has two negative eigenvalues at that same point (one of them associated with the limit point preceding the descending equilibrium path branch), which means that there is only one “non-trivial” solution, unlike in the case of the (highly) refined ABAQUS
SFEA3. Note that this discrepancy stems exclusively from the discretization (longitudinal and cross-sectional) adopted, since it was found that it is indispensable to employ highly refined discretisations in either the GBT and SFE analysis. Another attempt to reduce/eliminate the differences between the two types of analysis consisted of adopting three intermediate nodes per wall (instead of two) in the GBT discretization, leading to 176 deformation modes however, this attempt also did not succeed, even if the differences became smaller. Since the non-linear GBT formulation implemented cannot compete with the SFEA, as far as computation efficiency is concerned (see the discussion in [21]), it was not possible to carry out more refined GBT analyses. However, it should be noted that measures are currently being undertaken to overcome this limitation, thus making it possible to perform GBT analyses that can be more closely comparable with their SFE counterparts.
(ii) The GBT-based “non-trivial” equilibrium path shown in Fig. 11(a) was obtained through an
eigenvalue injection into the solution, a procedure described by Borst et al. [22]: the trivial
solution (x) is replaced by x*=x-(xTx)v
1/(v1Tx), where v1 is the eigenvector associated with the newly detected negative eigenvalue. In other words, the non-trivial solution x* is searched in a direction orthogonal to the trivial solution. Nevertheless, it should be noted that, although no “exact” SFEA match was found for the GBT-based equilibrium path, the SFEA-2 and SFEA-3 equilibrium paths are already quite close.
(iii) As expected, the w(x) configuration (Fig. 12(i)) exhibits a single half-wave up to the bifurcation point vicinity, i.e., P/PcrD0.894↓ (see also the deformed configuration in Fig. 14(a1)), mostly due to the contributions from mode 4 (Fig. 12(b)) and the shear modes (Fig. 12(g)), plus a tiny contribution from mode 5 (Fig. 12(c)) all these deformation modes exhibit a single half-wave.
However, local buckles begin to emerge in the column central region, resembling those caused by the so-called Brazier effect in circular tubes under bending [23]. In fact, the difference between the “trivial” (Fig. 12) and “non-trivial” (Fig. 13) GBT solutions concerns solely the distinct deformation patterns localised in the column central region, which stem from the contributions of the local modes (Figs. 12(f) and 13(f)) and, mostly, the shear modes (Figs. 12(g) and 13(g) and transverse extension modes (Figs. 12(h) and 13(h). Both alternative equilibrium paths are associated with the development of three local buckles at the bottom wall, even if these buckles are considerably more pronounced in the non-trivial solution – just compare the deformed configurations in Figs. 14(a1)-(a3) and 14(b1)-(b3).
(iv) It is worth noting that the ABAQUS SFEA equilibrium paths are also associated with the development of local buckles, either in one wall (like in the GBT analysis) or in opposite walls (unlike in the GBT analysis e.g., the SFEA-3 equilibrium path). Since columns buckling in distortional modes invariably exhibit quite large wall numbers (recall Fig. 2(c)), several alternative solutions exist, rendering the post-buckling behaviour (and analysis) very complex. This complexity increases with the number of walls, particularly when it becomes very high, which means that the RPCS member approaches a hollow circular tube. This fact implies that very refined numerical models are indispensable to determine all possible solutions. (v) Fig. 11(b) shows that, once again, the participation of the strain energy associated with the
longitudinal membrane stress resultant (Nxx) is always dominant along the equilibrium path, as was also observe in the column local post-buckling behaviour (see Section 3.1). However, the main difference occurs after the limit point: the participation of Nxx reduces significantly and is
“replaced” by contributions from other stress resultants (in particular, the contribution of Myy increases significantly) – at P/PcrD=0.639↓, the participation of Nxx has already been halved.
3.3 Local-distortional interaction
The column analysed in this section exhibits a critical distortional-to-local buckling load ratio close to one, i.e., associated with a location in the vicinity of the boundary between local and distortional buckling in Fig. 2(c) its geometry is characterised by n=10 and 2=27 (see Table 1).
Rigorously speaking, this column is located “to the local side” of that boundary, which means that
the local buckling load is the critical one in this particular case, it is associated with a single (recall that n is even) local buckling mode exhibiting 12 equal-spaced half-waves. Naturally, the post-bucklingbehaviourofsuchcolumnisexpectedtobestrongly affected by local-distortional interaction. The columns analysed contain initial geometrical imperfections with the shape of the above critical local buckling mode and four distinct amplitudes, namely: 0.5, 0.2, 0.1 and 0.01mm (the same values considered in Section 3.2) these amplitudes are defined by the maximum flexural displacement. Figs. 15(a)-(d) show the corresponding column equilibrium paths P/PcrL vs. (w+w0)/t, where w is the flexural displacement at the mid-bottom wall caused by the applied load P and w0 its initial value cross-section deformed configurations at advanced post-buckling stages, located at x/L0.462, are also depicted in these figures. As for Figs. 16(a)-(c), they provide the evolution of the most relevant modal contributions to the mid-bottom wall transverse displacement profile associated with the
“trivial” equilibrium path displayed in Fig. 15(c), namely the contributions from the (i) local w modes (w32-51(x)), (ii) linear transverse extension modes (w81-90(x)), and (iii) all the modes (w1-120(x)w(x)). Similarly, Figs. 17(a)-(h) and Figs. 18(a)-(h) shows the same type of results concerning the “ non-trivial 1” and “non-trivial 2” equilibrium paths shown in Fig. 15(c), respectively in this case, more contributions to the mid-bottom wall transverse displacement profile are depicted, namely those from the (i) minor-axis flexural mode 3 (w3(x)4), (ii) the distortional modes 4 (w4(x)), 5 (w5(x))5,
(w+w0)/t 2.0 0.0 -2.0 25 00
-4.0 4.0
75 25 0 50 0 00 75
P /PcrL
0.5mm
bifurcation point
non trivial 1
non trivial 2 (x2)
(w+w0)/t
3.0 1.0
0.20
0.00
0.0 4.0
0.60 1.00 1.40 0.40 2.0 0.80 1.20
P /PcrL 0.2mm
bifurcation point
non trivial (x2)
(a) (b)
(w+w0)/t
2.0 0.0
-2.0 25
00
-4.0 4.0
75 25 0 50 0 00 75
P /PcrL
0.1mm
bifurcation point
non trivial 1
non trivial 2
A C B A C B C A B (x2)
(w+w0)/t
2.0 -2.0
0.20
0.00
-4.0 4.0
0.60 1.00 1.40 0.40 0.0 0.80 1.20
P /PcrL 0.01mm
bifurcation point
non trivial 1
non trivial 2 (x2)
(c) (d)
Figure 15: n=10+2=27 column trivial and non-trivial post-buckling equilibrium paths associate with local initial geometrical imperfections with amplitudes (a) 0.5mm, (b) 0.2mm, (c) 0.1mm, (d) 0.01mm.
P /PcrL
0.638 0.849
x /L 0.00
-3.0
0.25 0.50 0.75 1.00
w32-51/t
-2.0
3.0 2.0 0.0
P /PcrL
0.942 1.054 1.260 1.464 -2.0 1.0 w32-51
P /PcrL
0.638 0.849 0.942 1.054 1.260 1.464
x /L 0.00
-0.2
0.25 0.50 0.75 1.00
w81-90/t
1.0 0.6 0.2 w81-90 0.8 0.4 0.0
x /L 0.00
-3.0
0.25 0.50 0.75 1.00
w/t -2.0 3.0 1.0 0.0 w 2.0 -1.0
P /PcrL
0.638 0.849
P /PcrL
0.942 1.054 1.260 1.464
(a) (b) (c)
Figure 16: n=10+2=27 column mid-bottom wall transverse displacement profiles (a) w32-51(x), (b) w81-90(x), (c) w1-120(x)w(x) trivial equilibrium path.
7 (w7(x)) and 8 (w8(x)), (iii) the local w modes 32-51 (w32-51(x)), (iv) the shear modes 52-60 (w52-60(x)), (v) the linear transverse extension modes 81-90 (w81-90(x)) and (vi) all the modes (w1-120(x)w(x)). Then, Figs. 19(a1)-(c3) show GBT deformed configurations concerning equilibrium states located on the three equilibrium paths of the 0.1 mm amplitude column (see Fig. 15(c)) three states per
x /L 0.00
-0.08
0.25 0.50 0.75 1.00
w3/t
-0.04
0.08 0.00
P /PcrL
0.877↓ 0.846↓ 0.809↓ 0.593↓ 0.414↓ 0.381↓ 0.04 w3
P /PcrL
0.944↓ 0.942↓ 0.933↓ 0.918↓ 0.894↓ 0.593↓ 0.414↓
x /L 0.00
0.0
0.25 0.50 0.75 1.00
5.0 3.0 2.0
4.0 1.0
w4/t w4
x /L 0.00
-0.8
0.25 0.50 0.75 1.00
0.8 0.4 0.0 -0.4
P /PcrL
0.894↓ 0.809↓ 0.593↓ 0.414↓ 0.381↓
w7/t w7
(a) (b) (c)
x /L 0.00
-0.08 0.25 0.50 0.75 1.00
w8/t
0.08 0.00
P /PcrL
0.942↓ 0.933↓ 0.918↓ 0.908↓ 0.894↓ 0.04 w8
P /PcrL=0.593↓ P /PcrL=0.414↓
P /PcrL=0.809↓
x /L 0.00
-0.75 0.25 0.50 0.75 1.00
w32-51/t
0.75 0.25 -0.25 w32-51 0.50 0.00
-0.50 P /PcrL=0.937↓ P /PcrL=0.918↓ P /PcrL=0.944↓
P /PcrL=0.809↓ P /PcrL=0.593↓
P /PcrL=0.414↓
x /L 0.00
-0.25 0.25 0.50 0.75 1.00
0.00
1.25 0.75 0.50
1.00
0.25 P /PcrL
0.944↓ 0.933↓ 0.918↓ 0.894↓ 0.809↓ 0.593↓ 0.414↓ w 52-60/t w52-60
(d) (e) (f)
P /PcrL
0.942↓ 0.933↓ 0.918↓ 0.908↓ 0.894↓ 0.809↓ 0.593↓ 0.414↓
x /L 0.00
-0.25 0.25 0.50 0.75 1.00
w81-90/t
1.25 0.75 0.25 w81-90 1.00 0.50 0.00
x /L 0.00
-1.0 0.25 0.50 0.75 1.00
w/t 0.0 5.0 3.0 2.0 w 4.0 1.0
P /PcrL
0.944↓ 0.942↓ 0.937↓ 0.918↓ 0.894↓ 0.809↓
P /PcrL=0.593↓
P /PcrL=0.414↓
(g) (h)
Figure 17:n=10+2=27column mid-bottomwalltransversedisplacement profiles (a) w3(x), (b) w4(x), (c) w7(x), (d) w8(x), (e) w32-51(x), (f) w52-60(x), (g) w81-90(x), (h) w1-120(x)w(x) “non-trivial 1” equilibrium path.
(i) Figs. 15(a)-(d) show that, in all the columns analysed (same geometry and distinct initial imperfection amplitudes), there is one equilibrium path exhibiting a high post-critical strength. Moreover, the close observation of the associated longitudinal displacement profiles displayed in Figs. 16(a)-(c), together with the deformed configurations depicted in Figs. 19(a1)-(a3), readily shows that such high-strength equilibrium paths correspond to a typical local post-buckling behaviour. Indeed, there is a strong resemblance between the displacement profiles shown in Figs. 16(a)-(c) and those presented previously and concerning the n=4 columns (see Figs.5(a)-(c))naturally,thenumbersoflocalhalf-wavesaredifferent.In particular, practically no distortional deformations occur (virtually null distortional deformation mode participations). (ii) After determining the tangent stiffness matrix eigenvalues it was found that either one (Fig.
x /L
0.00 0.25 0.50 0.75 1.00
w4/t P /PcrL
0.944↓ 0.944↓ 0.943↓ 0.939↓ 0.932↓ 0.922↓ w4
P /PcrL
0.734↓ 0.599↓ 0.0 1.0 2.0 3.0 4.0
P/PcrL
0.936↓ 0.944↓ 0.941↓ 0.943↓ 0.944↓ x /L
0.00 -0.5
0.25 0.50 0.75 1.00
1.5 0.5
1.0 0.0
w5/t w5
P /PcrL=0.879↓
x10-2
x /L 0.00
-5.0
0.25 0.50 0.75 1.00
5.0 2.5 0.0 -2.5
w7/t w7
x10-2
P /PcrL=0.815↓
P /PcrL=0.734↓
P /PcrL=0.909↓ P /PcrL=0.932↓ P /PcrL=0.662↓ P /PcrL=0.599↓
P /PcrL=0.943↓
(a) (b) (c)
x /L 0.00
-0.06 0.25 0.50 0.75 1.00
w8/t
0.06 -0.02
P /PcrL
0.922↓ 0.932↓ 0.939↓ 0.943↓ 0.02 w8
P /PcrL=0.734↓ P /PcrL=0.815↓ P /PcrL=0.909↓
0.04 0.00 -0.04
P /PcrL=0.599↓ P /PcrL=0.662↓
x /L 0.00
-0.8 0.25 0.50 0.75 1.00
w32-51/t
0.8 0.2 -0.4 w32-51 0.6 0.0 -0.6
P /PcrL=0.909↓
0.4 -0.2
P /PcrL=0.944↓ P /PcrL=0.815↓ P /PcrL=0.599
↓
P /PcrL=0.734↓
x /L 0.00
0.00 0.25 0.50 0.75 1.00
0.20
0.80 0.60 0.40
P /PcrL
0.943↓ 0.939↓ 0.932↓ 0.922↓ 0.909↓ 0.815↓ 0.662↓ 0.599↓
w52-60/t w52-60
(d) (e) (f)
P /PcrL
0.944↓ 0.939↓ 0.922↓ 0.909↓ 0.815↓ 0.734↓ 0.662↓ 0.599↓
x /L 0.00
-0.2 0.25 0.50 0.75 1.00
w81-90/t
1.2 0.8 0.2 w81-90 1.0 0.6 0.0 0.4
x /L 0.00
-1.0 0.25 0.50 0.75 1.00
w/t 0.0 6.0 4.0 3.0 w 5.0 1.0
P /PcrL
0.944↓ 0.943↓ 0.939↓ 0.932↓ 0.909↓ 0.734↓
P /PcrL=0.599↓
2.0
(g) (h)
Figure 18: n=10+2=27columnmid-bottomwalltransversedisplacement profiles (a) w4(x), (b) w5(x), (c) w7(x), (d) w8(x), (e) w32-51(x), (f) w52-60(x), (g) w81-90(x) and (c) w1-120(x)w(x) “non-trivial 2” equilibrium path.
(iii) The analysis of the “non-trivial 1” and “non-trivial 2” equilibrium paths, whose displacement profiles are displayed in Figs. 17(a)-(h) and 18(a)-(h), respectively, shows that, as expected, these columns undergo L-D interaction – the deformed configurations shown in Figs. 19(b1)-(c3) confirm and reinforce this assertion. Indeed, distortional deformations develop immediately after the “bifurcation point”, particularly those associated with mode 4 (see Figs. 17(b) and 18(a)). They exhibit a single half-wave, akin to the critical distortional buckling mode, and retain this shape along the whole equilibrium path, which constitutes a very clear sign of the occurrence of coupling between local and distortional buckling recall that local deformations also take place along those equilibrium paths. Progressing along the equilibrium paths, the distortional deformations gradually increase and eventually become the major source of the column deformations – compare Figs. 17(b) and 17(h) or Figs. 18(a) and 18(h). It is still worth mentioning that mode 4 has opposite contributions in the two non-trivial equilibrium paths, which also occurs for the columns with 0.5mm (Fig. 15(a)) and 0.01mm (Fig. 15(d)) initial imperfections. On the other hand, the distortional deformations of the column with a 0.2mm initial imperfection (Fig. 15(b)) combine major contributions from modes 4 and 5. (iv) The non-trivial equilibrium paths are the most relevant, since they exhibit significant strength
(a1) (a2) (a3)
(b1) (b2) (b3)
(c1) (c2) (c3)
Figure 19: GBT deformed configurations of n=10+2=24 columns with 0.1mm amplitude local imperfections at(a) P/PcrL equalto (1) 0.958(bifurcation point), (2) 1.50 and (3) 1.40 (trivial path), (b) (w+w0)/t equal to (1) 2.0,
(2) 3.1 and (3) 4.0 (non-trivial 1 path), and (c) (w+w0)/t equal to (1) 2.0, (2) 3.0 and (3) 4.0 (non-trivial 2 path).
(v) Turning the attention to the local w mode longitudinal displacement profiles concerning the non-trivial 1 equilibrium path (Fig. 17(e)), it can be readily concluded that (v1) the amplitude decreases along the equilibrium path and (v2) the half-wave close to mid-span (x/L0.46), initially exhibiting outward motions (“opposing” those from distortional mode 4), change gradually to inward motions along the equilibrium path (reinforcing w4(x/L0.46) e.g., see the displacement profile at P/PcrL=0.593↓ in Fig. 17(e)). Therefore, since the local half-wave number is even, this behavioural feature leads to a longitudinal profile asymmetry –naturally, for odd local half-wave numbers all longitudinal profiles remain symmetric along the whole equilibrium path. Moreover, the longitudinal profiles w52-60(x) (Fig. 17(f)) and w81-90(x) (Fig. 17(g)) also exhibit this behavioural feature, very clearly visible in w(x) (Fig. 17(h)). On the other hand, the w32-51(x) longitudinal profile shape concerning the non-trivial 2 equilibrium path (Fig. 18(e)) changes gradually to exhibit, at advanced post-buckling stages, the central half-wave (x/L0.50) with outward motions and the two adjacent half-waves with inward motions (like w4(x)). Note that this behavioural feature may cease to occur when the local half-wave number is smaller, since the central half-wave nature is more important in relative terms. Naturally, the displacement profile w(x) tends to exhibit a symmetric configuration at the advanced loading stages, unlike in the previous case (e.g., see Fig. 18(h) at P/PcrL=0.599↓). (vi) A direct consequence of the content of the previous item (local displacement profiles) is that
columns (e.g., [14]). Then, it is just natural to expect the behaviour of the (true) L-D interaction to be governed by the distortional deformations. Indeed, there is a strong resemblance between the behaviours of the columns analysed in Section 3.2, undergoing a “pure” distortional post -buckling behaviour, and those analysed in this section, experiencing true L-D interaction. (vii) Once again, the one (non-trivial 1 equilibrium path) or three (non-trivial 2 equilibrium path)
“local buckles” occurring in the mid-span region stem from the contributions of the shear (52-60) and (mostly) linear transverse extension modes (81-90).
(viii) All the results presented in this section were obtained for columns containing local critical-mode initial geometrical imperfections, since the main purpose of the work to provide evidence of the occurrence of L-D interaction. If a distortional initial imperfection was considered, it would be quite difficult (if possible) to distinguish between the distortional deformations stemming from the initial imperfection and from the L-D interaction effects. Naturally, after establishingthatthiscolumn experiencesL-D interaction (with a local initial imperfection) other initial imperfection shapes can be considered, namely the distortional critical-mode one. If such initial imperfection shape is considered, the trivial equilibrium path, exhibiting a high post-critical strength, no longer can be obtained. Due to space limitations, the corresponding results are not included here they will be reported in the near future.
(ix) Finally, note the resemblance between the strain energy modal participations diagrams shown in (ix1) Figs. 20(a) and 9(a) (Section 3.1 local post-buckling behaviour) and (ix2) Figs. 20(b)+(c) and 11(b) (Section 3.2 distortional post-buckling behaviour).
P/P
0.0 0.2 0.4 1.0 1.4 0
20 40 60 80 100
0.6 1.2
Nxx
Nxy
Mxx
Myy
Mxy
Nyy
pk(%) n=10+2=27
trivial
0.8
P/P 0.9
0 20 40 60 80 100 pk(%)
Nxx
Nxy
Mxx
Myy Mxy
Nyy
n=10+2=27
non-trivial 1
0.8 0.7 0.6 0.5 0.4
P/P 0.9
0 20 40 60 80 100 pk(%)
Nxx
Nxy
Mxx
Myy Mxy
Nyy
n=10+2=27
non-trivial 2
0.8 0.7 0.6
(a) (b) (c)
Figure 20: Stress resultant-based participation factors of n=10+2=27 columns with 0.1mm amplitude local imperfections concerning the (a) trivial, (b) non-trivial 1 and (c) non-trivial 2 equilibrium paths.
4 CONCLUSION
This paper presented and discussed the available Generalised Beam Theory (GBT) results of an ongoing numerical investigation on the elastic local, distortional and interactive (local-distortional) post-buckling behaviours of simply supported thin-walled columns with regular convex polygonal cross-sections (RCPS). After a brief review of the bifurcation behaviour of RCPS columns, several columns geometries were selected to enable assessing the behavioural features characterising the above three post-buckling behaviours. Particular attention was devoted to the influence of the shape and amplitude of the initial geometrical imperfections. Among the various conclusions drawn from this investigation, the following deserve to be highlighted: