Market Timing and Selectivity: evaluating both contributions
towards the performance of Portuguese Equity Funds
Chandni Govan
Project submitted as partial requirement for the conferral of Master in Finance
Supervisor:
Prof. Helena Luísa Matos Soares, ISCTE Business School, Departamento de Finanças
Co-Supervisor
Prof. João Carlos Parente Romacho, Escola Superior de Tecnologia e Gestão de Portalegre, Departamento de Ciências Empresariais, Sociais, e Humanas
Market Timing and Selectivity: evaluating both contributions
towards the performance of Portuguese Equity Funds
Chandni Govan
Project submitted as partial requirement for the conferral of Master in Finance
Supervisor:
Prof. Helena Luísa Matos Soares, ISCTE Business School, Departamento de Finanças
Co-supervisor
Prof. João Carlos Parente Romacho, Escola Superior de Tecnologia e Gestão de Portalegre, Departamento de Ciências Empresariais, Sociais, e Humanas
To my Lovely Parents
ABSTRACT
This study attempts to understand the selectivity and market timing abilities of the Portuguese mutual fund managers. Therefore, the focus of the present investigation will be the evaluation of the performance of 51 Portuguese Equity Funds between January 2001 and December 2010. In order to achieve this, the methodology developed by Merton and Henriksson in 1981 will be used. The Jensen measure (1968) will also be applied in order to compare the results. Additionally, the problem of heteroscedasticity and autocorrelation of the errors will also be addressed, where the following methods will be used: the method of White (1980), the method of Newey-West (1987) and the method of Cochrane-Orcutt (1949).
The results of this study shows that there is neither clever selectivity (security selection) nor skillful market timing abilities evidenced by most of the analyzed Equity Fund managers which is consistent with prior studies realized by Romacho (2004) and Afonso (2010). Other finding is regarding the negative correlation between the both abilities which is more evident in the international group of funds.
Keywords: Evaluation of the performance of Mutual Funds, Selectivity, Market Timing, Portuguese Equity Funds, Mutual Fund Managers
Resumo
O presente estudo pretende analisar as capacidades de selectividade e de market timing dos gestores de fundos de investimento Portugueses. Neste sentido o foco da investigação incide sobre o desempenho de 51 Fundos de Acções Portugueses durante o período de Janeiro de 2001 a Dezembro de 2010. Para tal foi aplicada a metodologia de Henriksson e Merton (1981). Também foi utilizada a medida de Jensen (1968), como forma de comparar os resultados. Adicionalmente, foram considerados os problemas da heteroscedasticidade e da auto-correlação dos erros, sendo que foram aplicados os seguintes métodos: o método de White (1980), o método de Newey-West (1987) e o método de Cochrane-Orcutt (1949).
Os resultados obtidos não evidenciam capacidades significativas de selectividade e de market timing por parte da maior parte dos gestores de fundos de acções analisados. Na verdade estes resultados estão de acordo com conclusões de estudos anteriormente realizados por Romacho (2004) e Afonso (2010). A presente investigação também demonstra a existência de uma correlação negativa entre ambas capacidades, estando esta mais patente nos grupos de fundos internacionais.
Palavras-chave: Avaliação do desempenho de fundos de investimento, Selectividade, Market Timing, Fundos de Acções Portugueses, Gestores de Fundos de Investimento
Acknowledgements
I would like to thank my Grandmother, Parents and my lovely Sisters for their unconditional Love and support throughout my research.
Professors Helena Soares (Supervisor), João Romacho (Co-supervisor), Luís Oliveira and the researcher Osvaldo Afonso were also very important for the realization of the present study, for whom I am very grateful.
I also would like to thank Doctor Sérgio Brito from APFIPP (Associação Portuguesa de Fundos de Investimento, Pensões e Patrimónios), Ulisses Oliveira from Espírito Santo Asset Management, José Monteiro from Millennium BCP Asset Management and Carla Sofia Miranda from BPI Asset Management for the outstanding help in the first part of the research, regarding the Portuguese Equity Funds industry.
Finally, special thanks are due to Professor José Dias Curto, Professor Luís Laureano, Professor Álvaro Rosa, Professor Sofia Ramos and Professor João Pedro Nunes.
Any omissions and errors, inevitably present in this work, are the responsibility of the author.
i
C
ONTENTSChapter 1 - Introduction ... 1
Chapter 2 - The Portuguese Mutual Funds Industry... 4
2.1 Evolution of the assets under management in the Portuguese Mutual Funds... 4
2.2 Evolution of the Performance of the Portuguese Equity Funds ... 9
Chapter 3 - Literature Review ... 10
3.1 Introduction ... 10
3.2 Capital Market Models (1952-1976) ... 10
3.3 Risk-Adjusted Measures ... 11
3.3.1 Limitations regarding traditional measures ... 12
3.4 Arbitrage Pricing Theory ... 13
3.5 Selectivity and Market Timing Methodologies ... 13
Chapter 4 - Methodology ... 17
4.1 Merton (1981) and Merton and Henriksson (1981) ... 17
4.1.1 Parametric Tests ... 18
Chapter 5 - Empirical Study ... 21
5.1 Survivorship Bias ... 23
5.2 Returns of the Investment Funds ... 23
5.3 Market Returns ... 24
5.3.1 Equity Index for the different type of Fund ... 24
5.4 Risk-free Rate Return ... 26
5.5 Descriptive Statistics ... 26
5.6 Diagnostic Tests ... 29
5.7 Empirical Results ... 31
5.7.1 Jensen Equation (1968) ... 32
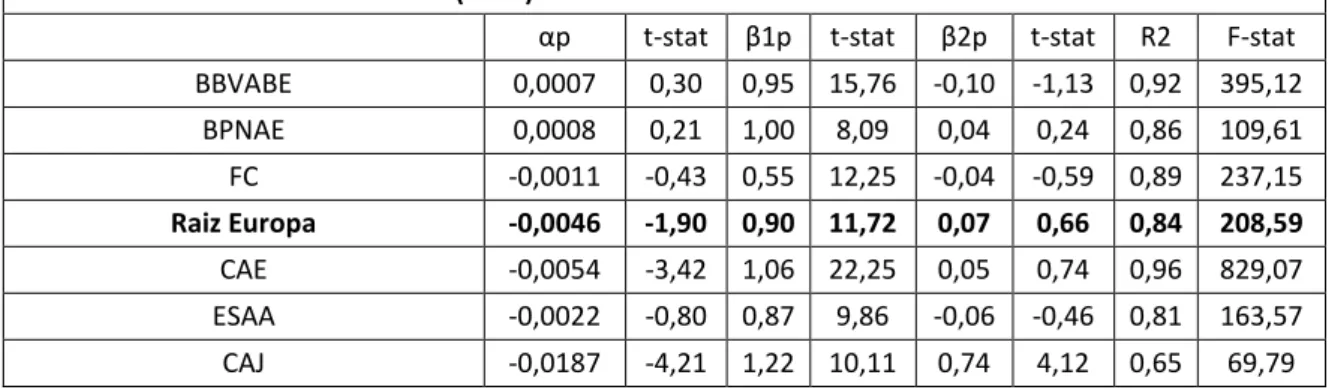
5.7.2 Merton and Henriksson equation (1981) ... 35
5.7.3 Merton and Henriksson equation (1981) – Linear Transformation ... 39
5.7.4 Estimates with correction ... 42
Chapter 6 - Conclusion and suggestions for further research ... 45
References ... 47
ii
T
ABLESTable 1- Equity Funds and their respective management company ... 22
Table 2 - Number of liquidated Equity Funds between January 2001 to December 2010. ... 23
Table 3 - Measures of descriptive statistics of the five groups of funds: ... 28
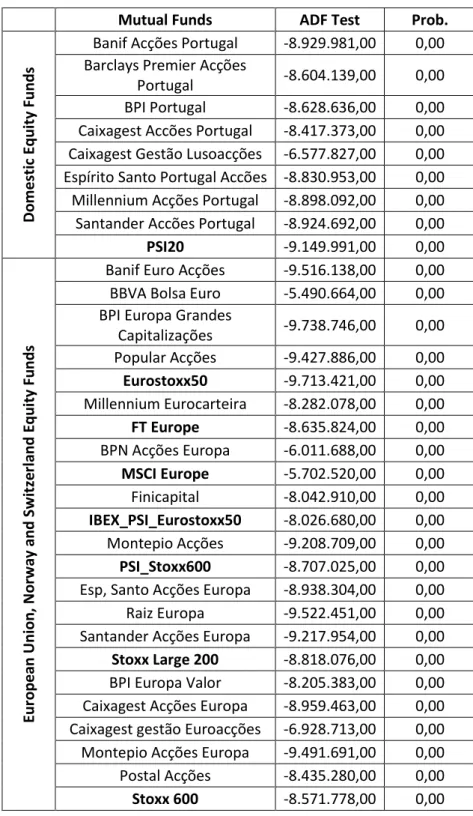
Table 4 - ADF Test for the Equity Funds: Group 1 and 2. ... 29
Table 5 - ADF Test for the Equity Funds: Group 3 to 5. ... 31
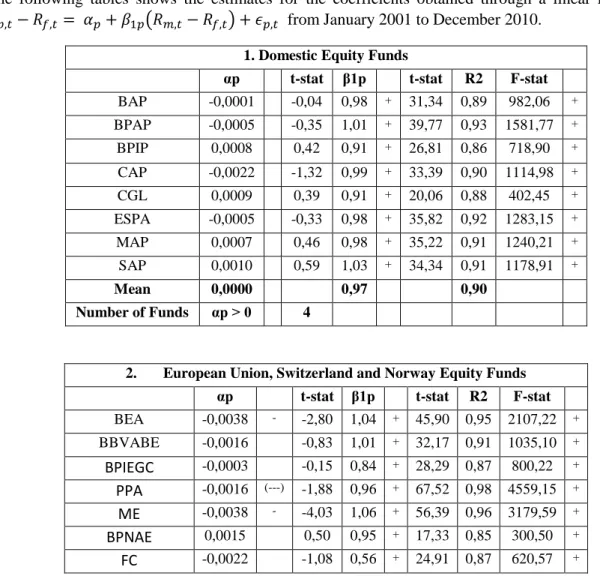
Table 6 - Jensen (1968) measure (Equation 3.1) for the period of January of 2001 to December 2010. ... 33
Table 7 - Henriksson and Merton (1981), (Equation 4.6): parametric tests for the period of January of 2001 to December 2010. ... 37
Table 8 - Resume of the correlation between selectivity and market timing ... 39
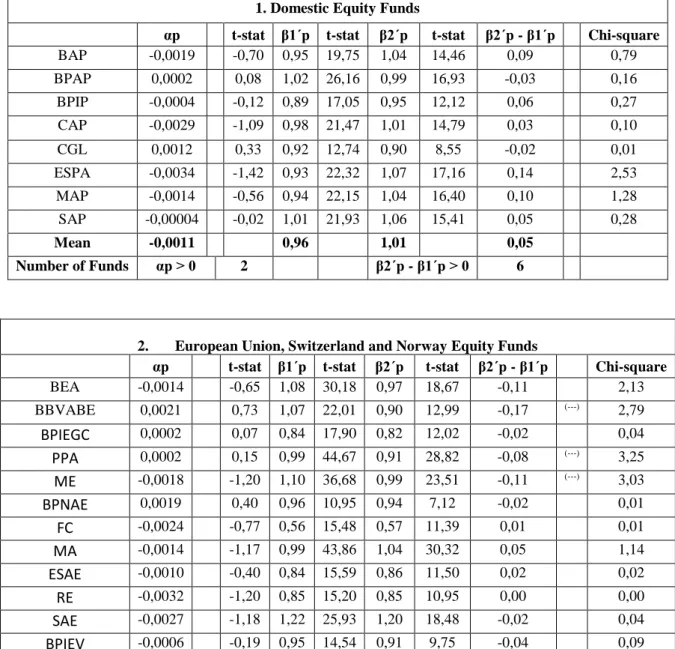
Table 9 - Henriksson and Merton (1981) parametric tests, (equation 4.10), for the period of January of 2001 to December 2010 (alternative regression). ... 40
Table 10 - Parametric Test – Equation 4.6 with correction of the heteroscedasticity - White Heteroscedasticity Test (1980)... 43
Table 11 - Parametric Test - Equation 4.6 with correction of the first order auto-correlation of the errors – Cochrane-Orcutt (1949) Method ... 43
Table 12 - Parametric Test - Equation 4.6 with correction of the heteroscedasticity and the first order auto-correlation of the errors - Newey-West Test ... 44
iii
C
HARTSChart 1 - Investment Funds in Portugal – Assets under management (2001 -2010) ... 5
Chart 2 - Equity Market Performance – Annually Returns (2001- 2010) ... 6
Chart 3 - Central Banks Interest Rates (2001-2010)... 6
Chart 4 - ICE Brent Futures Price (2001-2010) ... 7
iv
ABBREVIATIONS
ADF - Augmented Dickey Fuller
APFIPP - Associação Portuguesa de Fundos de Investimento Pensões e Patrimónios APT - Arbitrage Pricing Theory
CAPM - Capital Asset Pricing Model CML - Capital Market Line
ECB - European Central Bank
EFAMA - European Fund and Asset Management Association EURIBOR - European Interbank Offered Rate
IMF - International Monetary Fund MPT - Modern Portfolio Theory OLS - Ordinary Least Squares PSI 20 - Portuguese Stock Index 20 SML - Security Market Line
1
Chapter 1 - Introduction
The performance of mutual fund investment portfolios has been the subject of extensive examination within the finance literature, due to the high market value attributed to the Mutual Funds at the global level.
In the second quarter of 2010, according to the National Mutual Fund Associations and European Fund and Asset Management Association (EFAMA), the investment funds assets increased by 3.0% worldwide, reaching 17.5 trillion Euros representing more than 68 thousand Mutual Funds. From which, the Equity Funds asset share represents 38.0%, equivalent to about 6.7 trillion Euros. By taking into account Non-Undertakings for Collective Investment in Transferable Securities Directives (non-UCITS), at the end of the second quarter of 2010, the European market share reached 36.3% compared to the 44.4% for the United States of America (USA).
Although the value of the Portuguese Mutual Funds is experiencing a decreasing trend when compared to the real estate funds, in 2010 the Mutual Funds still managed to represent 55.0% of the total investments. Mutual Funds were valued at 14.2 million Euros equivalent to 291 funds.
Performance measurement consists in verifying if the managers have succeeded in reaching their objectives, such as obtaining high return to overcome the risks taken and comparing these results with their peers. It is also important to understand if the manager’s skills are credible to lead to a positive performance or this is just a result of pure luck. The capability to achieve higher returns and of better forecasting would violate the Market Efficient Theory, having far reaching implications for the theory in finance.
According to Sharpe, Alexander and Bailey (1999), the investment process follows the following steps:
1. Definition of the investment policy 2. Analysis of the financial assets 3. Construction of the portfolio 4. Revision of the portfolio 5. Evaluation of the performance
The ability of the managers in terms of selectivity and market timing are taken during the third step, which is to identify the assets in which to invest as well as determining the proportions of the investor´s wealth to put in each one. The focus of this study is related with the fifth step, “Evaluation of the performance”, with regards to the two components of the performance: selectivity and market timing abilities. Although being the last step it is of
2
extreme importance, as it has to be conducted during the whole investment process. Therefore, the main objective of this study is to evaluate both abilities (selectivity and market timing) within the Portuguese Market with regard to 51 Equity Funds.
In Portugal, although we have assisted to a decreasing trend in the amount of assets under management in mutual funds, from January 2001 to December 2010, they still represent more than 50.0% of the total investment funds. Hence, it is important to investigate if it is worth full to invest on this type of financial instrument and also to evaluate the performance of the fund´s managers. Moreover, for academics it is also important to know if there is in fact “skill” behind the management of the equity funds or it is just a matter of “luck”. Being the “skill” the main reason, it would go against the Market Efficient Theory, adversely affecting the equilibrium valuation of securities. Since there is a lack of studies in the last years this investigation will be done between the years 2001 to 2010.
According to the APFIPP (Associação Portuguesa de Fundos de Investimento, Pensões e Patrimónios) classification, the Mutual Funds include Equity Funds, Equity-Saving Funds, Index Equity Funds, Bond Funds, Cash Funds and Other Mutual Funds. This study will focus on Equity Funds which, according to the division made by APFIPP, are divided into 5 groups:
1. Domestic Equity Funds
2. European Union, Switzerland and Norway Equity Funds 3. North American Equity Funds
4. Sector Equity Funds
5. Other International Equity Funds
The methodology used in this study is the parametric tests developed by Merton and Henriksson in 1981. This model has been chosen to its theoretical structure as it allows to separately analyze the two performance components, namely selectivity and market timing, by using market and portfolio excess returns. Additionally, the previous conclusions while using this method, present negative market timing estimates and negative correlation between the two abilities, selectivity and market timing. Hence, it is important to investigate if these conclusions are still verified during January 2001 to December 2010, within the Portuguese Equity Market, or if there are substantial changes in the performance of the Equity Fund´s managers. The Jensen measure (1968) is also used in order to compare the results. For the data analysis, monthly data will be used as the most of the studies applied it and as daily data is found to be very noisy.
The current study is organized as follows:
• Chapter two describes the Portuguese Mutual Funds Industry between 2001 and 2010 period;
3
• Chapter four describes the methodology applied;
• Chapter five analyses the data used in the Empirical study and the respective results along with the variable definitions used; and
4
Chapter 2 - The Portuguese Mutual Funds Industry
The purpose of this chapter is to give a brief summary, for the decade under analysis in this study (January 2001 to December 2010) in terms of the main events in the global economy and Portuguese economy in particular and in the Financial Markets, with special attention to the Domestic Equity Market, as a way to contextualize the results obtained from this research. Moreover, as different economic and market settings influence the attractiveness of the Equity Funds, it is important to review those conjunctures, as they are determinant in offering a specific weight and relative performance in the Equity Funds share within the Total Investment Funds.
We conclude further that the Equity Funds represent, also in Portugal, an important share of the Total Investment Funds and compete, together with the Bond and Cash Funds, in the market of the products that can attract more private investors for their saving applications.
2.1 Evolution of the assets under management in the Portuguese Mutual Funds
The Portuguese investment funds include Mutual Funds and Real Estate funds. During the period from 2001 to 2010 the global economy experienced a huge variety of contexts, from stagnation to expressive growths, with periods of great instability, having lived the biggest financial crisis in history. In spite of the significant decrease in assets under management, caused by that financial crisis, the mutual funds in Portugal still accounted for more than 55% of the total investment funds by 2010, representing a value of 14.237 million. According to the AFPIPP classification, the Mutual Funds in Portugal include Equity Funds, Equity-Saving Funds, Index Equity Funds, Bond Funds, Cash Funds and Other Mutual Funds.
5
Chart 1 - Investment Funds in Portugal – Assets under management (2001 -2010)
Source: Annual Reports from the period 2001-2010, APFIPP
Between 2001 and 2004 the Equity Market Indexes in the world´s major markets, such as Standard & Poor´s 500 Index, Eurostoxx 50 Index, amongst others (see Chart 2), had negative performances in every year.
After this negative period, during 2004 the Equity Market started to recover, where the majority of equity indexes in the developed countries registered positive performances. The Portuguese Stock Market had a good performance by closing the year with an accumulated gain of 15.0%.
In spite of the stagnation verified in the Portuguese economy, caused by the slowdown of the Portuguese consumption, the positive trend on the equity market remained until 2007. As a result, a positive growth was also seen in the Equity Funds in terms of assets under management. In fact, the Equity Funds gained market share until 2007, representing in this year 11.0% of the Total Mutual Funds, comparing to the 5.0% in 2004.
In contrast, during the period 2004 to 2007, the amount of assets under management in Cash Funds and Bond Funds dropped by 30.0% each. This was due to fund´s yields lower than the inflation rate and to the positive performance of the equity markets. Although these graduals fall, both categories continued to be the Funds that had the biggest volume under management.
2001 2002 2003 2004 2005 2006 2007 2008 2009 2010 Total Mutual Funds 21.267 20.609 22.857 24.415 28.290 29.138 25.763 14.342 17.232 14.237 Total Real Estate Funds 4.166 5.015 5.850 7.051 8.164 9.759 10.449 10.698 11.232 11.558 Total Investment Funds 25.432 25.623 28.708 31.466 36.454 38.897 36.212 25.040 28.464 25.795
0 5.000 10.000 15.000 20.000 25.000 30.000 35.000 40.000 M ill ion Eur os
6
Chart 2 - Equity Market Performance – Annually Returns (2001- 2010)
Source: Data Stream
In June 2007 the Subprime mortgage crisis in USA affected the financial markets and quickly spread around the world affecting many economies, including Portugal.
Throughout 2008, the effects of the Subprime mortgage crisis led to a negative growth of the major developed and undeveloped economies worldwide. This was the biggest financial crisis in history. Changes in the macro-economic conditions were made by the Central Banks of Euro Area, USA and UK to decrease the interest rates. From October until December 2008 the ECB decreased the reference rate three times, from 4.0% to 1.0% (see chart 3).
Chart 3 - Central Banks Interest Rates (2001-2010)
Source: Bloomberg Platform
-80,00% -60,00% -40,00% -20,00% 0,00% 20,00% 40,00% 2001 2002 2003 2004 2005 2006 2007 2008 2009 2010
PSI20 Index Eurostoxx50 Index FT Europe Index MSCI Europe Index S&P 500 Index MSCI World Index
0,00 1,00 2,00 3,00 4,00 5,00 6,00 7,00 Bank of England European Central Bank Federal Reserve - USA
7
The price of several commodities also registered record increases. The price of the ICE Brent Futures, which is a deliverable contract based on Exchange of Futures for Physical (EFP) delivery, increased about 6 times, from USD 24.30 in January 2001 to USD 146.08 by July of 2008. Following the same trend, the prices of the most basic food commodities increased on international markets. Rice prices reached ten year highs while the wheat price doubled from February 2007 to February 2008.
Chart 4 - ICE Brent Futures Price (2001-2010)
Source: Bloomberg Platform
Additionally, the collapse of large North-American financial institutions such as Bear Stearns, Lehman Brothers and AIG, amongst others, negatively affected the equity markets. The American government had to intervene to assist the financial institutions with funding, in order to ensure stability of the financial market.
In Portugal, according to National Institute of Statistics (INE), the Portuguese economy recorded a 0.0% growth in 2008, the lowest growth among their Euro Zone partners. In the same year, the inflation and unemployment rates were also affected, and both reached 2.6% and 7.6% respectively.
Consequently, with the decrease in security prices, the Portuguese investors switched their investments from Equity Funds to bank deposits, as banks offered higher interest rates than the expected Equity Funds returns.
This conjuncture caused the decrease in 44.0% of the value of the Mutual Funds, from 25.7 million Euros in 2007 to 14.3 million Euros in 2008, the lowest value since 1997. The Equity Funds were the most affected, with a decrease of 67.0%. This decrease is also a consequence of the depreciation of the Equity Markets themselves. In 2008 the Portuguese market fell by more than 60.0%.
Subsequent to this challenging period, by 2009 the low levels of interest rates offered by the banks contributed to the return of the investors to the Equity and Bond Funds. The Mutual
15,00 $ 30,00 $ 45,00 $ 60,00 $ 75,00 $ 90,00 $ 105,00 $ 120,00 $ 135,00 $ 150,00 $
8
Funds registered a growth above 20.0%, representing a positive net balance of subscriptions less redemptions of 2.0 billion Euros. The good performance of equity markets, where PSI-20 increased by 32.0%, positively affected the evolution of the Equity Funds, which reported a growth of 39.0% during 2009.
Chart 5 - Total Mutual Fund Applications in Portugal by categories (2001-2010).
Source: Annual Reports from the period 2001-2010, APFIPP
By 2010, the debt crisis in the Portuguese economy was characterized with an unemployment rate of 10.0%, a contraction in the economic growth, a budget deficit of 7.0% of the GDP and the government debt being issued with above-average interest rates exceeding 7.0% November.
A drop of 17.0% in the mutual fund assets under management was observed, which can be easily explained by the conjuncture experienced in Portugal. However, the Equity Funds increased their value in 6.0%, especially because of the growth in the Other International Equity Funds and the North American Equity Funds. This might be due to the consciousness of the investors regarding the crisis situation in Europe, mainly caused by the PIGS where Portugal is included, and the better opportunities seen outside the Euro Zone.
2001 2002 2003 2004 2005 2006 2007 2008 2009 2010 Equity Funds 1.961 1.119 1.262 1.337 1.808 2.570 2.939 981 1.366 1.448 Bond Funds 6.405 6.600 8.161 8.950 9.820 8.439 6.324 2.769 2.471 1.547 Cash Funds 7.508 7.602 9.200 8.776 8.685 8.111 6.120 2.985 2.580 1.857 Other Mutual Funds 4.952 4.938 3.839 4.937 7.567 9.602 10.016 7.479 10.665 9.273
-1.000 1.000 3.000 5.000 7.000 9.000 11.000 M ill io n E u ro s
9
2.2 Evolution of the Performance of the Portuguese Equity Funds
According to the APFIPP classification, the Equity Funds are divided into 5 groups: 1. Domestic Equity Funds
2. European Union, Switzerland and Norway Equity Funds 3. North American Equity Funds
4. Sector Equity Funds
5. Other International Equity Funds
While analyzing the overall period, it is possible to identify an irregular behavior in terms of the returns within the 51 Portuguese Equity Funds. In spite of this variety in returns, for the analyzed funds during the period from January 2001 to December 2010, there were two periods in which all funds had significant negative returns. The first is from 2001 to 2004 and the other is from 2007 to 2009.
From 2004 to 2007, the majority of the Equity Funds experienced a recovery, in terms of achieving positive returns. This was the result of the investors shifting to the Equity Market, as the Bond and Cash Funds were offering rates lower than the inflation rate.
In 2007, the Subprime mortgage crises in USA rapidly affected their financial system, spreading the effects into the economy at a worldwide level. As a result, a change occurred on the positive trend observed between the years 2004 to 2007. Hence, all the Portuguese Equity Funds registered a negative return, where the fourth group, the Sector Equity Funds, was the worst category from the Equity Funds group.
By 2009, in spite of the stagnation and even recession of major economies, the Equity Market started to observe a good performance, as a result of the recovery plans initiated by the European Governments and the Central Banks. The decrease of the interest rates offered by the banks was the main engine that contributed to the positive performance of the Equity Funds. Portuguese Equity Funds had positive annual returns where many funds obtained an annual return greater than 20.0% and others exceeded the threshold of 50.0%. According to the 2009 annual report from APFIPP, this was an impressive performance bearing in mind the Euro's appreciation against other currencies like the U.S. dollar and Japanese Yen, which offset part of the gains from investment in securities denominated in those currencies.
After the improvement seen during 2009, in 2010 the Euro Zone was affected by the sovereign debt crisis that broke the positive trend in the performance of the Equity Funds. Although the performance was less negative than in 2007 to 2009, almost all of the Equity Funds managed in Portugal observed monthly negative returns (about 10.0%). The charts regarding the monthly returns of the five groups of Equity Funds can be seen in the Appendix.
10
Chapter 3 - Literature Review
3.1 Introduction
The performance of portfolio managers is getting a considerate amount of attention amongst the financial analysts. Therefore, it is important to understand if Mutual Fund managers are adding value to the portfolios or only excessive transactions costs through their active management. The possibility of finding significant evidence of forecasting ability would be a violation of the efficient market hypothesis and would challenge the theory of finance with respect to optimal portfolio holdings of investors and the equilibrium valuation of securities. The literature review summarizes the main methodologies that have been developed with respect to the evaluation of portfolio managers.
3.2 Capital Market Models (1952-1976)
The Work of Harry Markowitz (1952) on portfolio selection revolutionized the finance theory and laid the foundation for modern capital market theory known as Modern Portfolio Theory (MPT). Harry Markowitz defined the investor portfolio selection by taking into account the utility maximization curves under uncertain conditions, which was an exceptional contribution to the finance theory. MPT seeks to reduce the total variance of the portfolio assuming that investors are rational and that the market is efficient. It defines:
• Asset returns as a normally distributed function, • Risk as the standard deviation return, and
• Portfolio return as the weighted combination of the asset returns.
The “Markowitz bullet”, also known as the efficient frontier, corresponds to a collection of optimal portfolios which represents the combination that offers the best possible returns for a given risk level. The investor chooses the portfolio that maximizes its satisfaction by using an utility function. The best portfolio will be in the tangency point between the indifference curves of an investor and the efficient frontier.
As an extension to Markowitz work, Tobin (1958) highlighted another approach where it is assumed that since most investors are risk adverse, investors prefer to combine risky and risk-free assets in order to decrease the risk level on a portfolio. This creates the Capital Market Line and the point of tangency between this line and the Markowitz Efficient Frontier represents the Market Portfolio. After choosing the optimal portfolio, the investor defines the proportion of his wealth to be invested in both risky and risk-free assets. The methodology of compiling an efficient portfolio and then combining it with a riskless asset are the basics of
11
the Separation Theorem. This separation plays an important role in the development of the Capital Asset Pricing Model, which will be addressed later in the study.
To simplify the Markowitz (1952) model, Sharpe (1963), in his Model of Market, proposed to connect the evolution of the asset return with a specific Market Index. This allowed the division of total risk into two parts: (1) the systematic risk which cannot be eliminated through diversification of assets and the (2) specific risk which can be eliminated through diversification by selecting assets with negative correlations.
The Capital Asset Pricing model (CAPM) was introduced independently by Sharpe (1964), Lintner (1965) and Mossin (1966). According to this model, the investor chooses the optimal portfolio based on the Markowitz model assumptions. The relation between the expected return and portfolio risk are established in order to determine returns that ensure equilibrium in the Capital Markets. The model takes into account (1) the asset´s sensitivity to non-diversifiable risk (systematic risk), which is represented by the quantity Beta (β), (2) the expected market return and (3) the expected theoretical risk-free asset return.
There is a linear relation between the Beta and the expected return known as the: Security Market Line (SML) which graphs the line of the CAPM formula results. The market risk premium is determined by the SML slope. The SML represents a single- model factor such as the asset price, where the Beta represents the exposure to changes in the market value. 3.3 Risk-Adjusted Measures
The development of the capital assets pricing theory lead to the emergence of traditional risk-adjusted measures for portfolio performance.
The Treynor (1965) measure, also known as reward-to-volatility ratio, was the first measure that included risk in the portfolio performance. Treynor’s (1965) objective was to find a performance measure that could be applied to all investors, regardless of their risk preferences. This measure represents the portfolio´s return per unit of systematic risk by assuming that the investor has a diversified portfolio.
The Sharpe (1966) measure, also known as reward-to-variability ratio is quite similar to the Treynor´s measure. Sharpe (1966) measures takes into account the standard deviation as a risk measure, representing the portfolio´s return per unit of total risk.
Similarly, to the above mentioned portfolio performance measures, Jensen’s (1968) measure is also a direct application of the theoretical result of CAPM which tries to capture the ability of portfolio manager to increase returns by predicting security prices and by minimizing the “insurable risk” amount . In other words, it measures the specific part of the portfolio´s rate of return that belongs to the manager´s ability to obtain above the average returns adjusted for market risk. This measure is also known as Alpha.
12 Where,
Residual variable with the following characteristics:
E ( ) Var ( )
Cov ( ) Cov ( )
Jensen (1968) showed in his study that in the presence of timing abilities the market risk estimates can be negatively skewed where as in the selectivity abilities the market risk is positively skewed. The Alpha value includes both abilities. This argument was contested by Grant (1977), who stated that Alpha measure can be negatively skewed when timing abilities are ignored.
The Treynor and Jensen measures provide similar results when evaluating a certain portfolio in terms of relative performance regarding the market portfolio. However, when comparing two portfolios, the same conclusion is not verified as Treynor believes that one portfolio can be better than the other and Jensen disagrees with this conclusion.
If a portfolio is already diversified, the Treynor measure would be the most correct to use, as it considers the systematic risk, rather than using the Sharpe measure.
3.3.1 Limitations regarding traditional measures
One of the limitations associated with the traditional measures and that is questioned by many students, is that because they are based in the CAPM model, the Index of the market is used as proxy for the portfolio market which is not correct, as this can lead to weak results. Roll (1978, pp.6) refers that “…there is a Beta for every individual asset (and thus for every portfolio); but these Betas can be different for different indices and will be different for most. For every asset, an index can be found to produce a Beta of any desired magnitude, however large or small. Thus, for every asset (or portfolio) judicious choice of the index can produce any desired measured “performance”, against the securities market line”.
Another limitation was attributed to Jensen (1968) and Treynor (1965) methodologies, where it was argued that they only consider exclusively the manager´s security selection skills by assuming that the portfolio risk levels are stationary throughout the time frame. A superior performance could be obtained, if both the ability of security selection and the ability of timing were considered by the managers.
13
According to Romacho (2004), the security selection (selectivity) refers to the microforecasting ability of managers to select under or overvalued assets. Thus, according to the CAPM model, the selectivity lies off the security market line. The market timing is the macroforecating ability of managers to forecast changes in the macroeconomic environment in order to change the portfolio Beta and maximize its future return.
Although, studies from Jensen (1969) and Blume (1971), for example, substantiate the assumption of stationary levels of systematic risk of the portfolio, others studies such as Klemkosky and Maness (1978) and Sunder (1980) studies did not verify this statement. These studies, are consistent with the hypothesis that managers are engaged in timing strategies, that is, they stated that “the systematic risk levels were not constant over successive 2 and 4-year periods, and systematic risk could not be predicted from prior risk level with a high degree of certainty” (Klemkosky and Maness, 1978, pp. 639). Fabozzi and Francis (1979), who followed the same technique used by Klemkosky and Maness (1978), Chen and Stockum (1986) and Chen, Lee, Rahman and Chan (1990), were of the opinion that the fund´s Beta may change even if the fund manager does not plan to change the portfolio risk. Fabozzi and Francis (1979) justified this belief with two reasons (1) the Beta value for the individual securities may be intertemporally unstable or (2) changes in the relative market value weights of individual securities in the portfolio will change the portfolio Beta, which is simply a weighted average Beta, even if the individual security Betas are unchanged. The stability of the systematic risk can only be verified if the managers modify the composition of the portfolio in order to maintain the same level of the Beta.
Kon and Jen (1978), using the Switching Regression model also reached the same result of the non-stationary level of the systematic risk.
3.4 Arbitrage Pricing Theory
As an attempt to overcome the limitations of the previous methodologies, Ross (1976, 1977) proposed a new approach which was known as the Arbitrage Pricing Theory (APT). Ross’s (1976, 1977) theory had less restrictions, whereby he assumed that each investor holds a unique portfolio, thus the expected return of a financial asset could be explained by various macro-economic factors. These are represented by a factor-specific Beta-coefficient. Although these methods were advantageous in terms of being less restrictive in its assumptions, Ross (1976, 1977) failed to specify the factors that could affect the portfolio returns. Therefore, with this limitation, the APT showed to be an unreliable method to evaluate the performance of Mutual Funds.
3.5 Selectivity and Market Timing Methodologies
Due to the existence of non stationary levels of risk, it is believed that managers follow or use a particular market timing strategy; therefore it is crucial to take into account the timing
14
ability measure. There are various methods that evaluate manager’s performance by using both selectivity and market timing abilities. These methods will now be analyzed.
The study written by Treynor and Mazuy (1966) was the first to consider the market timing ability in the performance evaluation. In their study a quadratic term was added on the regression analysis conducted by the Jensen´s (1968) measure (equation 3.1), in order to test the market timing ability:
By assuming a constant level of the risk measure over time, it was argued by Treynor and Mazuy (1966) that, if the managers can forecast market returns then managers will hold a greater or a smaller proportion of the market portfolio when the market return is high or low, respectively. Therefore, the portfolio return will be a nonlinear function of the market return. In the Treynor and Mazuy (1966) empirical study they did not find significant timing abilities within the managers, although one manager had a positive significant timing ability: “A least-squares regression technique was employed to fit characteristic –line data for 57 open-end Mutual Funds in our sample; It shows no statistical evidence that the investment managers of any of the 57 funds have successfully outguessed the market; … only one displayed even an F value of 5.6.”(Treynor and Mazuy, 1966, pp.6).
Other empirical studies that were done using the Treynor and Mazuy (1966) model, also reported negative coefficients on the quadratic term. The empirical examination of Cumby and Glen (1990), for example, which studied 15 United States based Mutual Funds concluded: “All 15 funds have estimates of β2 that are significantly negative at the five percent level” (Cumby and Glen, 1990, pp.21).
On Fama’s (1972) study, two types of abilities of the fund managers performance were highlighted, the security selection (selectivity) and the market timing (timing). Nevertheless this method was complex to implement due to the type of information needed.
In order to separate both abilities, Jensen (1972) developed a theoretical structure and concluded that it is impossible to separately measure the contributions for the overall performance when only return data is used. It was also demonstrated by Jensen (1972) that the timing ability could be measured by the correlation between manager’s forecasts and actual market returns.
Moreover, Fabozzi and Francis (1972), in order to measure the two components of the performance, suggested to test the stability of the systematic risk in bear and bull markets. For that they introduced a binary variable in the Jensen Equation (3.2). In their study they analyzed 85 funds and didn´t find positive selectivity and market timing abilities.
15
Merton (1981) and Henriksson and Merton (1981), suggested another approach on which a theoretical structure was proposed where it was possible to separate the both performance components, the market timing and the selectivity. This model will be explained with more detail in Chapter 4.
The Merton and Henriksson (1981) model was used by Henriksson (1984) for 116 Mutual Funds, from 1968 to 1980, where no timing abilities were found. The same result was obtained by Chang and Lewellen (1984) who analyzed 67 Mutual Funds from 1971 to 1979 and by Cataquet and Armada (1992) who analyzed Mutual Funds from United Kingdom. Vieira (1995) and Rao (2000, 2001) also used the Merton and Henriksson model (1981) and didn´t find timing abilities. Connor and Korajczyk (1991) also applied the same model and in the APT context no timing abilities were found.
Another methodology proposed for the timing ability by Bauer and Dahlquist (2001) is the Roulette Wheels on which they didn´t find significant timing ability.
In 2004, Romacho (2004) applied the Merton and Henriksson (1981) model on 21 Portuguese investment funds between the period of 1996 and 2001 and, similarly to other findings, no significant ability for both selectivity and market timing were found.
Another study that also didn´t find significant selectivity and market timing abilities is the research developed by Nikolaos (2002) within the Greek Market. Nikolaos (2002) analyzed 19 Greek mutual funds through the Merton and Henriksson (1981) and Treynor and Mazuy (1966) methods. He justified the negative statistical coefficient of market timing stating that: “is a phenomenon attributable to the lack of experience of their managers within the short period of the life of mutual funds in Greece” (Nikolaos, 2002, pp. 104).
Additionally, Lhabitant (2001), Tripathy (2006), Casaccia (2009) and Murhadi (2010) studies´ findings are also in line with the previous conclusions while using the same methods. Lhabitant (2001) analyzed 60 Swiss mutual funds, Tripathy (2006) 31 Indian mutual funds, Casaccia (2009) 106 Brazilian mutual funds and Murhadi (2010) 55 Indonesian mutual funds. None of them found significant estimates of the two components of the performance.
Offsetting these results, recent studies while applying more complex methods and on a daily frequency data, demonstrate a better evaluation of the performance of the mutual fund´s managers. Leite and Cortez (2006) ´s study, for example, incorporated public information by using conditional models developed by Ferson and Schadt (1996). In their study they show that using conditional models they observe a slight improvement in the mutual fund estimates and in the explanatory power of the models. Other study that can be highlighted is the Sehgal (2008) research. Sehgal (2008), while analyzing 60 Indian mutual funds, through the Carhart (1997) 4-factor model, concludes that: “45% and 28% of the sample funds demonstrate significantly positive market timing coefficients for multi-factor versions of Treynor-Muazy and Hendrikson-Merton models respectively” (Sehgal, 2008, pp. 9). Moreover, the study of Afonso (2010) that used the conditional model of Treynor and Mazuy (1966) and Henriksson and Merton (1981) by using public information related with economic conditions (Ferson and
16
Schadt (1996)) provides evidence that whatever the model applied, the funds show better estimates when using daily data. This finding is in line with Bollen and Busse (2001) suggestion, while stating that the possible explanation for finding negative market timing ability among the fund managers relies on using monthly or annually returns on the studies. Nevertheless, Afonso (2010), didn´t find positive significant market timing abilities, while analyzing 33 Portuguese Equity Funds, whatever the model applied.
When evaluating the manager’s performance in terms of selectivity and timing, the majority of the empirical studies such as: Henriksson (1984), Armada (1992), Cortez and Armada (1997), Lhabitant (2001), Romacho (2004) and Afonso (2010) found a negative correlation between the two abilities.
Henriksson (1984) justifies this with 4 possible reasons:
Errors in the estimates of the model´s variables
Dependence of the abilities regarding the Market returns
Deficient specification of the Market portfolio (the Index may not include all the securities that are in the fund)
Omission of relevant factors in the model
Armada´s (1992) justification regarding the negative correlation is similar to the first justification given by Henriksson (1984).
In the Portuguese scenario, Romacho (2004) stated that as the funds become internationalized the correlation coefficient becomes more negative, and for that, the less specialization of the International Fund managers comparing to the Domestic or European Union Fund managers can be a possible cause.
For Coggin, Fabozzi and Rahmann (1993), where the inverse relation of the selectivity and timing abilities were also verified, this remains an unsettled question in the literature.
Among many methodologies, the theories of Merton (1981) and Merton and Henriksson (1981) will be used in the present empirical investigation, as it allows to separately analyze the two performance components, selectivity and market timing. This will be explained in the next Chapter.
17
Chapter 4 - Methodology
4.1 Merton (1981) and Merton and Henriksson (1981)
Merton (1981) analyzed the patterns of returns resulting from market timing strategy and realized that they were similar to the returns obtained from an option strategy (of the put-protective type). Through this, Merton (1981) developed a theory structure to assess the managers timing ability. It was assumed that there were two possible previsions from the market timer´s forecasts:
• Either stocks will outperform bonds (Bull Market) or • Bonds will outperform stocks (Bear Market).
Within this forecast, the investor adjusts the proportion of the fund invested in the Market Portfolio ( ) and in the risk free asset ( ), without having the need to predict the magnitude of the difference between and .
This model can be described in terms of conditional probability. If the variable represents the market timer´s forecast, where , if the forecast in t-1, for t, is , and
, if the forecast in t-1, for t, is , the conditional probabilities of a correct
forecast will be:
And the conditional probabilities of an incorrect forecast will be:
Consequently, the conditional probability of a correct forecast depends only on whether or not
.
In addition, statistical procedures, parametric and nonparametric tests, were developed by Henriksson and Merton (1981) to investigate market timing and selectivity abilities of investment managers.
18
To use the nonparametric procedures to test investment performance, the forecaster predictions must be observed. Since this information is not readily available it is possible under certain conditions to infer from the portfolio return series the manager´s forecasts. However, according to Henriksson and Merton (1981), such inferences will only, in general, provide noisy estimates of the forecasts.
As in the present study the previous information (predictions of the managers) was difficult to access, we used the parametric tests. This assessment will be carried out bellow.
4.1.1 Parametric Tests
In order to overcome the problem of using a proxy for the predictions of the managers, parametric tests were suggested by Henriksson and Merton (1981). This test allows the identification and separation of the abilities of selectivity and market timing using just the excess returns of the market and of the portfolio. The parametric tests are based under the assumption that the assets are appraised in accordance with the CAPM model, although it can be applied in a multifactorial context, APT for example.
It assumed that the managers do not try or at least are not successful in forecasting the market returns and that they choose between two target risk levels (systematic risk):
when the manager forecast is that ; and when the manager forecast is that
If the manager is rational, the condition has to be verified, as the risk assumed for a bear market ( ) has to be less than in the bull market ( ).
Since the forecasts of the managers are unknown, the systematic risk (Beta of the portfolio in time t) has to be a random variable for a portfolio with market timing, that will assume or according to the manager forecast relatively to a bear or bull market. As a result, the return of the portfolio p, in period t, , can be presented as:
Where,
= Unconditional expected value of ;
β = Unanticipated component of , depend of the prediction; ;
Excess expected return due to the ability of selectivity;
Residual variable with the following characteristics:
E ( )
E ( )
19
A least-squares regression analysis is used to identify the separate increments of performance from microforecasting and macroforecasting. The regression specification can be written as:
Where
The previous equation suggested by Merton (1981) shows that up to an additive noise term, the return obtained through market timing strategy will be similar through an investment in options, like partial protective put. The later is related to buy put options (without considering the payment of the premium), in the market portfolio, with an exercise price of , which correspond to an investment of monetary
units in the market portfolio. The rest of the invested amount should be invested in risk free assets. The variable corresponds to the effective return provided by the options strategy, (the option will only be exercised if and the gain will be equal to . It is important to note that the equation (4.6) is similar to the equation suggested by Jensen (1968) in 3.1, where the only difference is that there is not the term representing the market timing ability.
Still regarding the Merton and Henriksson model (1981), for big samples the parameters of the previous equation can be written as:
Where measures the contribution of the selectivity ability for the performance of the portfolio, which correspond to test (the managers don´t have the selectivity ability); the value of represent the proportion invested in the portfolio market following a strategy of investment in options; and the value represent the number of put options acquired in the market depending on the market timing capabilities of the managers, which correspond to test .
Consequently, the value of the market timing ability (according to Merton (1981)) is given by:
Where is the market price of the put option when implementing the strategy in options. Still regarding the equation 4.6, Henriksson and Merton (1981) shows that:
20
(4.9)
The least squares method will lead to unbiased estimates of the parameters of the portfolio performance. However, as the βt is not stationary, Henriksson and Merton (1981) shows that
the standard deviation of the error (σε p,t) is an increasing function of . Thus, as a way to improve the efficiency of the estimates it is important to correct the heteroscedasticity.
Instead of using the equation 4.6, Henriksson and Merton (1981) proposed through a linear transformation another structure:
Where:
= min (0, ; = max (0, .
Since = and =0 when ≤0 (bear market), and =0 and = when >0 (bull market), the can be interpreted as the Beta for the portfolio when there is bear market and as the Beta when there is bull market. Thus, it implies to test the following hypothesis:
In other words, test if is significantly greater than show that the expected
“up-market” Beta of the portfolio is greater than the expected “down-“up-market” Beta of the portfolio. The meaning of the remains the same as it has in equation 3.1., measuring the selectivity ability of the portfolio managers.
21
Chapter 5 - Empirical Study
According to the Associação Portuguesa de Fundos de Investimento, Pensões e Patrimónios (APFIPP) classification, the Portuguese Mutual Funds include Equity Funds, Equity-Saving Funds, Index Equity Funds, Bond Funds, Cash Funds and Other Mutual Funds. This study will focus on Equity Funds, which according to the division made by APFIPP, is divided into 5 groups:
1. Domestic Equity Funds
2. European Union, Switzerland and Norway Equity Funds 3. North American Equity Funds
4. Sector Equity Funds
5. Other International Equity Funds
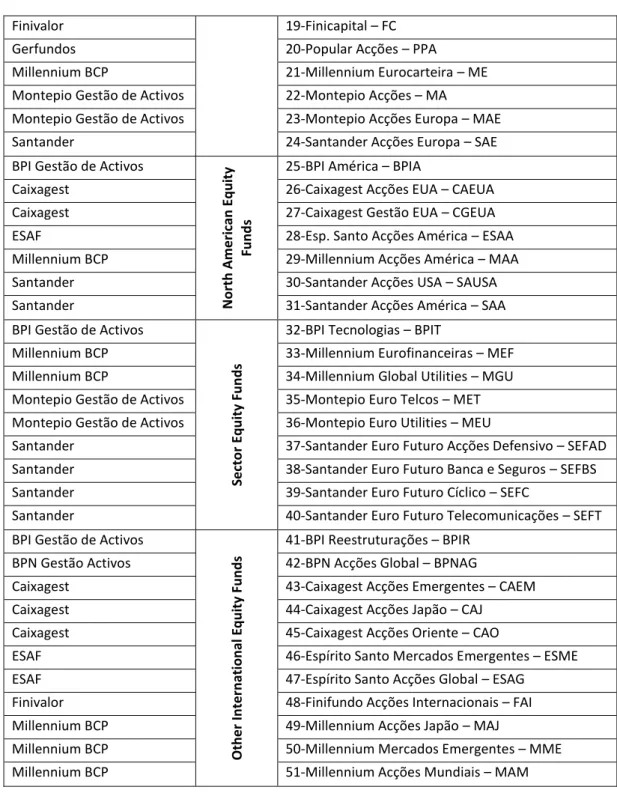
Monthly returns from Portuguese Equity Funds associated with the APFIPP will be examined, from January 2001 to December 2010, which corresponds to a total of 120 observations. In order to belong to this group, each fund must have at least fifty observations during this period. Table 1 demonstrate the final sample consisting of 51 Mutual Funds, which assets account for 91.0% of the total Portuguese Equity Funds. The returns data include all dividends paid by the fund and are net of all management costs and fees and other incurred expenses.
Management Companies Equity Funds
Banif Gestão de Activos
D o m e sti c Eq u ity Fu n d
s 1-Banif Acções Portugal – BAP
Barclays Fundos 2-Barclays Premier Acções Portugal – BPAP BPI Gestão de Activos 3-BPI Portugal – BPIP
Caixagest 4-Caixagest Acções Portugal – CAP Caixagest 5-Caixagest Gestão Lusoacções – CGL ESAF 6-Espírito Santo Portugal Acções – ESPA Millennium BCP 7-Millennium Acções Portugal – MAP Santander 8-Santander Acções Portugal – SAP Banif Gestão de Activos
Eu ro p e an Un io n , N o rway an d Swi tze rl an d E q u ity Fu n d s
9-Banif Euro Acções – BEA BBVA Gest 10-BBVA Bolsa Euro – BBVABE BPI Gestão de Activos 11-BPI Europa Valor – BPIEV
BPI Gestão de Activos 12-BPI Europa Grandes Capitalizações – BPIEGC BPN Gestão Activos 13-BPN Acções Europa – BPNAE
Caixagest 14-Caixagest Acções Europa – CAE Caixagest 15-Caixagest Gestão Euroacções – CGE Caixagest 16-Postal Acções – PSA
Crédito Agrícola Gest 17-Raiz Europa – RE
22 Finivalor 19-Finicapital – FC
Gerfundos 20-Popular Acções – PPA
Millennium BCP 21-Millennium Eurocarteira – ME Montepio Gestão de Activos 22-Montepio Acções – MA
Montepio Gestão de Activos 23-Montepio Acções Europa – MAE Santander 24-Santander Acções Europa – SAE BPI Gestão de Activos
N o rth Am e ri can E q u ity Fu n d s
25-BPI América – BPIA
Caixagest 26-Caixagest Acções EUA – CAEUA Caixagest 27-Caixagest Gestão EUA – CGEUA ESAF 28-Esp. Santo Acções América – ESAA Millennium BCP 29-Millennium Acções América – MAA Santander 30-Santander Acções USA – SAUSA Santander 31-Santander Acções América – SAA BPI Gestão de Activos
Se cto r Eq u ity Fu n d s
32-BPI Tecnologias – BPIT
Millennium BCP 33-Millennium Eurofinanceiras – MEF Millennium BCP 34-Millennium Global Utilities – MGU Montepio Gestão de Activos 35-Montepio Euro Telcos – MET Montepio Gestão de Activos 36-Montepio Euro Utilities – MEU
Santander 37-Santander Euro Futuro Acções Defensivo – SEFAD Santander 38-Santander Euro Futuro Banca e Seguros – SEFBS Santander 39-Santander Euro Futuro Cíclico – SEFC
Santander 40-Santander Euro Futuro Telecomunicações – SEFT BPI Gestão de Activos
Oth e r In te rn ation al E q u ity Fu n d s
41-BPI Reestruturações – BPIR BPN Gestão Activos 42-BPN Acções Global – BPNAG
Caixagest 43-Caixagest Acções Emergentes – CAEM Caixagest 44-Caixagest Acções Japão – CAJ
Caixagest 45-Caixagest Acções Oriente – CAO
ESAF 46-Espírito Santo Mercados Emergentes – ESME ESAF 47-Espírito Santo Acções Global – ESAG
Finivalor 48-Finifundo Acções Internacionais – FAI Millennium BCP 49-Millennium Acções Japão – MAJ
Millennium BCP 50-Millennium Mercados Emergentes – MME Millennium BCP 51-Millennium Acções Mundiais – MAM
23
5.1 Survivorship Bias
One of the problems that affect the evaluation of the fund’s performance during a period is the exclusion of the failed funds, which causes the survivorship bias.
There are different opinions regarding the impact of the survivorship bias on the evaluation of Investment Funds. Studies such as Grinblatt and Titman (1989b) and Leite and Cortez (2006) stated that the effect is minimum while other studies such as Elton, Gruber e Blake (1996) mentioned that the impact depends on the time frame used.
The following table highlights the number of existing funds and the number of liquidated funds between 2001 and 2010. The average of the liquidated funds is about 3.0%, this is considered to be low and may not impact the final result, and therefore it will not be taken into account in the final analysis.
2001 2002 2003 2004 2005 2006 2007 2008 2009 2010 Mean
1) 75 62 57 52 49 51 53 55 52 51 55
2) 6 4 1 4 2 0 1 0 0 2
3) 8% 5% 2% 7% 4% 0% 2% 0% 0% 0% 2,77%
Table 2 - Number of liquidated Equity Funds between January 2001 to December 2010.
Source: APFIPP
1) - Number of existing Funds (31/December) 2) - Number of liquidated Funds
3) - Liquidated Funds (%)
5.2 Returns of the Investment Funds
The Equity Funds data returns were sourced from the APFIPP and the following logarithmic base is used:
Where,
= Monthly return from Fund p at period t
= Value of the investment unit in fund p at period t
24
5.3 Market Returns
To determine Market returns the Equity Index were used as they are considered to benchmark the market portfolio.
Since it was not possible to obtain the benchmark for all funds, a specific Equity Index was used depending on the type of the fund and on the relevant information from the Complete Prospectus. The Equity Index prices were obtained from the Bloomberg platform and for the returns the following logarithmic base was used:
Where,
= Monthly return of the market in period t = Equity Index price in period t
= Equity Index price in period t-1
5.3.1 Equity Index for the different type of Fund
For the Domestic Equity Funds, the PSI20 Total Return was used to represent the market portfolio, as it is the Index considered by those managers.
For the European Union, Switzerland and Norway Equity Funds, 5 Indexes were considered: 1. Dow Jones Eurostoxx 50Net Total Return
2. Stoxx 600 Net Total Return 3. MSCI Europe Local Index 4. Stoxx Europe Large 200 5. FT Europe
For the Finicapital and Montepio Acções funds, a mix of the following Equity Indexes were used for their benchmark, namely the IBEX35, PSI20 Total Return, Dow Jones Eurostoxx 50 Net Total Return and STOXX 600 Net Total Return. For the Finicapital fund the first three were considered and for the Montepio Acções, the PSI20 Total Return and the STOXX 600 Net Total Return were used. The Finicapital and Montepio Acções funds are managed by Finivalor and Montepio Gestão de Activos Financial Institutions, respectively.
25
Regarding the North American Funds, the Equity Index Standard and Poor’s 500 Net Total Return was used as a benchmark for the market portfolio. Although the fact that not every manager hedges the currency risk, for simplicity it was assumed that all seven funds do the hedging and the comparison was done with the Index´s price expressed in USD currency. For the Sector Equity Funds group, depending on the Equity Fund sector, a related Equity Index was used. For the BPI Tecnologias, fund managed by BPI Gestão de Activos, the following two Indexes were considered, the NASDAQ 100 STOCK and the Currency Index ECB Euro Exchange Reference Rate USD, as the hedging of the currency risk exposure is not done and the fund is exposed to the USD Dollar behavior.
For the Millennium Eurofinanceiras fund, three Indexes were taken into account: the Dow Jones Stoxx 600 Banks Supersector Return Index, the Dow Jones Stoxx 600 Financial Services Supersector Return Index and the Dow Jones Stoxx 600 Insurance Index.
For Millennium Global Utilities fund, the MSCI Utilities USD Index is used through their management which is converted into Euros as the hedging of the currency risk exposure is not conducted.
For the Montepio Euro Telcos and Santander Euro Futuro Telecomunicações Funds the Index Stoxx 600 Telecommunications was used as the benchmark for the market portfolio, which is stated in the Full Prospectus. The Montepio Euro Telcos and Santander Euro Futuro Telecomunicações Funds are managed by Montepio Gestão de Activos and Santander Asset Management, respectively.
Other assumptions are as follows:
1. For the Montepio Euro Utilities the Index Euro Stoxx Utilities was used as the benchmark.
2. For the Santander Euro Futuro Banca e Seguros the following two Indexes were assumed, the Dow Jones Stoxx 600 Banks Supersector Return Index and the Dow Jones Stoxx 600 Insurance Index.
3. For the Santander Euro Futuro Acções Defensivo and Santander Euro Futuro Cíclico funds, the MSPE Index was used as the benchmark.
For the Other International Equity Funds group the following Equity Indexes were used: 1. The Equity Index MSCI World (Euros) for the BPI Reestruturações fund; 2. The Equity Index MSCI World Total Return (Euros) for the BPN Acções
Global, Finifundo Acções Internacionais, and Millennium Acções Mundiais funds;
3. The Equity Index MSCI World (Local Currency) for the Espírito Santo Acções Global fund;
4. The Equity MSCI Emerging Markets for Caixagest Acções Emergentes and for the Espírito Santo Mercados Emergentes fund;
26
5. The Equity Index FTSE Japan for the Caixagest Acções Japão and Millennium Acções Japão funds;
6. The Equity Index MSCI Pacific (excluding Japan) for the Caixagest Acções Oriente fund, and;
7. The Equity Index MSCI Emerging Markets Free Index for the Millennium Mercados Emergentes fund. The Currency Index ECB Euro Exchange Reference Rate USD was also used, as the hedging of the currency risk is not conducted and there is an exposition to the USD Dollar behavior.
In the Appendix it is exposed a table with the Equity Indexes respective annual returns.
5.4 Risk-free Rate Return
For the Risk-free rate a one month Euro Interbank Offered Rate (Euribor) was used. This rate was obtained from the Reuter’s platform and recapitalized for monthly rates which is depicted in the following logarithmic base:
Where,
= Risk-free Rate Return
= Euribor Rate 1 Month
5.5 Descriptive Statistics
The following table presents the principal descriptive statistics of the Portuguese Equity Funds returns as well as of the respective Equity Indexes during the decade of 2001 to 2010. It is important to notice that in the five groups of funds (Domestic Equity Funds, European Union, Switzerland and Norway Equity Funds, North American Equity Funds, Sector Equity Funds and Other International Equity Funds), most of the funds have an average return bellow the average return of their respective equity index. In relation to the volatility of the funds, measured by the standard deviation, most of the funds are riskier than their respective equity index.
By comparing and analyzing the five groups of funds, the best funds belong to the Sector Equity Funds, as these funds represent better values of the mean and standard deviation comparing to their specific benchmark. In this way, the best funds are the following:
• Montepio Euro Telcos
• Santander Euro Futuro Acções Defensivo • Santander Euro Futuro Cíclico
27
• BPI Reestruturações
• Caixagest Mercados Emergentes • Espírito Santo Mercados Emergentes Descriptive Stats Mean Standard
Deviation
Median Minimum Maximum
Domestic Equity Funds -0,0002 0,0579 0,0057 -0,2070 0,1385
PSI20 0,0000 0,0572 0,0083 -0,2320 0,1149
European Union, Norway and Switzerland Equity Funds
-0,0029 0,0595 0,0082 -0,2013 0,1287 Eurostoxx50 -0,0023 0,0597 0,0074 -0,2062 0,1440 Millennium Eurocarteira -0,0036 0,0542 0,0076 -0,1969 0,1315 FT Europe 0,0003 0,0502 0,0103 -0,1536 0,1371 BPN Acções Europa -0,0014 0,0540 0,0041 -0,1349 0,1035 MSCI Europe -0,0031 0,0521 0,0047 -0,1459 0,1131 Finicapital 0,0038 0,0533 0,0149 -0,1957 0,1359 IBEX_PSI_Eurostoxx50 0,0090 0,0888 0,0236 -0,3537 0,2312 Montepio Acções -0,0004 0,0515 0,0092 -0,1833 0,1359 PSI_Stoxx600 0,0000 0,0507 0,0085 -0,1867 0,1242
European Union, Norway and Switzerland Equity Funds
-0,0031 0,0516 0,0021 -0,1590 0,1412
Stoxx Large 200 -0,0008 0,0498 0,0088 -0,1529 0,1540
European Union, Norway and Switzerland Equity Funds
-0,0035 0,0530 0,0039 -0,1664 0,1239
Stoxx 600 0,0000 0,0501 0,0087 -0,1515 0,1334
North American Equity Funds -0,0038 0,0483 0,0017 -0,1424 0,0933
SP500TR 0,0007 0,0481 0,0095 -0,1844 0,0909
BPI Tecnologias -0,0087 0,0817 -0,0043 -0,3434 0,2454
Nasdaq + ECB 0,0005 0,0447 0,0056 -0,1557 0,0866
Millennium Eurofinanceiras -0,0065 0,0784 0,0029 -0,3097 0,2818
Dow Jones FS, Banks and Inssurance
-0,0034 0,0716 0,0031 -0,2430 0,2460
Millennium Global Utilities 0,0009 0,0400 0,0098 -0,1248 0,0962
MSCI Utilities 0,0011 0,0386 0,0096 -0,1162 0,0727
Montepio Euro Telcos 0,0013 0,0393 0,0088 -0,1026 0,0747
Stoxx 600 Telecommunications
-0,0005 0,0432 -0,0008 -0,1039 0,0857
Montepio Euro Utilities 0,0029 0,0470 0,0104 -0,1240 0,1061
Eurostoxx Utilities 0,0039 0,0552 0,0147 -0,1508 0,0974
Santander Euro Futuro Acções Defensivo and Santander Euro Futuro Cíclico
0,0017 0,0413 0,0060 -0,1296 0,0940
MSPE Index -0,0030 0,0492 0,0072 -0,1496 0,1197
Santander Euro Futuro Banca e Seguros
-0,0056 0,0757 0,0036 -0,2810 0,2779
Dow Jones Banks and Inssurance
-0,0051 0,0787 0,0027 -0,2947 0,2695