THE PARAMETRIC EFFECT AND
OPTIMIZATION ON JIS S45C STEEL
TURNING
Hasnul Hadi
1, Liyana Tajul
2, Z.A. Zailani
3, M.F.M.A Hamzas
4, M.S Hussin
5Faculty of Manufacturing Engineering, Universiti Malaysia Perlis (UniMAP) 02600 Arau, Perlis, Malaysia
http://www.unimap.edu.my
Abstract :
Economics of machining are mostly affected by the cutting parameters used in operations. This study investigates simulation of Finite Element Method (FEM) under DEFORM software to clarify the effect of cutting parameters which are cutting speed, depth of cut, feed rate, and tool nose run off onto JIS S45C steel turning process using uncoated tungsten carbide cutting tools. Three outputs of the machining which focusing on the cutting tool are studied for this research. The output are cutting load, cutting tool temperature, and tool effective stress. Taguchi method and ANOVA analysis are used to study the performance characteristics and to find out the optimal cutting parameters of the turning process for JIS S45C steel. The obtain simulation result’s is verified with the experimental result of previous researcher works. Feed rate and cutting speed play the major role to the turning output since these parameters change give huge impact on cutting tool temperature change and directly contribute to the tool wear and surface roughness changes. Experimental results are provided to illustrate the effectiveness of this approach. Throughout this study the main cutting parameters that affect the cutting performance in turning operations and the best combination are classified.
Keywords: Optimization, JIS S45C Steel, Taguchi Method, ANOVA
1. Introduction
Turning process is one of the main machining processes which aim to remove undesired part of the material or work piece into desired shape. In modern manufacturing, utilizing effective turning process becomes the major aspect to the effectiveness of the company production Understanding of material removal concept in metal cutting is very important in design process and cutting tool selection to ensure the quality of the products [4].
Proper selection of tool materials, cutting parameters, tool geometry and machine tools is essential to produce high-quality products at low cost [5]. In order to involve all the technological operations, optimum technological processes, optimum tool selection, suitable combination of tool-workpiece material and determination of optimum cutting variables and tool geometry must be considered. Numerical simulation is used to study various phenomenon such as, chip segmentation, cutting force and wear rate of cutting tool [6]. Among the famous software available in the market are DEFORM, SOLIDWORKS, ABAQUS, and ADVANTEDGE.
2. Experimental Methodology
This analysis will be done under simulation of finite element modeling software, the DEFORM software. In order to carry out this project, two steps has been executed and the steps are:
1. Simulation of the design experiment 2. Taguchi method and ANOVA analysis
2.1. Simulation of the design experiment
Parameters condition for the simulation is decide based on the previous researcher experiment setup condition so that the final comparison and evaluation for the analysis part will be the same. Initially condition for process setup is determined as below:
• Material used: JIS SC45 steel • Insert used: TNMA 332
• Initial temperature: 20ºC (process condition) • Coolant: None
• Shear friction factor: 0.6
• Heat transfer coefficient: 45N/sec/mm/ ºC
The parameter select for this study is based on the previous researcher work which is for comparison purpose.
Table 2.1: Parameters and levels.
LEVEL
PARAMETER 1 2 3
A: Cutting Speed (m/min) 150 200 250
B: Cutting Depth (mm) 0.50 1.00 1.50
C: Feed Rate (mm/rev) 0.02 0.06 1.00
D: Tool Nose Run Off (mm) 0.10 0.03 -0.10
The cutting parameters and it variation will be again arranged in orthogonal L9 table. Once the parameter is completely arrange in L9 orthogonal array based on Taguchi method, the next step is to perform the simulation which will be done by the simulation of DEFORM software. There are two part of the software simulation to complete an experiment simulation.
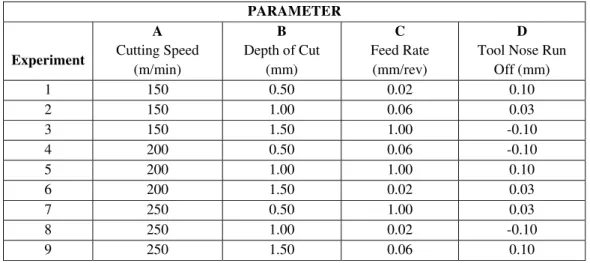
Table 2.2: Orthogonal array (L9) arrangement for simulation and experiment.
PARAMETER
Experiment
A Cutting Speed
(m/min)
B Depth of Cut
(mm)
C Feed Rate
(mm/rev)
D Tool Nose Run
Off (mm)
1 150 0.50 0.02 0.10 2 150 1.00 0.06 0.03 3 150 1.50 1.00 -0.10 4 200 0.50 0.06 -0.10
5 200 1.00 1.00 0.10
6 200 1.50 0.02 0.03
7 250 0.50 1.00 0.03
8 250 1.00 0.02 -0.10
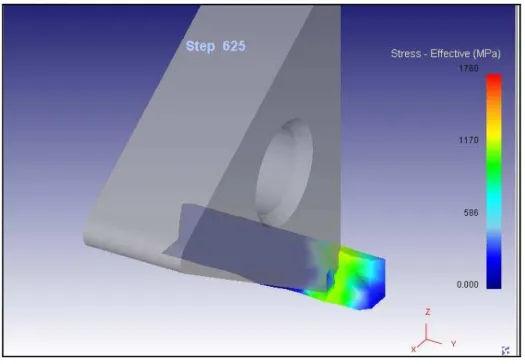
Figure 2.1: Schematic of orthogonal cutting modeling for JIS S45C steel using DEFORM software.
2.2 Taguchi method and ANOVA analysis
Taguchi has used signal-noise [S/N] ratio as the quality characteristic of choice. The smaller the better S/N ratio quality characteristics is chosen for this study which usually to analyzed the undesired output like defects, wear, or else. These conditions apply for which the ideal value is zero. The equation is:
(1)
The analysis of reducing and controlling variation also can be done by applying ANOVA technique. The ANOVA analysis is used to find out the parameter which gives the most effect to the turning process and also the contribution of each parameters involve to the output of the process.
3. Result and Discussion
The S/N ratio and ANOVA analysis technique is used to clarify the objective of the experiment which are the effect of the cutting parameter towards the desired output and to optimum the parameter for this JIS S45C turning process. All data obtain will be analyzed to identify the effect of each cutting parameters to five turning output which are tool cutting load, tool temperature, and tool effective stress. In this study, these three output is consider because it give the most effect onto the tool life of the cutting tool insert and surface roughness of the workpiece. Cutting load is defined as the force generated when the undesired part is removed from the main part. Tool temperature is degree of heat generated at the tool tips throughout the machining process.
3.1 Effect of Varying Cutting Parameters
Table 3.1: Results of simulation of machining using orthogonal array L9.
Experiment number Tool Cutting Load (N)
Tool Temperat
ure (°C)
Tool Effective Stress (MPa)
1 130 92 3210
2 430 238 2649
3 966 370 2573
4 210 244 1828
5 628 400 2712
6 271 134 1113
7 287 402 12008
8 179 124 1503
9 680 325 22327
After the data is obtained, the SN ratio and ANOVA analysis is and the parameter percentage contribution on each output shown in Table 3.2.
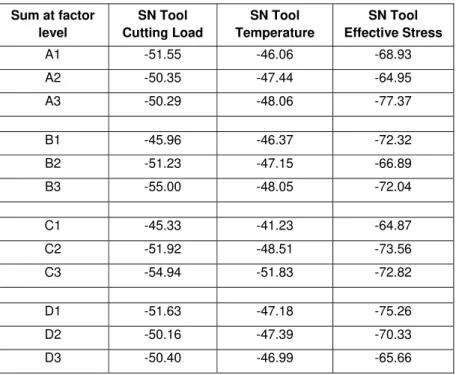
Table 3.2: SN ratio for each parameter level.
Sum at factor level
SN Tool Cutting Load
SN Tool Temperature
SN Tool Effective Stress
A1 -51.55 -46.06 -68.93
A2 -50.35 -47.44 -64.95
A3 -50.29 -48.06 -77.37
B1 -45.96 -46.37 -72.32
B2 -51.23 -47.15 -66.89
B3 -55.00 -48.05 -72.04
C1 -45.33 -41.23 -64.87
C2 -51.92 -48.51 -73.56
C3 -54.94 -51.83 -72.82
D1 -51.63 -47.18 -75.26
D2 -50.16 -47.39 -70.33
D3 -50.40 -46.99 -65.66
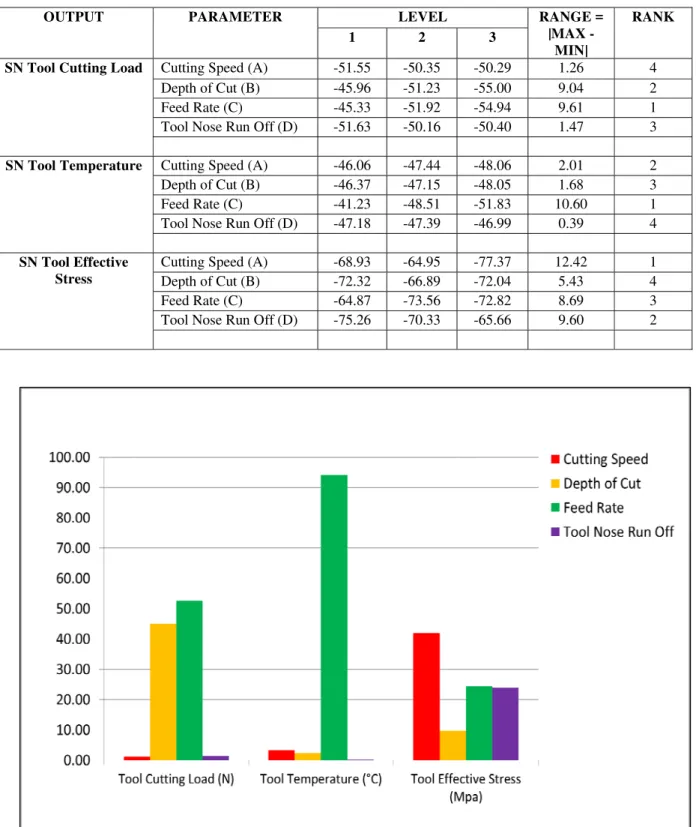
The data is again arranged to obtain the rank of each parameter towards the turning output is shown in Table 3.3. From the ANOVA analysis, the percentage contribution of the parameter on output is calculated to know the effect of the parameter and also to obtain the optimum parameter combinations.
OUTPUT PARAMETER LEVEL RANGE = |MAX
-MIN|
RANK 1 2 3
SN Tool Cutting Load Cutting Speed (A) -51.55 -50.35 -50.29 1.26 4
Depth of Cut (B) -45.96 -51.23 -55.00 9.04 2
Feed Rate (C) -45.33 -51.92 -54.94 9.61 1
Tool Nose Run Off (D) -51.63 -50.16 -50.40 1.47 3
SN Tool Temperature Cutting Speed (A) -46.06 -47.44 -48.06 2.01 2
Depth of Cut (B) -46.37 -47.15 -48.05 1.68 3
Feed Rate (C) -41.23 -48.51 -51.83 10.60 1
Tool Nose Run Off (D) -47.18 -47.39 -46.99 0.39 4
SN Tool Effective Stress
Cutting Speed (A) -68.93 -64.95 -77.37 12.42 1
Depth of Cut (B) -72.32 -66.89 -72.04 5.43 4
Feed Rate (C) -64.87 -73.56 -72.82 8.69 3
Tool Nose Run Off (D) -75.26 -70.33 -65.66 9.60 2
Figure 3.1: Parameter contribution graph for JIS S45C steel machining.
Output / Parameter Cutting Speed Depth of Cut Feed Rate Tool Nose Run Off
Total
Tool Cutting Load (N) 1.10 44.95 52.60 1.35 100.00
Tool Temperature (°C) 3.38 2.26 94.23 0.12 100.00
Tool Effective Stress (Mpa) 41.98 9.75 24.24 24.02 100.00
From the Figure 3.1 and Table 3.4, for the tool cutting load the result shows that the feed rate impact onto cutting load is 52.60%, depth of cut (44.95%), tool nose run off (1.35%) and cutting speed (1.10%). This result can be generally observed from arrangement of experiment parameters in orthogonal array L9 table where the experiment with level 3 of feed rate (0.10 mm/rev) give high value of cutting tool load, which can be represented by output from experiment 3, experiment 5 and experiment 9 which is 966N, 628N, and 680N respectively. For tool temperature, feed rate contribute 94.23% percentage, cutting speed 3.38%, depth of cut 2.26% and tool nose run off (0.12%). The feed rate will cause the increase of tool revolution which consequently makes the process end in shorter time which will result in increment of friction between tool tips and workpiece. The result on tool temperature can be observed from experiment 3, experiment 5 and experiment 9 which result in 370°C, 400°C and 402°C respectively where all experiment is set with feed rate equal to 0.10 mm/rev. For the tool effective stress, cutting speed contribute 41.98%. The workpiece temperature generation is led by feed rate with 53.48% followed by depth of cut 38.66%.
3.2 Optimum Parameter Combination
Optimum parameter combination is obtain using the ANOVA analysis based on the SN ratio obtained. The analysis will show us the percentage contribution or the degree of effect for each parameter onto the machining output. For this study, the previous three output are consider for analysis since these factor give most impact onto cutting tool life and surface roughness. The simulation result which based on this analysis will later compared to experimental result to see how far these two result agreed to each other.
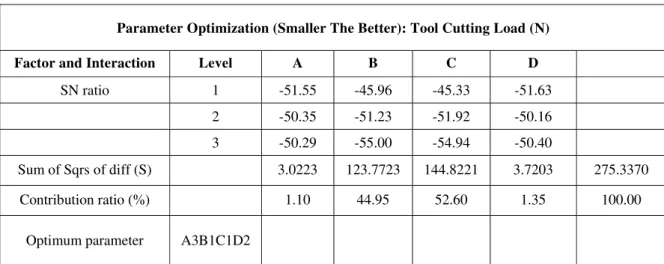
Table 3.5: ANOVA analysis for cutting tool load.
Parameter Optimization (Smaller The Better): Tool Cutting Load (N)
Factor and Interaction Level A B C D
SN ratio 1 -51.55 -45.96 -45.33 -51.63
2 -50.35 -51.23 -51.92 -50.16
3 -50.29 -55.00 -54.94 -50.40
Sum of Sqrs of diff (S) 3.0223 123.7723 144.8221 3.7203 275.3370
Contribution ratio (%) 1.10 44.95 52.60 1.35 100.00
Optimum parameter A3B1C1D2
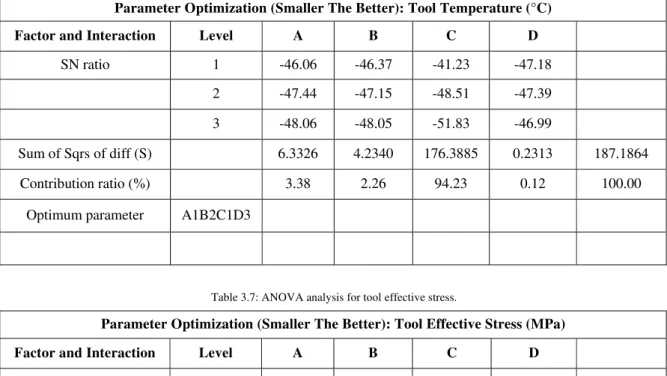
Parameter Optimization (Smaller The Better): Tool Temperature (°C)
Factor and Interaction Level A B C D
SN ratio 1 -46.06 -46.37 -41.23 -47.18
2 -47.44 -47.15 -48.51 -47.39
3 -48.06 -48.05 -51.83 -46.99
Sum of Sqrs of diff (S) 6.3326 4.2340 176.3885 0.2313 187.1864
Contribution ratio (%) 3.38 2.26 94.23 0.12 100.00
Optimum parameter A1B2C1D3
Table 3.7: ANOVA analysis for tool effective stress.
Parameter Optimization (Smaller The Better): Tool Effective Stress (MPa)
Factor and Interaction Level A B C D
SN ratio 1 -68.93 -72.32 -64.87 -75.26
2 -64.95 -66.89 -73.56 -70.33
3 -77.37 -72.04 -72.82 -65.66
Sum of Sqrs of diff (S) 241.3940 56.0908 139.3915 138.1314 575.0077
Contribution ratio (%) 41.98 9.75 24.24 24.02 100.00
Optimum parameter A3B1C1D2
In Table 3.5, for tool load, the analysis show us that feed rate contribute 52.60% followed by depth of cut 44.95%, 1.10% and 1.35% for cutting speed and tool nose run off respectively. Since the optimization characteristic is based on “the smaller the better”, so the optimum combination to obtained the optimum cutting load for this JIS S45C steel is A3B1C1D2. Analysis of ANOVA for tool temperature shows that feed rate contribute 94.23% followed by cutting speed 3.38%, depth of cut 2.26%, tool nose run off 0.12%, and. The optimum parameter combination for tool temperature is A1B2C1D3. The last ANOVA analysis is on tool effective stress which give us parameter contribution ration of 41.98% for cutting speed, 24.24% for feed rate, 24.02% for tool nose, and 9.75% for depth of cut. Optimum parameter combination is A3B1C1D2.
From this analysis, it show us that, from three factors consider, the C factor which is feed rate give us the same parameter level which is level one, C1. This tell us that high value of feed rate will largely effect the turning process in term of tool load, tool temperature, and tool effective stress which are directly effect on the cutting tool life and surface roughness. For cutting speed, the optimum combination for these three output is either A3 and A2. This result shows that for optimum output the cutting speed must be set at high speed. For depth of cut, the optimum combination is either B1 or B2 which indicate that the optimum experiment setup is at high value. Tool nose run off give low percentage contribution on these three output which mean that the setup condition or value is relatively can be neglected. The optimum setup for these three output is at D2 and D3.
The simulation of the experiment is next been confirmed which an experimental research done by previous researcher [7], under the title “Parametric Optimization on Multi-Objective Precision Turning Using Grey Relational Analysis”. For this experiment Wang has done the precision diameter turning operation of JIS S45C (D45x250mm) workpiece on an ECOCA-3807 CNC lathe and the parameter of the research is arranged the same as in Table 2.2 and Table 2.1. The result of machine is shown by Table 3.8. The parameter level rank onto the output is shown in Table 3.9.
Table 3.8: Experimental result on JIS S45C turning.
Machined results
Experiment Surface Roughness (µm) Tool wear (mm-2) MRR (mm3min-1)
1 0.6231 6.67 e-07 0.015
2 0.7300 4.72 e-07 0.090
3 0.7100 3.67 e-07 0.225
4 0.6300 8.46 e-07 0.060
5 0.7866 5.98 e-07 0.200
6 0.5348 3.43 e-07 0.060
7 0.7066 8.46 e-07 0.125
8 0.6466 4.13 e-07 0.050
9 0.5100 2.91e-07 0.225
From Table 3.8, the experiment result show experiment 7 and experiment 4 experienced greatest tool wear which is 8.46 e-07mm-2 and 8.46 e-07 mm-2 respectively. For surface roughness experiment 2, 3, 5, and 7 experienced high surface roughness with 0.7300 µm, 0.7100 µm, 0.7866 µm and 0.7066 µ m respectively. In Table 3.9 we can observed that the most impact factor onto surface roughness and tool wear is feed rate (63.97%), followed by depth of cut (20.07%), tool nose run off (10.65%) and cutting speed is the lowest with (5.31%).
Table 3.7: SN ratio and rank of heaviest factor affecting the experiment.
Result of factor response
Parameter
Level A B C D
1 0.5419 0.5050 0.6603 0.5201
2 0.5271 0.5279 0.5482 0.5620
3 0.5479 0.5840 0.4085 0.5320
Rage 0.0209 0.0790 0.2518 0.0419
Percentage 5.31 20.07 63.97 10.65
This parameter percentage contribution (experimental result) is almost the same for all the outcome of JIS S45C machining simulation using DEFORM software where it is identified that feed rate at high value setup will give most contribution on the machining outcome followed by depth of cut as shown in Figure 3.1. Tool nose run off and cutting speed is fair impact between each other but does not affect much the operation.
DATA ANALYSIS AND RESULT
Exp Cutting Speed (A3) Depth of Cut (B3) Feed Rate (C1) Tool Nose Run Off (D2)
Tool Cutting Load (N) Tool Temp. (°C) Tool Eff. Stress (MPa)
1 250 1.5 0.02 0.03 240 146 1069
From the experimental result, it is found that the optimum multi-objective turning parameters combination are A3 (250m min-1), B3 (1.5mm), C1 (0.02mm rev-1), and D2 (±0.03mm). This combination optimum parameter is verified by the simulation as in Table 3.8, which shows that the experimental optimum parameter combination is proportional to the simulation result. From this optimum parameter setting, the cutting speed must be set at highest level of study which is 250m/min(level 3) to obtain good surface finish with low surface roughness. Increasing cutting speed result in decreasing cutting forces, thus lowering the amount of heat generation and rate of strain hardening.
The relation shows that cutting speed and surface roughness is inversely proportional where increasing the cutting speed will decreases the surface roughness. For the feed rate, the optimum outcome is obtained with lowest level 0.02mm/rev which is level 1. It is found that the relationship between feed rate and surface roughness is directly proportional where increasing the feed rate increases the surface roughness [2]. A large amount of metal removed is subjected to higher temperature and plastic deformation as feed rate is increased [3]. For other two factors, the depth of cut which is set at 1.5mm and tool nose run off at 0.03mm, these two do not give much impact to the optimum output of the machining. The depth of cut does not have a significant influence on the tool wear rate where influence of the depth of cut on the tool wear rate is negligibly small if the machining is carried out at the optimum cutting regime [1].
4. Conclusion
From this study, the relationship between the parameters of the machining tool can be seen clearly. The following conclusions can be made based on simulations that were carried out during this study:
1. For overall performance, the feed rate give a high degree of impact to all machining output with different percentage contribution where the increase in feed rate will increase the tool temperature which also increase the tool wear.
2. Cutting speed give the most impact onto workpiece effective stress and tool effective stress which is 71.73% and 41.96% respectively where low cutting speed result in poor or high surface roughness.
3. The optimum parameter for JIS S45C steel machining under this study based on ‘smaller the better’ quality characteristic approach of SN ratio and ANOVA analysis, is obtained with the lowest feed rate (0.02 mm rev-1), the highest cutting speed (250 m min-1) and highest depth of cut (D = 1.5 mm) and tool nose run off (±0.03 mm) which lead to optimum surface roughness value and optimum tool wear.
References
[1] Astakhov, V.P. (2006). Effects of the cutting feed, depth of cut, and workpiece (bore) diameter on the tool wear rate. International Journal of Advance Manufacturing Technology.
[2] Hasan G¨o kkaya. (2005). The Effects of Cutting Tool Coating on the Surface Roughness of AISI 1015 Steel Depending on Cutting Parameters. Turkish Journal Engineering Environment Science.
[3] Senussi, G. H. ( 2007). Interaction Effect of Feed Rate and Cutting Speed in CNC-Turning on Chip Micro-Hardness of 304- Austenitic Stainless Steel. World Academy of Science, Engineering and Technology.
[4] Shet, C., Deng, X. (2000). Finite element analysis of the orthogonal metal cutting process. Journal of Materials Processing Technology 105: 95-109.
[5] Ulvi Seker. (2003). The effect of feed rate on the cutting forces when machining with linear motion.
[6] Umbrello, D. D., Filice, L., Rizzuti, S., Micari, F., & Settineri, L. (2007). On the effectiveness of Finite Element simulation of orthogonal cutting with particular reference to temperature prediction. Journal of Materials Processing Technology 189: 284–291.
[7] Wang, M.Y. & Lan, T.S. (2008). Parametric Optimization on Multi-Objective Precision Turning Using Grey Relational Analysis.