ACPD
12, 11391–11413, 2012Vertical transport of pollutants by shallow
cumuli
G. Chen et al.
Title Page
Abstract Introduction
Conclusions References
Tables Figures
◭ ◮
◭ ◮
Back Close
Full Screen / Esc
Printer-friendly Version Interactive Discussion
Discussion
P
a
per
|
Dis
cussion
P
a
per
|
Discussion
P
a
per
|
Discussio
n
P
a
per
|
Atmos. Chem. Phys. Discuss., 12, 11391–11413, 2012 www.atmos-chem-phys-discuss.net/12/11391/2012/ doi:10.5194/acpd-12-11391-2012
© Author(s) 2012. CC Attribution 3.0 License.
Atmospheric Chemistry and Physics Discussions
This discussion paper is/has been under review for the journal Atmospheric Chemistry and Physics (ACP). Please refer to the corresponding final paper in ACP if available.
Vertical transport of pollutants by shallow
cumuli from large eddy simulations
G. Chen1, H. Xue1, G. Feingold2, and X. Zhou1,3
1
Department of Atmospheric and Oceanic Sciences, School of Physics, Peking University, Beijing, 100871, China
2
NOAA Earth System Research Laboratory, Boulder, CO 80305, USA
3
Chinese Academy of Meteorological Sciences, Beijing, 100081, China Received: 30 March 2012 – Accepted: 9 April 2012 – Published: 3 May 2012 Correspondence to: H. Xue ([email protected])
ACPD
12, 11391–11413, 2012Vertical transport of pollutants by shallow
cumuli
G. Chen et al.
Title Page
Abstract Introduction
Conclusions References
Tables Figures
◭ ◮
◭ ◮
Back Close
Full Screen / Esc
Printer-friendly Version Interactive Discussion
Discussion
P
a
per
|
Dis
cussion
P
a
per
|
Discussion
P
a
per
|
Discussio
n
P
a
per
|
Abstract
This study investigates the vertical transport of a passive tracer in a shallow cumu-lus boundary layer using large eddy simulations. The tracer source is at the surface in one case, and in the inversion layer in the other case. Results show that shallow cumulus clouds can significantly enhance vertical transport of the tracer in both cases. 5
In the case with surface-borne pollutants, cloudy regions are responsible for the up-ward transport, due to the intense updrafts in cumulus clouds. In the case where pollu-tants are aloft, cloud-free regions are responsible for the downward transport, but the downward transport mainly occurs in thin regions around cloud edges. This is consis-tent with previous aircraft measurements of downdrafts around cumulus clouds and 10
indicates that the downward transport is also induced. We also preformed cloud-free sensitivity runs for the two cases. Results show that this dry convection can neither transport the surface-borne pollutants into the inversion layer, nor transport pollutants from the inversion layer downward to the lower boundary layer. Cumulus convection is therefore more effective than dry convection at venting pollutants upward from the sur-15
face, and fumigating pollutants in the inversion layer downward into the lower boundary layer.
1 Introduction
Apart from affecting vertical structure of tropospheric radiative heat flux divergence, modulating hydrologic cycle, convective clouds can also enhance the vertical mixing 20
of gaseous matter and aerosol. Warm phase shallow convection can enhance vertical mixing in the boundary, but can hardly transport boundary layer air above the capping inversion (Cotton et al., 1995), while deep convection, usually associated with mixed phase clouds, can transport large amount of reactive species to a high level rapidly be-fore they are oxidized by photochemical reactions. According to the estimation of Cot-25
ACPD
12, 11391–11413, 2012Vertical transport of pollutants by shallow
cumuli
G. Chen et al.
Title Page
Abstract Introduction
Conclusions References
Tables Figures
◭ ◮
◭ ◮
Back Close
Full Screen / Esc
Printer-friendly Version Interactive Discussion
Discussion
P
a
per
|
Dis
cussion
P
a
per
|
Discussion
P
a
per
|
Discussio
n
P
a
per
|
layer air into the cloud layer, which represents a venting of the entire boundary layer about 90 times a year.
Shallow cumulus covers about 12 % over the ocean and 5 % over the land (Warren et al., 1986, 1988), and has been shown to have a great effect on dispersing local pollutants based on both observational and modelling studies. A field experiment by 5
Ching and Alkezeweeny (1986) showed that mixed layer pollutants are vented into the overlying cloud layer by active cumulus clouds, and that such active clouds may force cloud layer air downward into the mixed layer. Niewiadomski (1986) made a remarkable simulation on convective and turbulent transport of a passive pollutant using a 3-D cloud model. It was shown that non-precipitating cumuli result in a great horizontal 10
variability of the pollutant concentration and are quite effective in venting the polluted boundary layer, even though these cumuli are relatively sparse and weak. According to the estimation of Thompson et al. (1994), shallow cumulus and synoptic-scale weather systems together make a comparable venting flux of CO with deep convections, but the relative fluxes due to shallow convection and synoptic-scale weather systems are 15
poorly known. Shallow convection must be taken into account in pollutant transport in the lower troposphere where most emissions take place. For example, in the wet season over a tropical rain forest, venting by shallow cumuli is proved to be the main process that modifies the redistribution of tracer species (Edy et al., 1996).
Transport of pollutants by cumulus clouds is not only a dynamical process, but also 20
related to the chemical characteristics of the pollutants and their chemical reactions. Simulations by Flossmann and Wobrock (1996) showed that medium-sized precipi-tating cumulus clouds can scavenge significant amount of soluble species and also release some species back into the air when the clouds evaporated, which suggested that clouds represent an efficient element in the environmental pollution chain (Floss-25
ACPD
12, 11391–11413, 2012Vertical transport of pollutants by shallow
cumuli
G. Chen et al.
Title Page
Abstract Introduction
Conclusions References
Tables Figures
◭ ◮
◭ ◮
Back Close
Full Screen / Esc
Printer-friendly Version Interactive Discussion
Discussion
P
a
per
|
Dis
cussion
P
a
per
|
Discussion
P
a
per
|
Discussio
n
P
a
per
|
substantially affect pollutant mixing ratios locally, but have little effect on mixing ratios averaged over space and time.
In recent years, as the computational capabilities are greatly improved, modelling studies lead the way toward understanding cumulus processes, while observational studies are intended to validate model-based findings. Simulations by Zhao and Austin 5
(2005a, b) revealed the toroidal circulation in shallow cumulus clouds. They argued that on average cumulus convection occurs in a region with time-integrated volume roughly 2 to 3 times that of the liquid-water-containing volume. More recent studies proposed a refined view of vertical mass transport by cumulus that downdrafts outside clouds are confined in thin shell regions around cloud edges, and that the subsiding shell is 10
attributed to evaporative cooling (Heus and Jonker, 2008; Heus et al., 2009; Jonker et al., 2008). This result can explain the finding that pollutions in the environment far away from cumulus clouds mix very slowly throughout the cloud layer (Verzijlbergh et al., 2009). Aircraft measurements by Wang et al. (2009) confirmed the toroidal circulation in cumulus clouds, and found that negative buoyancy is present 200 m outside clouds, 15
while downdrafts prevail in the regions less than 700 m from cloud edges. However, a study by Wang and Geerts (2010) showed that the shell characterized by negative buoyancy is only 100 m for small cumulus clouds. This suggests that the characteristic lateral mixing depth somewhat scales with cloud size.
As the up-scaled counterpart of shallow convection, deep convection has received 20
a larger number of studies (Dickerson et al., 1987; Ferek et al., 1986; Lelieveld and Crutzen, 1994) for its great efficiency in transporting pollutants from the lower boundary layer to free atmosphere. Cotton et al. (1995) estimated that, on a global-annual basis, the extratropical cyclone has the highest boundary layer mass flux of all cloud vent-ing systems, followed by the general class of Mesoscale Convective Systems (MCS’s) 25
ACPD
12, 11391–11413, 2012Vertical transport of pollutants by shallow
cumuli
G. Chen et al.
Title Page
Abstract Introduction
Conclusions References
Tables Figures
◭ ◮
◭ ◮
Back Close
Full Screen / Esc
Printer-friendly Version Interactive Discussion
Discussion
P
a
per
|
Dis
cussion
P
a
per
|
Discussion
P
a
per
|
Discussio
n
P
a
per
|
Model results of Barth et al. (2001) showed that solubility and retention of tracers in hydrometeors can alter the fate of tracers in mid-latitude convection. When soluble tracers are degassed as the parent hydrometeor is converted to ice, snow, or hail through microphysical processes, both low- and high-solubility tracers are transported to the upper troposphere; when soluble tracers are retained in ice hydrometeors, the 5
highly soluble tracers are not ultimately transported to the troposphere but, instead, are precipitated out of the upper troposphere by snow and hail. Yin et al. (2005) found that deep convective clouds can transport aerosols from the boundary layer, detrained and then re-entrained the aerosols into the middle levels of clouds. This process con-tributes to a large fraction of the aerosols inside hydrometeors (∼40 % by mass). Cui 10
and Carslaw (2006) suggested a positive feedback between vertical transport efficiency of aerosol in convective clouds and increases in tropospheric aerosol abundance. In-creases in aerosol concentrations reduce the precipitation efficiency and the scaveng-ing efficiency of aerosol, and therefore allow more aerosols to be transported to the upper troposphere.
15
In this study, we involve an ideal passive tracer in the large eddy simulation to study the vertical transport of pollutants by shallow cumuli. Previous studies usually take advantage of observed profiles of tracer chemicals, like CO or H2O2. This can make
the results close to the observations, but it is difficult to separate the influence of cumuli from other possible factors, like chemical reactions, long-range transport. The tracer 20
source in this study is separately prescribed at the surface and in the version layer, in order to analyse both the upward and downward transport mechanism by shallow cumuli and shed light on the structure of cumulus convection. Additionally, because the cloud-free boundary layer turbulence also plays an important role in mixing pollutants, a comparison between cumulus convection and dry convection is also included in this 25
ACPD
12, 11391–11413, 2012Vertical transport of pollutants by shallow
cumuli
G. Chen et al.
Title Page
Abstract Introduction
Conclusions References
Tables Figures
◭ ◮
◭ ◮
Back Close
Full Screen / Esc
Printer-friendly Version Interactive Discussion
Discussion
P
a
per
|
Dis
cussion
P
a
per
|
Discussion
P
a
per
|
Discussio
n
P
a
per
|
2 Model and case descriptions
The large eddy simulation used in this research was described by Stevens et al. (1999). The condensation scheme is based on the all-or-nothing assumption (bulkwater pa-rameterization): cloud water exists when relative humidity is greater than 100 %. We involve a tracer scalar in the model to represent a certain inert insoluble pollutant, like 5
CO, O3and some inert aerosols.
The simulation is initialized with soundings from the Barbados Oceanic and Me-teorological Experiment (BOMEX), a typical marine shallow cumulus case, accord-ing to the fourth intercomparison study of the Global Water and Energy Experiment (GEWEX) Cloud System Studies (GCSS) Working Group 1 (Siebesma et al., 2003). 10
Near surface is a well-mixed subcloud layer of 500 m, above which is a weak condi-tional unstable cloud layer extending to the inversion at about 1500 m. The domain size is 6.4 km×6.4 km×3 km, with doubly periodic lateral boundary. The resolution is ∆x= ∆y=100 m and ∆z=40 m. The simulation is run for 24 h with a time step of 1.5 s, and data is recorded every 5 min. BOMEX has the practical advantage of a lack 15
of diurnal cycle. This makes longer runs possible and ensures a statistically identi-cal cloud field over the entire run. The Smagorisky model is chosen as the SGS-TKE model, in which TKE is diagnostic, not prognostic, so no initialization for TKE is made as that in Siebesma et al. (2003).
Two cases are run in this study. In case 1, the tracer source is uniformly dis-20
tributed at the surface to investigate vertical transport of pollutants from the surface. The source releases tracers into the domain with a constant flux of 5.78 mg m−2s−1 (5 mg kg−1m−2s−1) from 2 h 0 min to 6 h 0 min (here in after, all statements of time are with respect to the simulation time). In case 2, a tracer is instantly released into the domain atz=1.6∼2.0 km with a uniform mixing ratio of 100 mg kg−1at 2 h 0 min. Trac-25
ACPD
12, 11391–11413, 2012Vertical transport of pollutants by shallow
cumuli
G. Chen et al.
Title Page
Abstract Introduction
Conclusions References
Tables Figures
◭ ◮
◭ ◮
Back Close
Full Screen / Esc
Printer-friendly Version Interactive Discussion
Discussion
P
a
per
|
Dis
cussion
P
a
per
|
Discussion
P
a
per
|
Discussio
n
P
a
per
|
scaled to any passive pollutants. As sensible tests, another two runs of dry convection are respectively initialized as case 1 and case 2 but dismiss the condensation process.
3 Results
3.1 Case 1: vertical transport of pollutants from the surface
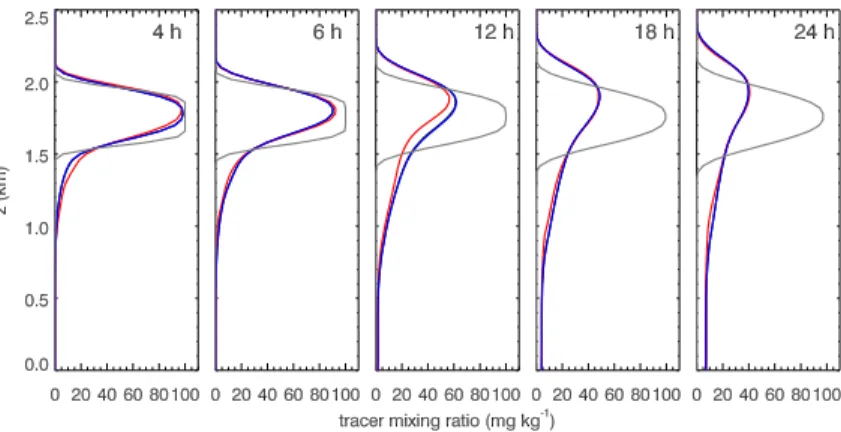
Figure 1 presents profiles of tracer mixing ratio averaged over the whole domain, cloudy 5
columns (liquid water path LWP >10 g m−2), and cloud-free columns at di
fferent mo-ments. The constant source of tracer at the surface is on from 2 h to 6 h, and there is no source from 6 h to 24 h. Tracers released from the surface are gradually transported to the cloud layer and even into the inversion layer. Higher tracer mixing ratio can be seen in the cloudy columns. Note that tracer mixing ratio averaged over the whole do-10
main is almost the same as that over the cloud-free columns, due to the small cloud fraction (5.2 % averaged over the last 22 h) in this simulation.
When the source is on (e.g., 4 h and 6 h), a notable feature is that significant gra-dients of tracer mixing ratio are maintained near the surface and immediately below cloud base. Tracer mixing ratio over cloudy columns is significantly higher than that 15
over cloud-free columns, not only in the cloud layer (about 0.7∼1.5 km) but also in the subcloud layer (about 0∼0.7 km) and the inversion layer (about 1.5∼2 km). This sug-gests that pollutants are brought below clouds from nearby regions by convergent flows below clouds, increasing local pollution but decreasing nearby pollution, and then ef-ficiently transport pollutants from the subcloud layer into the cloud layer. Some higher 20
clouds manage to get into the inversion layer and bring pollutants there. However, the simulation shows very small cloud fraction (5.5 %) and low cloud top height (0.91 km on average) at 6 h. The higher tracer mixing ratio from 1.3 km to 1.6 km over cloud-free columns at 6 h compared to that over cloudy columns results from clouds that were higher and transported tracers upward at previous moments but have evaporated and 25
ACPD
12, 11391–11413, 2012Vertical transport of pollutants by shallow
cumuli
G. Chen et al.
Title Page
Abstract Introduction
Conclusions References
Tables Figures
◭ ◮
◭ ◮
Back Close
Full Screen / Esc
Printer-friendly Version Interactive Discussion
Discussion
P
a
per
|
Dis
cussion
P
a
per
|
Discussion
P
a
per
|
Discussio
n
P
a
per
|
After the source is shut down (12 h, 18 h and 24 h), tracers continue to be trans-ported upward and vertical gradients near the surface are neglectable, while gradients immediately below cloud base are still significant. Tracer mixing ratio becomes higher in cloud and inversion layers but lower in the subcloud layer. This indicates that trac-ers become well-mixed vertically in the boundary layer. It is seen that during this time 5
period, cloudy columns still have higher tracer mixing ratio than cloud-free columns, but the difference becomes smaller with time, suggesting that tracers become mixed better horizontally. For example, at 12 h, tracer mixing ratio is significantly higher in the cloudy columns than in cloud-free columns in cloud and inversion layers (0.6–2.0 km), but shows no difference in the subcloud layer (below 0.6 km). Cloudy-columns and 10
cloud-free columns show smaller difference in the cloud layer (0.6–1.5 km) at 18 h, and even smaller at 24 h. Although tracers are favorably transported upward in clouds, the cloud-free columns can gradually have higher tracer mixing ratio because clouds orig-inally in these columns evaporate and leave the tracers there. The reason why tracer mixing ratio is the same in the cloudy columns and cloud-free columns in the inversion 15
layer (1.5–2.0 km) at 18 h and 24 h is that clouds penetrating into the inversion layer evaporate and release tracers. The tracers can then rapidly mix horizontally throughout the inversion layer.
In the corresponding dry convection case, the continuous source at the surface main-tains large vertical gradients near the surface until 6 h. From 12 h, the vertical gradient 20
near the surface is neglectable. Tracers are vertically well mixed in the boundary layer but are trapped below the inversion layer. Compared to cumulus convection, dry con-vection shows a great efficiency in transporting tracers from the surface to layers below the inversion (4 h and 6 h in Fig. 1), but does not transport tracers into the inversion layer as the cumulus convection does (12 h, 18 h and 24 h in Fig. 1).
25
ACPD
12, 11391–11413, 2012Vertical transport of pollutants by shallow
cumuli
G. Chen et al.
Title Page
Abstract Introduction
Conclusions References
Tables Figures
◭ ◮
◭ ◮
Back Close
Full Screen / Esc
Printer-friendly Version Interactive Discussion
Discussion
P
a
per
|
Dis
cussion
P
a
per
|
Discussion
P
a
per
|
Discussio
n
P
a
per
|
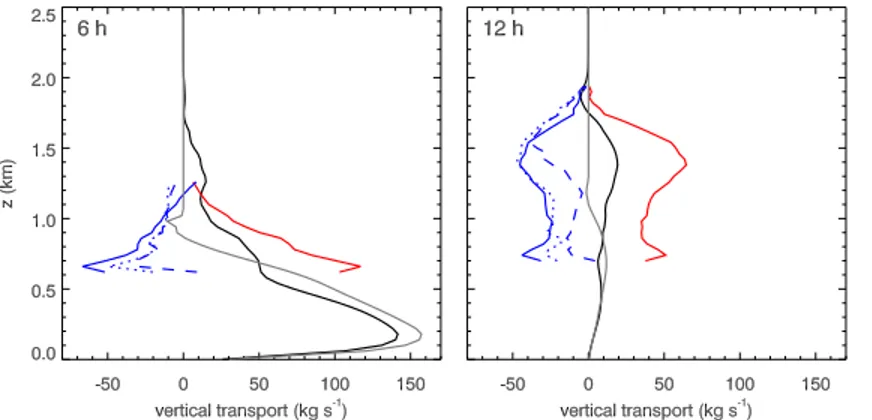
the cloud-free grids. We choose these regimes, especially cloudy grids, to show the important effect of cumulus transport. The vertical transport at each grid is defined as the mass of tracers vertically transported in unit time (Flossmann and Wobrock, 1996),
ρwrA, where ρ is the air density, w is the vertical component of air velocity, r is the tracer mixing ratio, andAis the horizontal cross section of the grid. The total transport 5
over the domain is upward throughout the boundary layer for both 6 h and 12 h. It has a maximum at about 0.2 km at 6 h, due to higher tracer mixing ratio in cloudy columns (associated with updrafts) than in cloud-free columns (associated with downdrafts) and intense vertical motion of air. The total transport becomes weaker at 12 h because the tracer is better mixed in the boundary layer (see 12 h in Fig. 1). It is seen that cloudy 10
grids contribute to upward transport, while cloud-free grids contribute to downward transport in the cloud layer for both 6 h and 12 h. Because the cloud coverage is only 5.6 %, it can be inferred that the upward transport per cloudy grid is much stronger than the downward transport per cloud-free grid.
Figure 2 also shows the profiles of vertical transport for the dry convection case. 15
Similar to the cumulus convection case, this case generally has upward transport over the boundary layer. However, the upward transport by dry convection is stronger in the layer ofz=0∼0.7 km compared to that in the cumulus convection case, and weaker in the layer ofz=0.7∼0.9 km, consistent with the profiles of tracer mixing ratio shown in Fig. 1. The difference between the two cases is due to the latent heat released into the 20
cloud layer by cumulus clouds. The heated cloud layer can stabilize the air below and weaken the upward transport of pollutants from the surface to cloud layer. Meanwhile, the heated cloud layer can also destabilize the air above and strengthen the upward transport of pollutants from the cloud layer to the inversion layer. Therefore, dry con-vection has a greater efficiency than cumulus convection in mixing pollutants in lower 25
boundary layer. By contrast, cumulus convection can efficiently transport pollutants from the cloud layer to the inversion layer.
cloud-ACPD
12, 11391–11413, 2012Vertical transport of pollutants by shallow
cumuli
G. Chen et al.
Title Page
Abstract Introduction
Conclusions References
Tables Figures
◭ ◮
◭ ◮
Back Close
Full Screen / Esc
Printer-friendly Version Interactive Discussion
Discussion
P
a
per
|
Dis
cussion
P
a
per
|
Discussion
P
a
per
|
Discussio
n
P
a
per
|
free regions, cumulus clouds can induce downdrafts that prevail in thin shells close to cloud edges (e.g., Wang et al., 2009). This suggests that the downward transport in cloud-free grids may also be affected by clouds. Figure 2 shows how much downward transport is associated with cumulus clouds. In the lower and middle parts of the cloud layer (e.g., 0.7∼1 km at 6 h and 0.7∼1.5 km at 12 h), the cloud-free grids within 200 m 5
from cloud edges contribute about half of the downward transport but only take up less than 15 % of the domain area (figure not shown); grids within 600 m from cloud edges contribute almost all the downward transport and take up less than 60 % of the domain area. This indicates that the downward transport outside clouds prevail within about 600 m from cloud edges, consistent with the aircraft measurements of downdrafts 10
around cumulus clouds by Wang et al. (2009). Around the cloud top (e.g., 1∼1.3 km at 6 h and 1.5∼1.9 km at 12 h), the downward transport by grids within 200 m from cloud edges is similar with that by grids within 600 m from cloud edges, suggesting that tracers detrained from cloud tops tend to be distributed in the thin shells within 200 m around clouds.
15
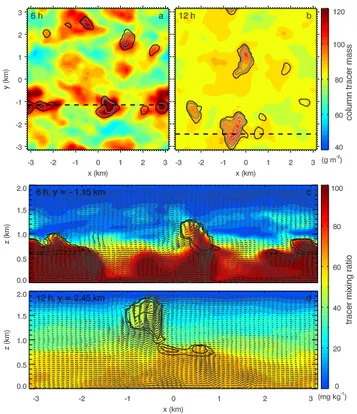
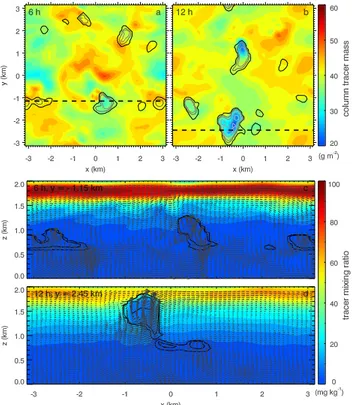
Figure 3 presents the snapshots of column-integrated tracer mass at 6 h and 12 h, accompanied by vertical cross sections at these two moments. Figure 3a and b show that column-integrated tracer mass in cloudy columns are higher than that in cloud-free columns, consistent with results in Fig. 1. The higher tracer mass in cloud-free columns (e.g.,x=0.5∼1.5 km, y=0∼1 km at 6 h) is attributed to evaporated clouds that were 20
previously in these regions. Tracers in these regions will gradually get diluted by the cloud-free boundary layer turbulence, which can be clearly seen in snapshots after 6 h (figures not shown here). In the vertical cross sections in Fig. 3c and d, it is seen that pollutants are transported out of the lower boundary through cloudy regions. Higher mixing ratios of pollutants are found in cloudy columns than in the cloud-free columns, 25
both in the cloud layer and in the subcloud layer (e.g., the cloud at x=0.5∼1.0 km at 6 h), which confirms the results from Fig. 1. Some clouds penetrate into the inver-sion layer and transport pollutants directly to the inverinver-sion layer (e.g., the cloud at
ACPD
12, 11391–11413, 2012Vertical transport of pollutants by shallow
cumuli
G. Chen et al.
Title Page
Abstract Introduction
Conclusions References
Tables Figures
◭ ◮
◭ ◮
Back Close
Full Screen / Esc
Printer-friendly Version Interactive Discussion
Discussion
P
a
per
|
Dis
cussion
P
a
per
|
Discussion
P
a
per
|
Discussio
n
P
a
per
|
3.2 Case 2: vertical transport of pollutants from the inversion layer
In case 2, a tracer with uniform mixing ratio is released at 2 h 0 min at z=1.6∼2.0 km (i.e. the inversion layer). Figure 4 presents profiles of tracer mixing ratio averaged over the whole domain, cloudy columns (liquid water path LWP>10 g m−2), and cloud-free columns at different moments in case 2. Tracers in the inversion layer are gradually 5
transported down to the layers below. Tracer mixing ratio becomes lower in the inver-sion layer and higher in the lower boundary layer. At 4 h and 6 h, tracer mixing ratio over cloudy columns is similar to that over cloud-free columns. This is because only a few traces get fumigates down to the lower boundary layer, and clouds are not high enough to reach the primary pollutant layer and have little effect on the distribution of 10
tracers, as will be discussed in Fig. 6. Instead, the cloud-free boundary layer turbulence plays a more important role. At 12 h, tracer mixing ratio over cloudy columns is slightly smaller than that in cloud-free columns, due to the transport of cleaner air from lower layers by clouds. At 18 h and 24 h, more tracers are transported downward to lower layers. As tracers get mixed horizontally, the difference between tracer mixing ratios in 15
cloudy and cloud-free columns becomes smaller with time. In the corresponding dry convection case, tracers only disperse around the inversion layer and can hardly be transported downward. Therefore, cumulus convection plays a more important role in transporting tracers from the inversion layer downward than dry convection.
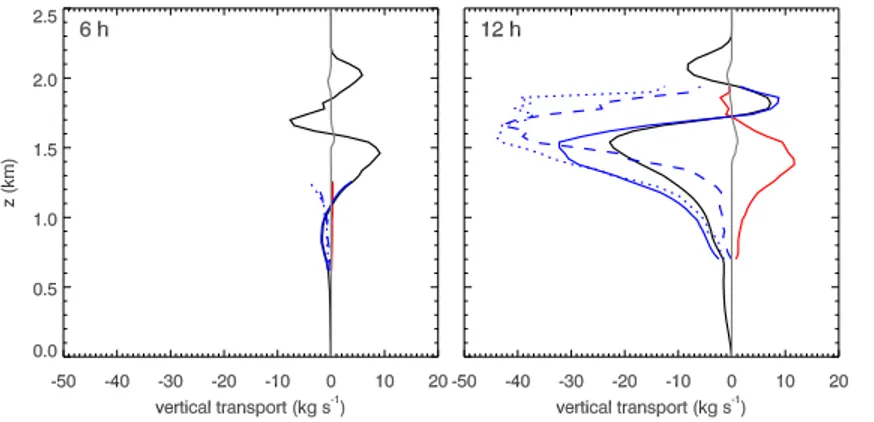
Figure 5 shows profiles of vertical transport over different regimes at 6 h and 12 h for 20
case 2. In the inversion layer, great values of vertical transport at both 6 h and 12 h are induced by oscillating movement of air and high tracer mixing ratio. When averaged over time, the vertical transport in the inversion layer is not so significant as in Fig. 5. Below the inversion layer, the total transport in the domain is slightly negative (down-ward) at 6 h. Transport in cloudy grids is neglectable because tracer mixing ratio is very 25
ACPD
12, 11391–11413, 2012Vertical transport of pollutants by shallow
cumuli
G. Chen et al.
Title Page
Abstract Introduction
Conclusions References
Tables Figures
◭ ◮
◭ ◮
Back Close
Full Screen / Esc
Printer-friendly Version Interactive Discussion
Discussion
P
a
per
|
Dis
cussion
P
a
per
|
Discussion
P
a
per
|
Discussio
n
P
a
per
|
gradually fumigated into the layer below inversion, the downward transport in the do-main becomes stronger. Similar to case 1, cloudy grids contribute to upward transport, while cloud-free grids contribute to downward transport, and the downward transport is found to mainly occur in the thin regions around clouds. For instance, in the lower and middle parts of the cloud layer (z=0.7∼1.5 km), grids within 200 m from cloud edges 5
are responsible for about half of the downward transport by all the cloud-free grids, and grids within 600 m from cloud edges are responsible for nearly all the downward transport. Around the upper part of the cloud layer (z=1.5∼1.9 km), transport by grids within 600 m from cloud edges exceeds that by grids within 200 m from cloud edges at 12 h, because of the uniformly-initialized tracer mixing ratio in this layer. The total down-10
ward transport in cloud-free grids is smaller than that in the thin regions around clouds, implying that grids further than 600 from cloud edges contribute to upward transport. In contrast, dry convection shows no significant vertical transport throughout the bound-ary layer. Therefore, it can be concluded that the downward transport is induced by cumulus clouds.
15
Figure 6 presents the snapshots of column-integral tracer mass at 6 h and 12 h. Cloudy regions usually have lower tracer mass, consistent with Fig. 5. Some exceptions are shown, for example, the region:x=−3∼ −2 km andy =−1.5∼−1 km, tracer con-centration in the cloud is almost the same with surrounding regions. This is attributed to the cloud’s low top, and it is clearly shown in the vertical cross section (Fig. 3c). In the 20
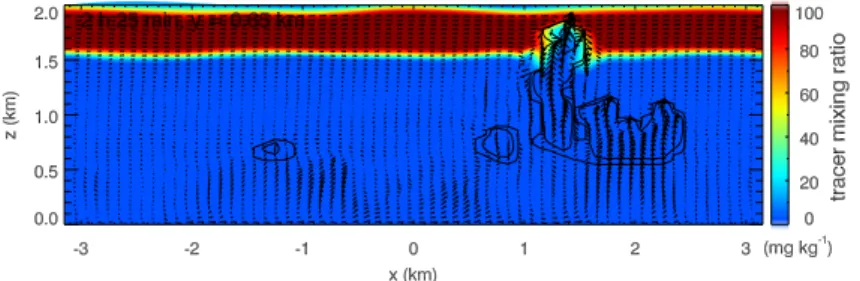
vertical cross sections, it is seen that cumulus clouds work as bubbles bringing clean air from the subcloud layer into the cloud layer, thus diluting pollution there. Polluted air is forced downward around the cloud edges (e.g., the cloud atx=0∼1 km at 6 h). A more evidencing cross section,y=0.65 km at 2 h 25 min, is shown in Fig. 7. In the regions with high clouds that grow into the pollutant layer (e.g.,x=1∼2 km in Fig. 7), 25
ACPD
12, 11391–11413, 2012Vertical transport of pollutants by shallow
cumuli
G. Chen et al.
Title Page
Abstract Introduction
Conclusions References
Tables Figures
◭ ◮
◭ ◮
Back Close
Full Screen / Esc
Printer-friendly Version Interactive Discussion
Discussion
P
a
per
|
Dis
cussion
P
a
per
|
Discussion
P
a
per
|
Discussio
n
P
a
per
|
results of Verzijlbergh et al. (2009), where pollutants far away from the cumulus can be hardly affected by cumulus circulations.
4 Conclusion
A passive tracer is used in large eddy simulations for studying the vertical transport of pollutants by shallow cumuli. The tracer source is continuous for 4 h at the surface in 5
one case, and is instant in the inversion layer in the other case to investigate both the upward and downward transports associated with cumulus clouds. Results show that shallow cumuli are quite efficient in both venting pollutants from the surface upward to the cloud layer and fumigating pollutants from the inversion layer downward into the lower boundary. When the tracer source is at the surface, it is found that cloudy regions 10
are responsible for the upward transport due to intense updrafts in cloudy regions. When the tracer source is in the inversion layer, it is found that cloud-free regions, mainly the thin shells about 600 m from cloud edges, are responsible for the downward transport. This is consistent with aircraft measurements of downdrafts around cumulus clouds by Wang et al. (2009), and indicates that the downward transport is also induced 15
by cumulus clouds.
In contrast, dry convection shows a great efficiency in mixing pollutants in the lower boundary layer, but can neither transport pollutants from the lower boundary layer to the inversion nor fumigate pollutants from the inversion down to lower layers. The different ability of transport by cumulus convection and dry convection may result from the latent 20
heat released in the cloud layer by cumulus. The heated cloud layer stabilizes the air below and weakens the transport between subcloud and cloud layers, but destabilizes the air above and enhances the transport between cloud and inversion layers.
However, because shallow cumulus clouds can hardly grow to the free atmosphere, cumuli in this study do not show ability to accomplish the across-inversion transport. 25
ACPD
12, 11391–11413, 2012Vertical transport of pollutants by shallow
cumuli
G. Chen et al.
Title Page
Abstract Introduction
Conclusions References
Tables Figures
◭ ◮
◭ ◮
Back Close
Full Screen / Esc
Printer-friendly Version Interactive Discussion
Discussion
P
a
per
|
Dis
cussion
P
a
per
|
Discussion
P
a
per
|
Discussio
n
P
a
per
|
Acknowledgements. We thank Jost Heintzenberg for helpful discussions and suggestions on
this manuscript. This work is supported by Chinese NSF grant 41075097.
References
Barth, M. C., Stuart, A. L., and Skamarock, W. C.: Numerical simulations of the July 10, 1996, Stratospheric-Tropospheric Experiment: Radiation, Aerosols, and Ozone (STERAO)-Deep
5
Convection experiment storm: Redistribution of soluble tracers, J. Geophys. Res.-Atmos., 106, 12381–12400, 2001.
Bertram, T. H., Perring, A. E., Wooldridge, P. J., Crounse, J. D., Kwan, A. J., Wennberg, P. O., Scheuer, E., Dibb, J., Avery, M., Sachse, G., Vay, S. A., Crawford, J. H., McNaughton, C. S., Clarke, A., Pickering, K. E., Fuelberg, H., Huey, G., Blake, D. R., Singh, H. B., Hall, S.
10
R., Shetter, R. E., Fried, A., Heikes, B. G., and Cohen, R. C.: Direct measurements of the convective recycling of the upper troposphere, Science, 315, 816–820, 2007.
Ching, J. K. S. and Alkezweeny, A. J.: Tracer study of vertical exchange by cumulus clouds, J Clim Appl Meteorol, 25, 1702–1711, 1986.
Cotton, W. R., Alexander, G. D., Hertenstein, R., Walko, R. L., McAnelly, R. L., and Nicholls,
15
M.: Cloud venting - A review and some new global annual estimates, Earth-Sci. Rev., 39, 169-206, 1995.
Cui, Z. Q. and Carslaw, K. S.: Enhanced vertical transport efficiency of aerosol in convective clouds due to increases in tropospheric aerosol abundance, J. Geophys. Res.-Atmos., 111, D15212, doi:10.1029/2005JD006781, 2006.
20
Dickerson, R. R., Huffman, G. J., Luke, W. T., Nunnermacker, L. J., Pickering, K. E., Leslie, A.C. D., Lindsey, C. G., Slinn, W. G. N., Kelly, T. J., Daum, P. H., Delany, A. C., Green-berg, J.P., Zimmerman, P. R., Boatman, J. F., Ray, J. D., and Stedman, D. H.: Thunder-storms:Animportant mechanism in the transport of airpollutants, Science, 235, 460-464, 1987.
25
Edy, J., Cautenet, S., and Bremaud, P.: Modeling ozone and carbon monoxide redistribution by shallow convection over the Amazonian rain forest, J. Geophys. Res.-Atmos., 101, 28671– 28681, 1996.
Ferek, R. J., Chatfield, R. B., and Andreae, M. O.: Vertical distribution of dimethylsulfide in the marine atmosphere, Nature, 320, 514–516, 1986.
ACPD
12, 11391–11413, 2012Vertical transport of pollutants by shallow
cumuli
G. Chen et al.
Title Page
Abstract Introduction
Conclusions References
Tables Figures
◭ ◮
◭ ◮
Back Close
Full Screen / Esc
Printer-friendly Version Interactive Discussion
Discussion
P
a
per
|
Dis
cussion
P
a
per
|
Discussion
P
a
per
|
Discussio
n
P
a
per
|
Flossmann, A. I., and Wobrock, W.: Venting of gases by convective clouds, J. Geophys. Res.-Atmos., 101, 18639–18649, 1996.
Flossmann, A. I.: Clouds and pollution, Pure Appl. Chem., 70, 1345–1352, 1998.
Heus, T. and Jonker, H. J. J.: Subsiding shells around shallow cumulus clouds, J. Atmos. Sci., 65, 1003–1018, doi:10.1175/2007jas2322.1, 2008.
5
Heus, T., Pols, C. F. J., Jonker, H. J. J., Van den Akker, H. E. A., and Lenschow, D. H.: Obser-vational validation of the compensating mass flux through the shell around cumulus clouds, Q J Roy Meteor Soc, 135, 101–112, doi:10.1002/Qj.358, 2009.
Jonker, H. J. J., Heus, T., and Sullivan, P. P.: A refined view of vertical mass transport by cumulus convection, Geophys Res Lett, 35, L07810, doi:10.1029/2007gl032606, 2008.
10
Lelieveld, J. and Crutzen, P. J.: Role of deep cloud convection in the ozone budget of the troposphere, Science, 264, 1759–1761, 1994.
Niewiadomski, M.: A passive pollutant in a three-dimensional field of convective clouds: Nu-merical simulations, Atmos. Environ., 20, 139–145, 1986.
Siebesma, A. P., Bretherton, C. S., Brown, A., Chlond, A., Cuxart, J., Duynkerke, P. G., Jiang, H.
15
L., Khairoutdinov, M., Lewellen, D., Moeng, C. H., Sanchez, E., Stevens, B., and Stevens, D. E.: A large eddy simulation intercomparison study of shallow cumulus convection, J. Atmos. Sci., 60, 1201–1219, 2003.
Stevens, B., Moeng, C. H., and Sullivan, P. P.: Large-eddy simulations of radiatively driven convection: Sensitivities to the representation of small scales, J. Atmos. Sci., 56, 3963–3984,
20
1999.
Thompson, A. M., Pickering, K. E., Dickerson, R. R., Ellis, W. G., Jacob, D. J., Scala, J. R., Tao, W. K., Mcnamara, D. P., and Simpson, J.: Convective transport over the central United-States and its role in regional CO and ozone budgets, J. Geophys. Res.-Atmos., 99, 18703–18711, 1994.
25
Vil `a-Guerau de Arellano, J., Kim, S.-W., Barth, M. C., and Patton, E. G.: Transport and chemical transformations influenced by shallow cumulus over land, Atmos. Chem. Phys., 5, 3219– 3231, doi:10.5194/acp-5-3219-2005, 2005.
Verzijlbergh, R. A., Jonker, H. J. J., Heus, T., and de Arellano, J. V. G.: Turbulent dispersion in cloud-topped boundary layers, Atmos Chem Phys, 9, 1289–1302,
doi:10.5194/acp-9-1289-30
ACPD
12, 11391–11413, 2012Vertical transport of pollutants by shallow
cumuli
G. Chen et al.
Title Page
Abstract Introduction
Conclusions References
Tables Figures
◭ ◮
◭ ◮
Back Close
Full Screen / Esc
Printer-friendly Version Interactive Discussion
Discussion
P
a
per
|
Dis
cussion
P
a
per
|
Discussion
P
a
per
|
Discussio
n
P
a
per
|
Wang, Y. G. and Geerts, B.: Humidity variations across the edge of trade wind cumuli: Observations and dynamical implications, Atmos Res, 97, 144–156, doi10.1016/j.atmosres.2010.03.017, 2010.
Wang, Y. G., Geerts, B., and French, J.: Dynamics of the cumulus cloud margin: An observa-tional study, J. Atmos. Sci., 66, 3660–3677, 2009.
5
Warren, S. G., Hahn, C. J., London, J., Chervine, R. M., and Jenne, R. L.: Global distribution of total cloud cover and cloud type amounts over land. NCAR Tech. Note NCAR/TN-273+STR, 29, 1986.
Warren, S. G., Hahn, C. J., London, J., Chervine, R. M., and Jenne, R. L.: Global distribu-tion of total cloud cover and cloud type amounts over ocean. NCAR Tech. Note
NCAR/TN-10
317+STR, 42, 1988.
Yin, Y., Carslaw, K. S., and Feingold, G.: Vertical transport and processing of aerosols in a mixed-phase convective cloud and the feedback on cloud development, Q. J. Roy. Meteor. Soc., 131, 221–245, 2005.
Zhao, M. and Austin, P. H.: Life cycle of numerically simulated shallow cumulus clouds. Part I:
15
Transport, J. Atmos. Sci., 62, 1269–1290, 2005a.
ACPD
12, 11391–11413, 2012Vertical transport of pollutants by shallow
cumuli
G. Chen et al.
Title Page
Abstract Introduction
Conclusions References
Tables Figures
◭ ◮
◭ ◮
Back Close
Full Screen / Esc
Printer-friendly Version Interactive Discussion
Discussion
P
a
per
|
Dis
cussion
P
a
per
|
Discussion
P
a
per
|
Discussio
n
P
a
per
|
Fig. 1.Sampled profiles of tracer mixing ratio for case 1 and its corresponding dry convective case at various moments. The black, red and blue lines represent profiles sampled over the whole domain, cloudy columns (liquid water path>10 g m−2), and cloud-free columns,
ACPD
12, 11391–11413, 2012Vertical transport of pollutants by shallow
cumuli
G. Chen et al.
Title Page
Abstract Introduction
Conclusions References
Tables Figures
◭ ◮
◭ ◮
Back Close
Full Screen / Esc
Printer-friendly Version Interactive Discussion
Discussion
P
a
per
|
Dis
cussion
P
a
per
|
Discussion
P
a
per
|
Discussio
n
P
a
per
|
Fig. 2.Sampled profiles of tracer vertical transport at 6 h and 12 h from case 1 and its corre-sponding dry convective case. To better illustrate the effect of clouds on the vertical transport, we concentrate on cloudy (liquid water mixing ratio>0.01 g kg−1) grids and cloud-free grids
here. The black, red, and blue solid lines represent profiles over the whole domain, cloudy grids, and cloud-free grids (liquid water mixing ratio<0.01 g kg−1
ACPD
12, 11391–11413, 2012Vertical transport of pollutants by shallow
cumuli
G. Chen et al.
Title Page
Abstract Introduction
Conclusions References
Tables Figures
◭ ◮
◭ ◮
Back Close
Full Screen / Esc
Printer-friendly Version Interactive Discussion
Discussion
P
a
per
|
Dis
cussion
P
a
per
|
Discussion
P
a
per
|
Discussio
n
P
a
per
|
Fig. 3.Snapshots of column integral tracer mass (a and b) and two selected vertical cross sections (c and d). In(a)and(b), the contours from dark to light indicate liquid water path with increasing values of 10, 50, 100, 300 and 500 g m−2
. It is shown that cloudy columns usually have higher tracer mixing ratio than cloud-free columns. In(c)and (d), the contours indicate liquid water mixing ratio with increasing values of 0.01, 0.1 and 1 g kg−1, and the arrows indicate
ACPD
12, 11391–11413, 2012Vertical transport of pollutants by shallow
cumuli
G. Chen et al.
Title Page
Abstract Introduction
Conclusions References
Tables Figures
◭ ◮
◭ ◮
Back Close
Full Screen / Esc
Printer-friendly Version Interactive Discussion
Discussion
P
a
per
|
Dis
cussion
P
a
per
|
Discussion
P
a
per
|
Discussio
n
P
a
per
|