Article
Printed in Brazil - ©2017 Sociedade Brasileira de Química 0103 - 5053 $6.00+0.00
*e-mail: [email protected]
Facile Synthesis Strategy to Create Mesoporous Magnetic Iron Oxides Using
Pectin-Based Precursors
Filipe Q. Mariani,a Mariane Dalpasquale,a Sérgio H. Toma,b Koiti Araki,b
Helton J. Alvesc and Fauze J. Anaissi*,a
aDepartamento de Química, Universidade Estadual do Centro-Oeste, 85040-080 Guarapuava-PR, Brazil
bInstituto de Química, Universidade de São Paulo, Av. Prof. Lineu Prestes 748, Butantã,
05508-000 São Paulo-SP, Brazil
cSetor Palotina, Universidade Federal do Paraná, 85950-000 Palotina-PR, Brazil
Magnetic iron oxides are of great scientific and technological relevance. Therefore, herein, we report the research on developing methodologies for their sustainable and reproducible preparation. We discuss the synthesis of iron oxides involving citrus pectin as a source of energy (42 MJ kg-1) to promote the formation of the magnetic phases. The method involved two simple steps: gelation of the pectin (80 °C, 4 h) with iron nitrate nonahydrate [Fe(NO3)3.9H2O], and calcination (600 °C, 1 h). X-ray diffraction indicated the major formation of hematite (α-Fe2O3) and ferrite phases. Microscopy images show materials with an average size below 50 nm. Textural properties indicated pore sizes of 7-30 nm while magnetic measurements indicated the formation of soft and hard oxides (coercivity between 90 and 400 Oe) and high magnetization saturation (50 emu g-1).
Keywords: pectin, iron oxides, ferrites, magnetic, cytotoxicity
Introduction
The methods for preparation of magnetic materials are constantly evolving, particularly those based on iron oxides known as ferrites, one of the most intensively studied class of materials in the field of applied magnetic sciences. The weakly ferromagnetic properties of hematite
(α-Fe2O3) at room temperature are different of those of the
ferrimagnetic iron ferrite (magnetite, FeO·Fe2O3), cobalt
ferrite (CoO·Fe2O3), and nickel ferrite (NiO·Fe2O3). On
the other hand, spinels such as magnetite and maghemite, which are structurally equal, related to substituted cobalt or nickel ferrites, usually present a more complex inverse spinel cation distribution, where only half of octahedral and only 1/8 of tetrahedral sites are filled (1/4 of octahedral positions are occupied by divalent ions while trivalent ions are located in 1/4 of octahedral and 1/8 of tetrahedral
sites).1-4
Spinel ferrites [M2+O·Fe
2O3, where M = Fe, Co, Ni, Cr,
Mn, etc.] have a broad range of applications, including hard
and soft magnetic materials.5,6 These metal oxides, unlike
alloys, present small Foucault’s current loss,7 thereby
favoring applications as recording heads, converters, catalysts, molecules carriers, pigments, and magnetic fluids,
among other applications.8-10 The most relevant among
them is magnetite. Several synthetic routes have been reported for magnetite in the literature leading to materials with distinct magnetic, structural, morphologic, crystallite size distribution, electrical, chemical and physical properties. Examples of some of those synthetic routes include chemical co-precipitation, sol-gel method, forced hydrolysis, hydrothermal method, mediated surfactant or
template synthesis, and biomimetic mineralization.11,12
Lately, because of the increasing environmental concerns, the development of fabrication processes with increasingly lower environmental impact, particularly on new materials, has received particular attention. Regarding the mediated nanostructured oxides, biopolymers is one of the most interesting topics, as far as the principles of green
chemistry are concerned.13 Among biopolymers, the one of
most interest is pectin taken into account its abundance and
low cost.14 Pectin is a polysaccharide constituting about
Pectins are mainly composed by D-galacturonic acid (GalA) units linked by 1,4-glycosidic bonds, and exhibit carboxylic acid groups throughout the chain, that can be used to bind transition metal ions (Scheme 1). Also, they have a high power of colloid formation by gelification; property that depends directly on the source and the degree of esterification. If a pectin has more than 60% of its carboxylic groups esterified with methyl groups, it is
characterized as being a high-methoxyl (HM) pectin,13,15
and has lower metal ion coordination capability.
The pectin chain folds approaching distant carboxylate groups creating chelating coordination sites, making them able to capture transition metal ions in aqueous solution. Pectins are extraordinarily stable in solution at temperatures from 10 to 80 °C and in a pH range of 2.5 to 4.0, making
them very useful in various fields of applied science.16,17
However, to the best of our knowledge, there is no report dealing with the use of pectin for the production of porous and nanostructured materials.
This paper describes a facile method,18 to prepare
mesoporous ferrite using citrus pectin to produce the gel precursor, which after calcination generates Fe-MIO,
Fe80Co20-MIO, and Fe80Ni20-MIO, where MIO stands for
magnetic iron oxide. The MIOs were duly characterized in order to check for the influence of their stoichiometry on the composition of the materials that exhibited unique magnetic, morphologic, and structural properties suggesting potential as pigments.
Experimental
Materials and reagents
The magnetic iron oxides (MIOs) were prepared by using the following commercially available reagents in analytical grade, purchased from Vetec Fine Chemicals and Sigma-Aldrich Company: iron(III) nitrate nonahydrate
[Fe(NO3)3·9H2O], cobalt(II) nitrate hexahydrate
[Co(NO3)2·6H2O], and nickel(II) nitrate hexahydrate
[Ni(NO3)2·6H2O]. The citrus pectin (PA grade) with
approximately 67.3% of its carboxylic groups esterified
by methoxyl groups,19 consisting of poly(galacturonic
acid) connected by 1,4-β-glucoside bonds. The minimum
formula is [C5H7O4(COOH)m-1(COOCH3)m]n, where
m refers to the degree of esterification as deduced from the
formula (14.02m + 176.13) and n is the average number of
repeating units.20 The pectin used in the experiments has
a molecular weight of about 185.57 g mol-1. All reagents
were used as received. The solutions were prepared using ultrapure water from a Quimis Model Q842 reverse-osmosis system.
Synthesis of the magnetic iron oxides (MIO)
Initially, a solution was prepared by adding 4.0 grams of citrus pectin in 200 mL of preheated water (60 °C) generating a 2% solution (m/m). Then, 20.79 g of iron nitrate dissolved in 20 mL of water were added under constant stirring and heating. The solution was kept at 80 °C for about 2 hours until the volume was reduced to its half. The gelation was then complete; the colloid was calcined in a muffle oven at 600 °C, leading to the formation of Fe-MIO. For the preparation of other ferrites, it was added an equal volume (20 mL) of ferric nitrate (20.79 g) plus cobalt nitrate (6.81 g) or nickel nitrate (6.82 g), leading to the formation of FeCo-MIO or FeNi-MIO, respectively.
The complexation of the transition metal ions is proposed to take place forming an egg-box-shaped
arrangement characteristic for HM-pectin,15 as shown in
Scheme 1. The relatively large chains with a high degree of esterification and relatively separated coordination sites is essential to the formation of homogeneous and translucent
gel precursors.21,22 These were dried, and the temperature
Scheme 1. Mesoporous iron oxides and ferrites based on calcination (600 °C) of citrus pectin gel precursors. Left: scheme showing the possible coordination
environment around transition-metal ions in citrus pectin with high methoxylation content (egg-box-shaped containment of the ions). Right: powder attracted by a permanent magnet (Nd2Fe14B). The predominant component of the reddish solid is hematite (α-Fe2O3) with magnetic profile due to mass
was increased up to 600 °C in a furnace using a heating
ramp of 10 °C min-1 generating a soft and easily pulverized
solid labeled “puff” after combustion. The very fast reaction and associated high temperatures concomitantly with the
gas release (CO, CO2, and water vapor) are responsible
for controlling the degree of crystallinity and morphology of the resultant materials. The magnetic monometallic (Fe-MIO) and bimetallic (FeCo-MIO and FeNi-MIO) were prepared using the above-described procedure involving a coordination/gelation step followed by calcination.
Characterization
X-ray diffraction (XRD) was performed on a Bruker D2 Phaser diffractometer equipped with a copper cathode
(Cu Kα, λ = 1.541838 Å), operating at 30 kV and 10 mA,
using a working window of 2° to 90° (2θ) and at a scanning
rate of 0.2° s-1. The collected data were numerically treated
using the EVA software (Bruker version 1.1) and the diffraction peaks indexed according to ICDD-PDF2-2009 cards. The thermal behavior was recorded in a Seiko Model 6300 simultaneous thermal analyzer (STA). The samples were heated in aluminum pans from 30 to 1200 °C, using
a heating rate of 20 °C min-1 in compressed-air atmosphere
(0.2 L min-1). Scanning electron microscopy (SEM) images
were registered in a JEOL FEG-JSM-7401F equipment. The specific area, average pore size, and pore volume was determined by nitrogen adsorption. The adsorption/ desorption isotherms were recorded at liquid nitrogen temperature (77 K) using a Quantachrome Nova 2000e equipment and samples pre-treated at 180 °C under vacuum. The specific area was determined using the
Brunauer-Emmett-Teller (BET) method with p/p0≤ 0.3.
The pore volume and pore diameter were determined by the Barrett-Joyner-Halenda (BJH) adsorption method.
The near-infrared (NIR) spectra were obtained in a fiber optic spectroradiometer model Fieldspec 3 from Analytical Spectral Devices. The average of twenty spectra was recorded in the range of 900-2500 nm to improve
the signal to noise ratio, resolution of 1 cm-1. The Raman
spectra were recorded using a confocal Raman microscope (Witec Alpha 300R), using a 532 nm laser (power was set to
0.2 mW cm-2) and a 100× objective. Electronic spectra were
obtained using an Ocean Optics spectrophotometer (Model USB 2000), equipped with a tungsten-halogen lamp (UV-Vis, 350-720 nm) connected to a fiber-optic probe operating in diffuse reflectance mode. From the electronic spectra, the
energy band gap (EBG) was calculated by Tauc method;
the spectra were converted using reflection R in absorption
coefficient with Kubelka-Munk equation (
2
1 2
R f R
R
).
Graphs were plotted in (f(R) × hν)n as a function of
energy (hν) and EBG calculated by linear regression.18
The electronic paramagnetic resonance (EPR) were obtained with a Bruker equipment, model EMX operating frequency of ca. 9.5 GHz (X-band) with frequency modulation of 100 kHz, amplitude modulation of 8 kG and microwave power of 20 MW. Magnetic properties were measured with a vibrating sample magnetometer (VSM), with maximum applied field of 20 kOe. In both cases (EPR and VSM), powder samples were placed in capillary tubes parallel to the field, and the measurements were performed at 300 K.
In vitro, cytotoxic effects were evaluated using
erythrocytes from healthy volunteers. Blood samples were collected in heparin, centrifuged, and the plasma and leukocytes removed by aspiration. The erythrocytes were then suspended in 10 mM sodium phosphate buffer (pH = 7.4) and incubated with 1, 5, and 10 mg of MIO for 4 and 24 hours at 37 °C in a shaker. Subsequently, the suspensions were centrifuged, and the amount of hemoglobin released into the supernatant due to hemolysis was determined spectrophotometrically. The measurements were carried out at 540 nm in a Max 190 Molecular Devices Spectra UV-Vis spectrophotometer.
Results and Discussion
The novel synthetic route to create mesoporous iron oxides (in this text, referred to as magnetic iron oxides, MIOs) resulted from a combination of citrus pectin and transition metal ions nitrates followed by a gelation process (80 °C) and subsequent calcination (600 °C). The homogeneous gel associated with its high organic and energy content favored the formation of porous oxides, but without extensive nanoparticles sintering. Thus, the products were obtained as finely divided powders, without needing further processing in a mortar or mill, after the calcination in the muffle furnace. Similar methods of
preparation are found in the literature.19 However, they
involve a greater number of reagents (i.e., oxidizing or reducing agents, binders, organic solvents, polymerizing agents) and require special handling conditions (i.e., controlled atmosphere and humidity) or a greater number of steps (i.e., mixing, heating, volume reduction, grinding,
sieving).23-25 This pectin-induced method is a much simpler
and inexpensive alternative, which adds value to the organic residues from the fruit pulp industry.
Structural and thermal properties
corresponding to iron oxides. Fe-MIO (Figure 1a) was indexed as a mixture of phases according to ICDD cards to hematite (PDF 00-033-0664) and magnetite (PDF 01-071-6336). The hematite is characterized by
two reflection peaks at 2θ 24° (012) and 33°(104) in
a rhombo.H.axes unit cell with the lattice parameters
a = 5.0356 Å (167), c = 13.7489 Å pointing to R-3c space
group. On the other hand, magnetite is characterized by a
reflection at 2θ 36° (311) in a cubic unit cell with the lattice
parameters a = 8.3778 Å (227) of the Fd-3m space group.
From the characteristic peaks, it was estimated a mass ratio hematite:magnetite of 14:1, which is sufficient to explain the magnetic behavior of the Fe-MIO.
The Fe0.8Co0.2-MIO (Figure 1b) was identified and
indexed as cobalt ferrite (PDF card No. 01-070-8729) in
a cubic unit cell with the lattice parameters a = 8.4030 Å
(227) of the Fd-3m space group. The Fe0.8Ni0.2-MIO
(Figure 1c) was identified and indexed as nickel ferrite (PDF card No. 01-070-8730) in a cubic unit cell with the
lattice parameters a = 8.3420 Å (227) also of the Fd-3m
space group. For the two ferrites (cobalt and nickel) prevail
intense peaks at 2θ 35.4° (311), 30° (220); while the peaks at
57° (511) and 62.5° (440) are more intense than for Fe-MIO. From indexing the phases, it is possible to identify the degree of crystallinity and mean coherence length (MCL) by the Scherrer equation and full-width at half-maximum (FWHM)
parameters.25 The Fe-MIO has higher crystallinity (84%)
followed by cobalt ferrite (21 nm) whereas nickel ferrites (16 nm) exhibited the lowest MCL and degree of crystallinity (77%). The degrees of crystallinity for the MIO’s decreased when a second metal ion was added as expected for the higher complexity and the longer time for the components to diffuse and crystallize. This difference in crystallinity also can be associated with the formation of smaller crystallites during
the inhomogeneous calcination process.26
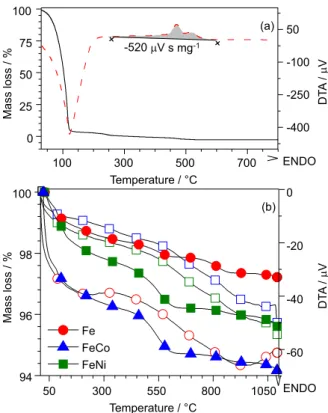
The energy supplied by combustion of pectin during
MIO preparation was estimated in 42 MJ kg-1 by integration
of the exothermic peaks in the differential DTA curve (gray area in Figure 2a).
The three MIOs have similar thermal behavior (Figure 2b) as characterized by three distinct events
(a) (b) (c)
10 20 30 40 50 60 70
0 3k 5k 0 3k 5k 0 3k 5k
2 / degrees
Counts / a.u.
PDF-01-071-6336 - Magnetite PDF-00-033-0664 - Hematite
PDF-01-079-1744 - (CoFe )O2 4
PDF-01-0708730 - (NiFe )O2 4
Figure 1. Powder XRD patterns for (a) Fe-MIO containing the α-Fe2O3
(hematite) as the major phase. The dominant phases for the (b) cobalt and (c) nickel ferrites are marked.
100 300 500 700
0 25 50 75 100
(a)
(b)
Fe FeCo FeNi
50 300 550 800 1050
94 96 98 100
Temperature / °C
-400 -250 -100 50 +
+ -520 V s mg
-1
ENDO
ENDO -60 -40 -20 0
DT
A
/
V
DT
A
/
V
Temperature / °C
Mass loss / %
Mass loss / %
Figure 2. Thermal behavior of (a) pectin gel used as a reference for
determination of combustion energy (fuel) and (b) MIOs show similar behavior for both, dehydration and loss of the residual organic material. All thermal curves were performed in a dynamic air atmosphere at 10 °C min-1.
(a) (b) (c)
10 20 30 40 50 60 70
0 3k 5k 0 3k 5k 0 3k 5k
2 / degrees
Counts / a.u.
PDF-01-071-6336 - Magnetite PDF-00-033-0664 - Hematite
PDF-01-079-1744 - (CoFe )O2 4
PDF-01-0708730 - (NiFe )O2 4
100 300 500 700
0 25 50 75 100
(a)
(b)
Fe FeCo FeNi
50 300 550 800 1050
94 96 98 100
Temperature / °C
-400 -250 -100 50 +
+ -520 V s mg
-1
ENDO
ENDO -60 -40 -20 0
DT
A
/
V
DT
A
/
V
Temperature / °C
Mass loss / %
(mass loss), associated with exothermic processes or phase transitions (DTA), and a total weight loss ranging from 2.8 to 5.8%, depending on the transition metal ion.
The first event was attributed to dehydration, with the mass variation calculated from the initial (30 °C) and
final (300 °C) temperatures (Toffset = 150 °C). The second
event (Toffset = 400 °C) was due to thermal decomposition
or combustion of residual organic material; the third event (Toffset = 915 °C) was typical of a phase transition. The
Fe-MIO showed the lowest amount of residual organic material (1%), reinforcing the conclusions drawn from the respective XRD, which indicated a higher degree of crystallinity. The cobalt and nickel ferrites were found to contain only about 2% organic impurities, wich may be responsible for lowering the degree of crystallinity. Noteworthy was the absence of thermal events (DTA curve) that can be associated with a mixture of phases.
Textural and morphological properties
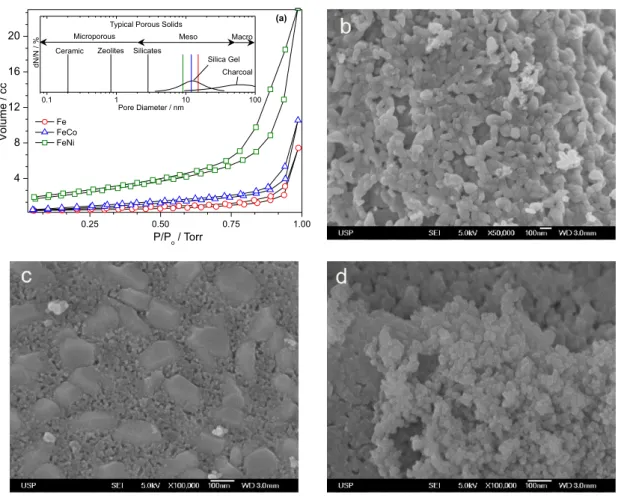
The MIO’s surface area was analyzed by nitrogen physisorption. The results of BET curves are consistent with type-IV adsorption and desorption hysteresis in the 0 to 1 torr range, typical of mesoporous materials (Figure 3a).
Fe FeCo FeNi
0.25 0.50 0.75 1.00
4 8 12 16 20
V
o
lu
m
e
/
c
c
P/P o/ Torr
0.1 1 10 100
Macro
Silicates Zeolites Ceramic
Microporous Meso
Charcoal Silica Gel
d
N
/N
/
%
Pore Diameter / nm
Typical Porous Solids (a)
Figure 3. (a) BET-surface-area analysis showing the typical profiles of mesoporous materials. SEM images of (b) Fe-MIO; (c) FeCo-MIO and (d) FeNi-MIO.
The pore sizes were calculated using the BJH method with distribution in the 7 to 30 nm. Surface area measurements by BET can be used to estimate the relative humidity and
also to understand the porous nature.26 Fe-MIO was found
to have a higher pore size (15.1 nm) and smaller relative humidity (1.06%) than other ferrites. For cobalt ferrite, pore size was estimated to be 12.9 nm involving 1.6% relative humidity, whereas the pore size of nickel ferrite was estimated to be 9.1 nm and 3.2% relative humidity. Those pore size values are larger than for zeolites and silicates
used in heterogeneous catalysis,26 but analogous to that
found in silica gel,27 as shown in Figure 3a.
The size and shape of the particles or agglomerates
can lead to different properties of each material,28 as in
the case of MIO which morphology and particle size are different. SEM image of the Fe-MIO (Figure 3b) shows
agglomerates in the form of typical ellipsoids of α-Fe2O3
phase, with particle sizes ranging from 30 to 100 nm. These characteristics are similar to those reported in the scientific literature for nanosized mesoporous materials containing
iron oxide.28 SEM image of the FeCo-MIO (Figure 3c)
shows agglomerates of 60 to 200 nm and particles smaller than 20 nm, formed by the phase identified by XRD as being cobalt ferrite (Figure 1b). From SEM images of the
Fe FeCo FeNi
0.25 0.50 0.75 1.00
4 8 12 16 20
V
o
lu
m
e
/
c
c
P/P o/ Torr
0.1 1 10 100
Macro
Silicates Zeolites Ceramic
Microporous Meso
Charcoal Silica Gel
d
N
/N
/
%
Pore Diameter / nm
FeNi-MIO (Figure 3d), the particles have polyhedral shapes and a particle size between 10 and 100 nm. In general, the MIO’s obtained with average sizes lower than 50 nm, can be classified as nanomaterials or as nanometric materials.
Spectroscopic behavior
Electronic and vibrational spectroscopies are relevant to the phenomena involved in atomic and molecular interactions as well as in charge transfer processes. The Fe-MIO and ferrites spectra in the NIR region showed a
characteristic low-intensity band at 1950 nm (5130 cm-1),
attributed to water O–H bond stretching mode (Figure 4a).29
Also of significance is the absence of sharp bands that are
characteristic of C–C and C−H bonds in the 1000-1700 cm-1
range and eventual M−C and M−N bonds in the region
below 1000 cm-1, suggesting that only little amounts of
organic material are left over in the ceramic materials after
calcination at 600 °C.30
In fact, the Fe-MIO Raman spectrum is similar to that
of a material with predominant hematite phase (D6) with
seven well-defined active phonons: two A1g modes (225 and
500 cm-1) and five E
g modes (a shoulder at 248 cm-1, two
overlapping bands at 293 and 299 cm-1, and two bands at
410 and 611 cm-1). There was still a low-intensity band at
1320 cm-1 attributed to the formation of a magnon due to
the presence of nearby antiparallel spins in hematite. The
additional broad, low-intensity bands at 670 and 512 cm-1
have been assigned to magnetite (present in small amounts)
phonons with A1g and F2gsymmetry, respectively.29,31
The Raman spectra of ferrites FeCo-MIO and FeNi-MIO were very similar and showed five active
phonons around 200 and 300 cm-1, assignable to the T (F
2g)
and v2 (Eg) modes, respectively. They also had further
vibrational modes at 475, 600, and 700 cm-1 assigned to
v4 (F2g), v3 (F2g), and v1 (A1g) modes, respectively.32 The
iron ferrites showed a magnon band at 1350 cm-1, associated
with the collective spin movement.33 All active vibrational
Figure 4. Spectra of (a) NIR with absorbance between 0 < abs < 1; (b) Raman obtained with a blue laser (473 nm); (c) the UV-Vis absorbance mode, and (d), (e) and (f) direct optical-gap calculations using the TAUC method.
300 600 900 1200
1.5 2.0 2.5 3.0 3.5
1.5 2.0 2.5 3.0 3.5
(f)
(e) (d)
(a) (b)
2200 2000 1600 1200 1500 1300 1100 900 700 500 300 100
Fe FeCo FeNi
Wavelength / nm
U V -V is A b s o rb a n c e / a .u .
y = 0.00112h.- 0.0019 R2=0.99686
1.83 eV
y = 0.00587h.- 0.0107 R2
=0.99955
y = 0.00112h.- 0.0012 R2 =0.99645 1.73 eV (f (R ). h . 2 / a .u . h eV
1.59 e V (c) N IR A b s o rb a n c e / a .u . Fe FeCo FeNi
Wavelength / nm
R a m a n In te n s it y / a .u . 2 0 0 3 3 0 4 7 5 6 0 0 7 0 0 # # # # 2 2 7 2 9 3 4 1 0 5 0 0
Raman Shift / cm-1
1
3
2
0
#
300 600 900 1200
1.5 2.0 2.5 3.0 3.5
1.5 2.0 2.5 3.0 3.5
(f)
(e) (d)
(a) (b)
2200 2000 1600 1200 1500 1300 1100 900 700 500 300 100
Fe FeCo FeNi
Wavelength / nm
U V -V is A b s o rb a n c e / a .u .
y = 0.00112h.- 0.0019 R2=0.99686
1.83
eV
y = 0.00587h.- 0.0107 R2
=0.99955
y = 0.00112h.- 0.0012 R2 =0.99645 1.73 eV (f (R ). h . 2 / a .u . h eV
1.59 e V (c) N IR A b s o rb a n c e / a .u . Fe FeCo FeNi
Wavelength / nm
R a m a n In te n s it y / a .u . 2 0 0 3 3 0 4 7 5 6 0 0 7 0 0 # # # # 2 2 7 2 9 3 4 1 0 5 0 0
Raman Shift / cm-1
1
3
2
0
modes of the binary oxides were characteristic of crystalline
materials belonging to the cubic group.34
Figure 4c shows the UV-Vis spectrum of MIOs. The absorption spectrum of Fe-MIO (Figure 4c, circle line)
shows two bands at 550 and 660 nm, typical of α-Fe2O3.
The transition type 6A1d-d > 4T2 (4G) occurred between
400 and 600 nm, and is consistent with the first band centered at 550 nm. The ligand-to-metal transition and the pair resulting from the interaction between the two metal centers (Fe-Co or Fe-Ni) occurred in the region between
600 and 750 nm, attributed to 6A1 > 4T2 (4G), as observed
at 660 nm. The small amount of magnetite identified by XRD was not enough to change the hematite electronic spectrum significantly.
The d-d transitions allow calculating the band-gap
energy in the UV-Vis absorption spectrum for hematite and magnetite. Thus, mathematical tools must assist the interpretation of data. For instance, the Tauc method can be used to determine the energy of the band gap transitions
(photoelectric energy) (Figures 4d, 4e, 4f).35 Typically E
BG
values of pure hematite are found in the 2.14 to 2.22 eV range (580-558 nm), but for mixed phase materials, the
value might be lower.36 In fact, the E
BG for the hematite-rich
sample with 6.7% of magnetite, as determined by XRD analysis, was found to be 1.83 eV, as shown in Figure 4d. The similar tendency was observed for the nickel-ferrite spectrum (Figure 4f) that exhibited two absorption bands
at 550 and 650 nm, and the respective EBG was evaluated as
1.59 eV. Cobalt ferrite (Figure 4e) showed a band at 715 nm
(1.73 eV) indicating a higher effect of Co2+ than Ni2+ in
decreasing the band-gap energy, probably due to an inverse
spinel structure where Co3+ ions can occupy tetrahedral
sites. In fact, the EBG value of 1.73 eV is in agreement with
the value reported in the literature (EBG = 1.70 eV) for the
4A2 to 4T1 (P) transition, typical of Co3+ ions in tetrahedral
sites, thus reinforcing that hypothesis.35
Magnetic properties
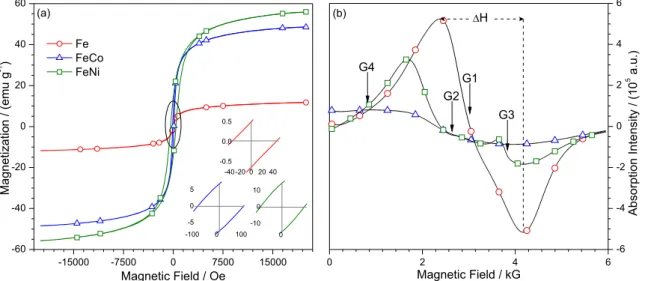
The isothermal behavior of the magnetization under applied magnetic field was determined from VSM measurements at room temperature and 20 kOe range. Figure 5a shows magnetic hysteresis loops in the plot of magnetization as a function of the applied field. Parameters
such as saturation magnetization Ms (maximum magnetization
value), remanent magnetization Mr (magnetization at zero
field), coercivity Hc (necessary magnetic field to reduce the
magnetization to zero), and quadrature rate (Ms/Mr), were
determined from the magnetic hysteresis curve. All those parameters indicated that the Fe-MIO has small remanent magnetization, characteristic of soft magnetic materials.
The Fe-MIO exhibited low coercivity (40 Oe) and low saturation magnetization, characteristic of
non pure hematite (10 emu g-1).37 On the other hand;
FeCo-MIO showed higher coercivity (93 Oe) and saturation
magnetization (50 emu g-1), but lower than that found
for FeNi-MIO (400 Oe and 60 emu g-1, respectively).
The saturation magnetization is intrinsically dependent on the type of material, the average number of magnetic
domains per grain and thus on crystallites size.38 In the
case of ferrites, the magnetization is mainly due to the
spins associated with Fe2+ in octahedral sites whose
magnetic moment is not canceled out by coupling with
Fe3+ spins in tetrahedral sites. Hematite has a low saturation
magnetization as compared with cobalt and nickel ferrites such that the measured magnetization probably is due to
(b) (a)
-15000 -7500 0 7500 15000
-60 -40 -20 0 20 40 60
0 2 4 6
-6 -4 -2 0 2 4 6
M
a
g
n
e
ti
z
a
ti
o
n
/
(emu
g
-1 )
Magnetic Field / Oe Fe
FeCo FeNi
-40 -20 0 20 40 -0.5
0.0 0.5
-100 0 100
-5 0 5
0 -10
0 10
G1
Absorption
In
te
n
s
it
y
/
(1
0
5 a
.u
.)
Magnetic Field / kG
H
G2
G3 G4
Figure 5. (a) Typical magnetic conduct of soft ferromagnetic materials (Fe-MIO) with small remanent magnetization. The inset shows the maximum
remaining magnetization; (b) the EPR spectra show the typical resonant conduct of paramagnetic materials; the curve shows symmetry (circles), and the G1-G4 points are the inflections used to determine g factor of each oxide.
(b) (a)
-15000 -7500 0 7500 15000
-60 -40 -20 0 20 40 60
0 2 4 6
-6 -4 -2 0 2 4 6
M
a
g
n
e
ti
z
a
ti
o
n
/
(emu
g
-1 )
Magnetic Field / Oe Fe
FeCo FeNi
-40 -20 0 20 40 -0.5
0.0 0.5
-100 0 100
-5 0 5
0 -10
0 10
G1
Absorption
In
te
n
s
it
y
/
(1
0
5 a
.u
.)
Magnetic Field / kG
H
G2
the presence of magnetite (6.7%). The Hc of hematite, with
particle sizes between 0.01 and 20 µm, was 30 to 400 Oe, but can decrease to 2.5 Oe in mixed ferrites presenting a
typical antiferromagnetic hysteresis loop.39
The magnetization curve of Fe-MIO resembles that of superparamagnetic materials at room temperature,
as expected for α-Fe2O3 nanoparticles and magnetite
nanoparticles.40 In this case, the magnetic dipoles of
magnetite would not influence the orientation of hematite
spins in the crystalline network.41 Table 1 summarizes the
structural, morphological and magnetic properties of iron oxide and ferrites.
Magnetic properties can be calculated from the respective EPR spectrum shown in Figure 5b. It features a pattern of two lines at room temperature (300 K), and the
Fe-MIO (Figure 5b, circle) shows a paramagnetic profile.42
For α-Fe2O3 (Figure 5b, G1) is expected to exhibit a strong
resonance band (∆H = 1800 G), indicating magnetic
anisotropy as well as geffective factor of 2.10. This parameter,
determined from hv/bH, evidences a strong interaction
between Fe3+ ions in Fe
2O3, as its g factor was equivalent
to that of a free electron. For all the spectra, the extension of the bands indicated greater magnetic anisotropy (Ma), following the trend Fe-MIO < FeNi-MIO < FeCo-MIO, in agreement with the values from the VSM data (Table 1).
The g factor of approximately 2.1 also indicated that
M2+ was substituted in the ferrites (MO·Fe
2O3), as shown
in the EPR spectrum of ferrites (Figure 5b, square and triangle lines). The iron oxides characteristic spectra consist of a single line with a width ranging from 700 to 6000 G and a g factor with values between 2.00 and 10.00, depending on the composition of the sample. The
presence of spin coupled Fe2+ and Fe3+ ions in octahedral
sites (ferromagnetic phase) is readily identified in the X-ray diffraction pattern, but cannot be distinguished in the EPR spectrum at room temperature, maybe due to the relatively small crystal field splitting and superimposition of the energy levels or experimental resolution reflecting on signal broadening generating an envelope extending over the spin rotation network. Both events would preclude the
observation of the Fe2+ resonance frequency, whose peak
should appear at lower temperatures. Fe3+ is an ion with
3d5 configuration giving an effective spin of 5/2 or 1/2
depending on the ligand field.
The low field ground state (6S5/2) with no orbital angular
momentum and spin degeneracy of six times should result in extremely low spin interactions in the crystal field, and the g values are very close to those expected for the free
electron spin.43,44 The band broadening and shifting of the
g factor can be assigned to the higher anisotropy of the material. The same happened for ferrites samples since the samples that showed fewer crystalline phases were those with larger anisotropies in their EPR spectra.
Analysis of cytotoxicity
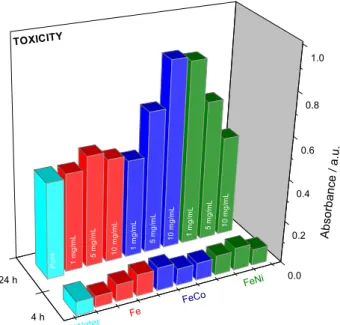
Finally, toxicity tests are necessary when evaluating new materials or compounds that can be applied in many technological fields such as pigments, catalysts, and carriers
of medical drugs.12 In applications such as these, the use
of nontoxic materials is generally of supreme importance. Thus, an hemolysis assay was performed to give a preliminary indication of their cytotoxicity, and the results are shown in Figure 6. According to the data, none of the
Table 1. Structural (XRD), magnetic (VSM) and morphological (BET and SEM) parameters of magnetic iron oxides (MIO)
MIO sample XRD VSM
∆Hc / Oe
BET Pore size / nm
SEM Particle size / nm Space group Crystallite size / nm Cristallinity / %
Fe Fd-3m (227) 41.0 84.1 40 15.1 65
FeCo R-3m (166) 21.0 77.0 93 12.9 90 or 10
FeNi Fd-3m (227) 16.3 76.3 400 9.1 18
4 h
24 h 0.0
0.2 0.4 0.6 0.8 1.0 P u re 1 0 m g /m L 5 m g /m L Water FeNi Fe Ab so rba nc e/ a.u . FeCo 1 m g /m L 1 m g /m L 5 m g /m L 1 0 m g /m L 1m g /m L 5m g /m L 1 0 mg /m L TOXICITY
Figure 6. Cytotoxicity analysis of MIOs in which the maximum value recommended for nontoxic samples is an absorbance of 1.0 a.u.
4 h
24 h 0.0
oxides reached the recommended limits in arbitrary units (1.0 a.u.). This analysis pointed to potential applications as carriers of drugs, as contrast materials for magnetic resonance measurements, and as miscible ferrofluids in
both aqueous and nonpolar media.42
Conclusions
The method involved two steps (gelation and calcination) and proved feasible in preparing magnetic iron oxides with intrinsic properties determined by the nature of the transition
metal ions involved (Fe2+, Fe3+, Co2+, Co3+, Ni2+, etc.). SEM
images and BET analysis show the formation of mesoporous materials with nanometric dimensions obtained by a singular synthesis route. The low magnetic properties of Fe-MIO is consistent with the fact that is largely constituted by hematite with less than 10% of magnetite. The difference between the magnetic properties and the degree of toxicity within the recommended limits put the MIOs a potential candidates for development of materials for application in the medical area as fluid or iron for image contrast.
Acknowledgments
The authors would like to thank the Capes Agency (No. 028/2009 and 063/2010), CNPq (Scholarship Researcher No. 305447/2013-0 and Grant No. 447902/2014-8), FINEP (No. 01.09.0393.00 and 01.12.0471.00), and Fundação Araucária. F. Q. Mariani and M. Dalpasquale thank the PhD scholarships granted by DS-CAPES. Thanks also go to C. A. Schwengber and UFPR/Palotina for BET analysis; to N. M. Khalil, Unicentro/Guarapuava, for cytotoxicity analysis; to IFUSP, for VSM curves, and to A. G. Mascarenhas for language support.
References
1. Wu, W.; Wu, Z.; Yu, T.; Jiang, C.; Kim, W.-S.; Sci. Technol.
Adv. Mater.2015, 16, 023501.
2. Oliveira, L. C. A.; Fabris, J. D.; Pereira, M. C.; Quim. Nova
2013, 36, 123.
3. Cabo, M.; Pellicer, E.; Rossinyol, E.; Estrader, M.; López-Ortega, A.; Nogués, J.; Castell, O.; Suriñach, S.; Baró, M. D.;
J. Mater. Chem.2010, 20, 7021.
4. Pellicer, E.; Cabo, M.; López-Ortega, A.; Estrader, M.; Yedra, L.; Estradé, S.; Peiró, F.; Saghi, Z.; Midgley, P.; Rossinyol, E.; Golosovsky, I. V.; Mayoral, A.; Prades, J. D.; Suriñach, S.; Baró, M. D.; Sort, J.; Nogués, J.; Nanoscale2013, 5, 5561.
5. Primc, D.; Makovec, D.; Nanoscale2015, 7, 2688.
6. Homonnay, Z.; Vértes, A.; Mössbauer Spectroscopy of
Sophisticated Oxides; Akadémiai Kiadó: Budapeste, 1997.
7. Walker, E.; Breen, M.; Apblett, A.; Chem. Mater.1998, 4756, 1265.
8. Shin, J.; Lee, K. Y.; Yeo, T.; Choi, W.; Sci. Rep.2016, 6, 21792. 9. Campos, E. A.; Stockler Pinto, D. V. B.; de Oliveira, J. I. S.;
Mattos, E. D. C.; Dutra, R. D. C. L.; J. Aerosp. Technol. Manage.
2015, 7, 267.
10. Han, L.; Meng, H.; Wang, J.; Hu, Y.; Bao, W.; Chang, L.; Wang,
H.; Ind. Eng. Chem. Res.2016, 55, 5100.
11. Tan, Y.; Zhuang, Z.; Peng, Q.; Li, Y.; Chem. Mater.2008, 5029.
12. Müller, M.; Villalba, J. C.; Mariani, F. Q.; Dalpasquale, M.; Lemos, M. Z.; Gonzalez Huila, M. F.; Anaissi, F. J.; Dyes Pigm.
2015, 120, 271.
13. Huang, C.; Zhang, H.; Sun, Z.; Liu, Z.; Sci. China Chem.2010,
53, 1502.
14. Dalpasquale, M.; Mariani, F. Q.; Müller, M.; Anaissi, F. J.; Dyes
Pigm.2016, 125, 124.
15. http://www.omicsonline.org/scientific-reports/srep550.php, accessed in October 2016.
16. Darder, M.; López-Blanco, M.; Aranda, P.; Leroux, F.; Ruiz-Hitzky, E.; Chem. Mater.2005, 17, 1969.
17. Winkleman, A.; Bracher, P. J.; Gitlin, I.; Whitesides, G. M.;
Chem. Mater.2007, 19, 1362.
18. Santana, G. P.; Ramos, A. M.; Fabris, J. D.; Quim. Nova2008,
31, 430.
19. Locatelli, G.; da Silva, G. D.; Finkler, L.; Finkler, C. L. L.;
Biotechnology2012, 11, 29.
20. Ur’yash, V. F.; Gruzdeva, A. E.; Kokurina, N. Y. Y.; Grishatova, N. V.; Faminskaya, L. A.; Polym. Sci., Ser. A2007, 49, 1020. 21. Sarkar, S.; Guibal, E.; Quignard, F.; SenGupta, A. K.;
J. Nanopart. Res.2012, 14, 715.
22. Luque, R.; Varma, R. S.; Sustainable Preparation of Metal
Nanoparticles: Methods and Applications; Luque, R.; Varma,
R. S., eds.; Royal Society of Chemistry: Cambridge, 2012, p. 230.
23. Andrade, Â.; Fabris, J.; Domingues, R.; Pereira, M.; Curr.
Pharm. Des.2015, 21, 5417.
24. Andrade, Â. L.; Valente, M. A.; Ferreira, J. M. F.; Fabris, J. D.;
J. Magn. Magn. Mater.2012, 324, 1753.
25. Paiva, D. L.; Andrade, A. L.; Pereira, M. C.; Fabris, J. D.; Domingues, R. Z.; Alvarenga, M. E.; Hyperfine Interact.2015,
232, 19.
26. Guo, L.; Arafune, H.; Teramae, N.; Langmuir2013, 29, 4404.
27. Paterson, E.; Clay Miner.1999, 34, 209.
28. Sayed, F. N.; Polshettiwar, V.; Sci. Rep.2015, 5, 9733.
29. Jacintho, G. V. M.; Brolo, A. G.; Corio, P.; Suarez, P. A. Z.; Rubim, J. C.; J. Phys. Chem. C2009, 4, 7684.
30. Wang, Z.; Liu, X.; Lv, M.; Chai, P.; Liu, Y.; Meng, J.; J. Phys.
Chem. B2008, 4, 11292.
32. Tong, L.; Ramser, K.; Kall, M. In Raman Spectroscopy for
Nanomaterials Characterization; Kumar, C. S. S. R., ed.;
Springer Berlin Heidelberg: Berlin, Heidelberg, 2012, p. 507. 33. de Faria, D. L. A.; Silva, S. V.; de Oliveira, M. T.; J. Raman
Spectrosc.1997, 28, 873.
34. Himcinschi, C.; Vrejoiu, I.; Salvan, G.; Fronk, M.; Talkenberger, A.; Zahn, D. R. T.; Rafaja, D.; Kortus, J.; J. Appl. Phys.2013,
113, 084101.
35. Gilbert, B.; Frandsen, C.; Maxey, E.; Sherman, D.; Phys. Rev. B2009, 79, 035108.
36. Sherman, D. M.; Waite, T. D.; Am. Mineral.1985, 70, 1262. 37. Martinez, A. I.; Garcia-Lobato, M. A.; Perry, D. L. In Research
in Nanotechnology Developments; Barrañón, A., ed.; Nova
Science Publishers, Inc.: New York, 2009, ch. 17, p. 183. 38. Han, D. H.; Wang, J. P.; Luo, H. L.; J. Magn. Magn. Mater.
1994, 136, 176.
39. Itoh, H.; Sugimoto, T.; J. Colloid Interface Sci.2003, 265, 283. 40. Yang, Y.; Yi, J. B.; Huang, X. L.; Xue, J. M.; Ding, J.; IEEE
Trans. Magn.2011, 47, 3340.
41. Krajewski, M.; Malolepszy, A.; Stobinski, L.; Lewinska, S.; Slawska-Waniewska, A.; Tokarczyk, M.; Kowalski, G.; Borysiuk, J.; Wasik, D.; J. Supercond. Novel Magn.2014, 4. 42. Cotica, L. F.; Freitas, V. F.; Silva, D. M.; Honjoya, K. K.;
Honjoya, K. K.; Santos, I. A.; Fontanive, V. C. P.; Khalil, N. M.; Mainardes, R. M.; Kioshima, E. S.; Guo, R.; Bhalla, A. S.;
J. Nano Res.2014, 28, 131.
43. Koksharov, Y. A.; Pankratov, D. A.; Gubin, S. P.; Kosobudsky, I. D.; Beltran, M.; Khodorkovsky, Y.; Tishin, A. M.; J. Appl.
Phys.2001, 89, 2293.
44. Cao, X.; Gu, L.; Nanotechnology2005, 16, 180.
Submitted: July 3, 2016
Published online: November 3, 2016