Ar
ti
cle
0103 - 5053 $6.00+0.00
*e-mail: [email protected]
Multiresidue Determination of Pesticides in Carrots using Pressurized Liquid
Extraction and Gas Chromatography with Mass Spectrometry Detector
Fernanda C. Abad, Priscila R. Winck, Juliana M. da Silva, Elina B. Caramão and Cláudia A. Zini*
Instituto de Química, Universidade Federal do Rio Grande do Sul, Av. Bento Gonçalves, 9500, 91501-970 Porto Alegre-RS, Brazil
Neste estudo, 14 agrotóxicos (captan, clorotalonil, deltametrina, dicloran, fention, folpete, iprodiona, linurom, malationa, prometrina, procloraz, procimidona, triclorfom e triluralina) foram usados no desenvolvimento de um método multiresíduos (MRM), utilizando extração de cenouras com líquido pressurizado (PLE). A etapa de clean-up foi realizada por dispersão da matriz em fase sólida (MSPD), sendo testados como material dispersante o Florisil, XAD-4, XAD-7 e C18. Diclorometano, acetato de etila e acetona foram empregados como solventes para PLE, a 75 ºC e 1.500 psi. As recuperações dos analitos para cenouras lioilizadas icaram na faixa de 70 a 133%. Entretanto, os percentuais de recuperação obtidos para as cenouras úmidas não foram satisfatórios (< 70%). Os coeicientes de determinação das curvas analíticas situaram-se na faixa de 0,9821 a 0,9997; os limites de detecção (LOD) e de quantiicação (LOQ) para os vários compostos investigados icaram entre 0,0024-0,1968 mg kg-1 e entre 0,0072-0,5963 mg kg-1, respectivamente.
In this study, 14 pesticides (captan, chlorothalonil, deltamethrin, dicloran, fenthion, folpet, iprodione, linuron, malathion, prometryn, prochloraz, procymidone, trichlorphon and triluralin) were employed for developing a multiresidue method (MRM) using pressurized liquid extraction (PLE). Insitu clean-up was achieved using matrix solid phase dispersion (MSPD), where Florisil, XAD-4, XAD-7 and C18 were tested as dispersing material for carrot samples. Dichloromethane, ethyl acetate and acetone were used as solvents in a PLE unit at 75 ºC and 1,500 psi. Recovery was in the range of 70 to 133 %. Results obtained with wet carrots were not satisfactory, since most of the recovery values were below 70%. Determination coeficients of the analytical curves presented values between 0.9821 and 0.9970. Limits of detection (LOD) and quantiication (LOQ) for the various components varied from 0.0024 to 0.1968 mg kg-1, and 0.0072 to 0.5963 mg kg-1,
respectively.
Keywords: multiresidue method, PLE, MSPD, carrots, GC/MS
Introduction
In the last few decades, pesticides have been used on an increasingly wider scale throughout the world. On account of the large number of active ingredients used in agricultural production, complex analytical procedures are required for the detection of a great number of possible compounds, with few number of extraction and clean-up steps. These compounds are characterized by their diversity, their different physical and chemical properties (polarity, solubility, pKa etc) and their low concentrations in real samples.1 Some of the analytical methods aim to determine
a single component (SRM) and others, more sophisticated,
are capable of simultaneously determine more than one residue in a single analysis. These last ones are called pesticide multiresidue methods (MRM) and comprise a higher degree of analytical difficulty. Multiresidue methodology by deinition requires determinative steps for separating analytes from one another so each one can be detected and measured individually.2 The most frequently
used classical MRM (solid-liquid extraction) employs solvent extraction with acetone or ethyl acetate followed by gas chromatography determination.3
liquid extraction (PLE), also known as accelerated solvent extraction (ASE).4,5The main advantages of SFE are the
ease separation of the extracted solute from the solvent, the possibility of obtaining clean extracts with reduced solvent consumption and the reduced extraction time, where extracts can often be analyzed with no further clean-up.6,7
However, nowadays the use of SFE has decreased dramatically during the last years, due to high cost of instrumentation and dificulties in method development concerning the extraction conditions optimization.8
Microwave pretreatment has as main advantages the low temperature requirement, high extraction eficiency, complete automation and the possibility of simultaneously extracting different samples at the same time without interference. A disadvantage of MAE seems to be lack of selectivity compared with SFE for comparable extraction eficiency, resulting in co-extraction of signiicant amounts of interfering compounds. Additional clean-up is therefore needed before chromatographic analysis.6
Pressurized liquid extraction uses solvents that are raised to the near-supercritical region, where they show better extraction properties. PLE takes advantage of the increased analyte solubility and extraction kinetics at higher temperature to speed the extraction process and reduce solvent consumption.9 At high temperatures, the rate of
extraction increases because the viscosity and the surface tension decreases, while its solubility and diffusion rate into the sample increase. Pressure has less inluence on analyte recoveries than temperature in PLE, but elevated pressure maintains the solvent in the liquid state at temperatures above the boiling point, and this helps the solvent transport through the sample.10 The combined use of high pressures
and temperatures provides a faster extraction process that requires smaller amounts of solvent compared with traditional extraction, thus decreasing the dilution of the sample.9 The main disadvantages of PLE are that sample
clean-up is still required after extraction and also that it requires very expensive equipment. Particular attention should also be paid to PLE performed at high extraction temperature, which may lead to degradation of thermally labile compounds.5
The majority of the studies concerning pesticides (by SRM or MRM) extraction using PLE are related to soil and sediment samples.11-13 Regarding fresh vegetables samples
there are only a few studies in the literature dealing with MRM analysis, even though analytical methods for this kind of samples are extremely important for food quality control.11,14,15
Matrix solid phase dispersion (MSPD), a process for the extraction of target compounds from solid matrices was introduced by Barker et al.16 in 1989. MSPD combines
both sample homogenization and a possible preliminary clean-up of the target compounds.17,18 Advantages of this
procedure are that no emulsion is formed and elution of the analytes is performed with a relative small solvent volume.19
This technique also enhances the availability of the analytes as it promotes the disruption of the gross architecture of the sample.20-22 MSPD has been employed by some authors
along with PLE as a simultaneous clean-up procedure in the extraction of pesticides from food samples.23 The literature
reports just a few studies regarding SRM and MRM, which employ MSPD/PLE. These research works deal only with a single class of pesticides or with one residue chemical class, such as atrazine in kidney,9 carbamates in bovine milk24 and
fruits and vegetables,25 sulfonamides in raw meat and infant
foods,26 pyrethroids in meats, cheeses, fruits, vegetables
and starches,27 organochlorines in lettuce, tomato, spinach,
potato, turnip leaf and green beans.28As far as these authors
are concerned there are only a few reports in the literature about a multiclass MSPD/PLE method applied to fruits and vegetables. Soler et al.29 determined twelve different
chemical classes of pesticides in fruits. The samples were mixed with acidic alumina using a glass mortar and pestle before pressurized liquid extraction.
In this study, 14 pesticides (captan, chlorothalonil, deltamethrin, dicloran, fenthion, folpet, iprodione, l i n u r o n , m a l a t h i o n , p r o m e t r y n , p r o c h l o r a z , procymidone, trichlorphon and trifluralin) from 9 different classes (dicarboximide, organophosphorous, imidazolecarboxamide, isophthalonitrile, pyrethroid, organochlorine, phenylurea, triazine and dinitroaniline) were investigated. A multiresidue method for wet and freeze-dried (lyophylized) carrots samples was developed using PLE simultaneously with MSPD, having Florisil, XAD-4, XAD-7 and C18 as dispersion agents, and dichloromethane, ethyl acetate and acetone as solvents.
Experimental
Reagents and materials
(J.T. Baker, EUA) with particle diameter between 140 and 250 µm, modiied silica gel (Fluka, Switzerland) with 17 to 18% of C18, Celite 545 (Nuclear, Rio de Janeiro) and anhydrous sodium sulphate (Merck, Darmstadt, Germany). All sorbents were activated or conditioned prior to use. All materials employed in the extraction process were rigorously washed with distilled water, acetone and heptane. Glassware was further dried at 300 ºC for 3 h, except for volumetric lasks. Glassware silanization was performed with dichloromethylsilane in toluene (Acros Organics, Belgium).30
Sampling and sample preparation
Carrot samples, free of pesticides, were purchased from a local farmer’s market (“Cooperativa Central dos Assentados no Rio Grande do Sul”) in Porto Alegre. Samples were stored without foliage inside a glass vessel at −18 ºC until utilization. The developed method was applied to commercial carrot samples proceeding from two different states in Brazil.
Frozen carrots were employed as such and are called “wet (or fresh) samples” in this text. Other frozen carrots were ground in a metal liquidizer (power of 800 W) and then freeze dried (lyophilized) in a Modular Lyophilizator 5260, model 4KEDWARD. Replicates of humidity determination were made using an infra-red balance model Martin ID200 CE96.
Matrix solid-phase dispersion (MSPD) and pressurized luid extraction (PLE)
Ground wet carrots free of pesticides were fortiied with a portion of the working solution in a stainless steel mortar to reach a inal concentration of 0.5 µg g-1 (wet basis). Six
grams of ground carrots were set aside to obtain a blank extract. The fortiied sample was divided into portions of 6 g and to each fraction 3 g of different dispersion agents (XAD-4, XAD-7, C18, Florisil and anhydrous sodium sulphate) were added. Enough anhydrous sulphate was mixed with the wet carrot samples in order to obtain a flowing mixture. Dichloromethane, ethyl acetate and acetone were tested as solvents for MSPD/PLE.
MSPD was applied for freeze-dried and wet samples. The elution step of MSPD was performed by the ASE instrument. Pressurized liquid extractions were performed in a Dionex accelerated solvent extraction apparatus (ASE 300™). Extraction conditions were 1,500 psi, 75 ºC, 5 min of extraction, 100% lush, 90 s purge and 2 cycles of extraction. This number of cycles was employed because former publications related to pesticides in food and
other applications showed no further increase in analytes recovery after 2 or 3 cycles of extractions.31 The extraction
conditions used for lyophilized carrots were the same described for wet carrots. Glass pearls were added to fulill the empty space left by the lower volume of lyophilized carrots samples. Fortiication was performed after the lyophilization process. In order to avoid sodium sulphate dissolution and further deposition in the ASE 300 tubings, Celite 545 (diatomaceous earth) was employed when acetone was the extracting solvent.
Chromatographic conditions
A GC/MS Shimadzu model QP5050-A, equipped with a capillary column OV-5, 30 m × 0.25 mm × 0.25 µm, containing 5% phenyl-methylpolysiloxane (Ohio Valley, Marietta, Ohio), and having helium as carrier gas (1.6 mL min−1) was used at the following conditions: 90 ºC
for 5 min; 5 ºC min-1 to 102 ºC; 7 ºC min-1 to 160 ºC; 2 ºC
min-1 to 205 ºC; 7 ºC min-1 to 250 ºC; 5ºC min-1 to 280 ºC.
The injector was set to 250 ºC in splitless mode and the interface was kept at 280 ºC. Electron impact ionization mode, with 70 eV electron energy, was selected. The screening analysis was performed in the SIM (selective ion monitoring) mode, recording at least one characteristic ion for each compound. Monitoring of chosen ions was done according to speciic retention time windows for each of the analytes, as shown in Table 1.
Table 1. Mass spectrometer detector parameters used in the selective ion
monitoring mode for 14 pesticides and internal standard (IS)
Analyte Characteristic
ions (m/z)
Acquisition window
Acquisition time (min)
Monitoring ions (m/z)
Trichlorphon 109 5-12 109
Tribromobenzene (IS) 316 12-17 316
Triluralin 264, 306 17-25 124, 176, 206,
264, 266, 306
Dicloran 124, 176, 206
Chlorothalonil 264, 266
Prometryn 184, 241 25-30 61, 93, 125,
184, 241, 278
Linuron 61
Malathion 93, 125
Fenthion 93, 125, 278
Captan 79 30-35 76, 79, 96, 104
Folpet 76, 104
Procymidone 96
Iprodione 187, 244 35-42 187, 244
Prochloraz 180 42-51 180
Method validation
Validation is the process of determining the methodology suitability achieving useful analytical data and should be performed to provide evidence that a method its the purpose of its use.32,33 The following parameters were determined:
analytical curve and linearity, limit of detection (LOD), limit of quantiication (LOQ), accuracy (recovery) and precision (repeatability and intermediate precision). Calibration curves were evaluated using solutions of the pesticides in acetone in ive different concentrations, ranging from 0.025 to 2.5 mg L.−1 Each solution was chromatographically
analyzed ive times. Tribromobenzene was employed as internal standard resulting in a concentration of 1 mg L−1 in
the inal solutions. The LOD is the smallest concentration of analyte detectable in the sample by an analytical method with a given level of conidence, and the LOQ is the lowest solute concentration that can be determined with an acceptable level of uncertainty.34,35 LOD and LOQ were
determined according to the ICH (International Conference on Harmonization) guideline which suggests calculation based as 3.3 and 10 times the ratio between the standard deviation of the intercept (response), s, and the slope estimated, S, from the calibration curve of the analytes.36
The precision of the method was evaluated in terms of repeatability and intermediate precision expressed as relative standard deviation (RSD %). The repeatability was veriied by carrying out 8 injections of a1 µg mL-1 standard solutions in a single day while maintaining constant all the operational conditions. The intermediate precision was obtained performing 8 injections of the same standard solution in three different days. The RSD was calculated
using the average of the retention times and also the relative areas for each pesticide. The accuracy of a method is the systematic error of that measuring system and was evaluated by carrying out recovery assays.35,36
Results and Discussion
Method validation
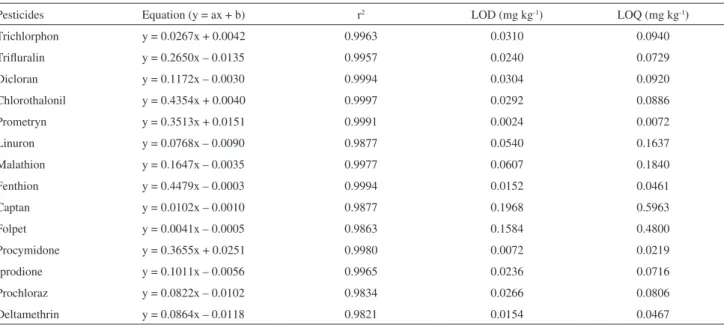
The calibration curve equation, determination coeficient (r2), LOD and LOQ are summarized in Table 2. Regression coeficients of the calibration curves for all analytes ranged from 0.9997 and 0.9821, and the values of the detection and quantiication limits were lower than those prescribed by regulatory agencies such as USEPA,37 EU38
and ANVISA.39 Repeatability and intermediate precision
(RSD) for the retention times of pesticides were between 0.003 and < 0.001%, and 0.032-0.142%, respectively. The same parameters related to chromatographic areas ranged from 0.4 to 11.0% and 2.1 to 15.6%, respectively. Regarding method precision, RSD up to 20% are acceptable, depending on the complexity of the sample.40
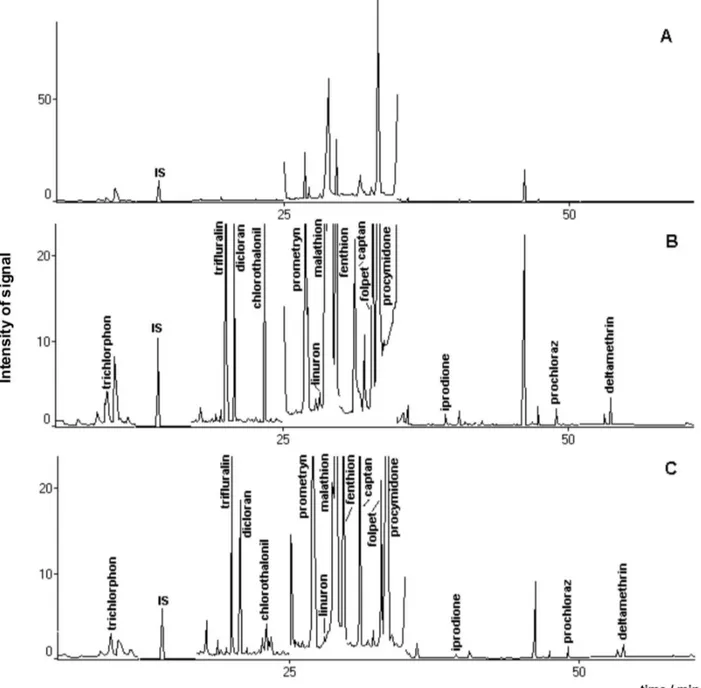
Therefore results obtained in this work may be considered appropriate. Figure 1 shows a representative chromatogram of the standard working solution, whose peaks have their characteristic ions presented in Table 1.
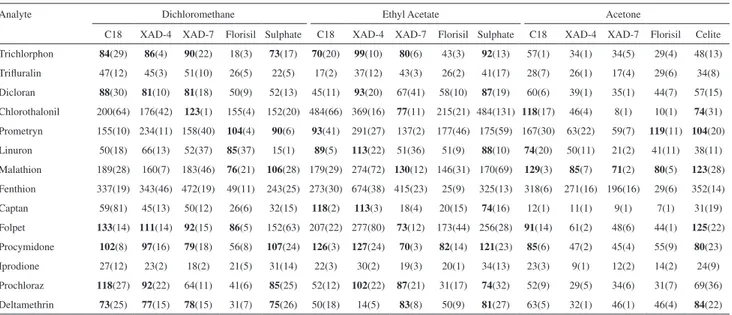
Recoveries obtained in the extraction of lyophilized carrots are shown in Table 3, and are in the range of 70 to 133% for eleven analytes. However, lower recoveries were gotten for triluralin and iprodione and higher recoveries for fenthion. Those results may be due to stronger matrix/ analyte interactions and to co-elution of interferents,
Table 2. Results obtained for the calibration curves of pesticides, values of LOD and LOQ obtained by GC/MS
Pesticides Equation (y = ax + b) r2 LOD (mg kg-1) LOQ (mg kg-1)
Trichlorphon y = 0.0267x + 0.0042 0.9963 0.0310 0.0940
Triluralin y = 0.2650x – 0.0135 0.9957 0.0240 0.0729
Dicloran y = 0.1172x – 0.0030 0.9994 0.0304 0.0920
Chlorothalonil y = 0.4354x + 0.0040 0.9997 0.0292 0.0886
Prometryn y = 0.3513x + 0.0151 0.9991 0.0024 0.0072
Linuron y = 0.0768x – 0.0090 0.9877 0.0540 0.1637
Malathion y = 0.1647x – 0.0035 0.9977 0.0607 0.1840
Fenthion y = 0.4479x – 0.0003 0.9994 0.0152 0.0461
Captan y = 0.0102x – 0.0010 0.9877 0.1968 0.5963
Folpet y = 0.0041x – 0.0005 0.9863 0.1584 0.4800
Procymidone y = 0.3655x + 0.0251 0.9980 0.0072 0.0219
Iprodione y = 0.1011x – 0.0056 0.9965 0.0236 0.0716
Prochloraz y = 0.0822x – 0.0102 0.9834 0.0266 0.0806
respectively. The use of dichloromethane and ethyl acetate as extracting solvents resulted in good recoveries specially for 5 to 7 analytes, when C18, XAD-4 e XAD-7 solid phases were employed. Figure 2A presents a chromatogram of an extraction blank obtained from a free pesticide carrot sample, while Figure 2B shows a chromatogram obtained from MSPD/PLE of a spiked carrot sample where sodium sulphate was employed. It is possible to observe from Table 3 that the use of sodium sulphate or XAD-7 provided the better recovery values for seven pesticides, when using ethyl acetate. Acetone and lorisil provided lower eficiency for the extraction process for the majority of the pesticides. Relative standard deviations are in the range of 2 to 31% whenever recovery values were satisfactory. However, it can be seen that RSD are not acceptable when there were dificulties in the extraction process due to matrix/interferents inluence.
Besides that, the use of drying agents (anhydrous sodium sulphate and Celite) also resulted in recoveries in the range of 70 to 133%. This indicates that the use of the solid phases did not improve the extraction process eficiency signiicantly. However, several chromatograms obtained when solid phases were added to the extraction process resulted in lower intensity interferents peaks, providing an analytical method less prone to interferences. This can be observed in Figure 2C that shows the chromatogram obtained with XAD-7 and ethyl acetate as extracting solvent. Distorted procymidone chromatographic peak (Figure 2B) is an example of the interference which occurred without using dispersion agent, which is not seen in Figure 2C. Results obtained with wet carrots were not satisfactory, as most of the recoveries values were below 70%. The presence of water molecules in the matrix may
Table 3. Recovery percentage (standard deviation) obtained for 14 pesticides using various solid phases and extracting solvents in a MSPD/PLE of
freeze-dried carrots
Analyte Dichloromethane Ethyl Acetate Acetone
C18 XAD-4 XAD-7 Florisil Sulphate C18 XAD-4 XAD-7 Florisil Sulphate C18 XAD-4 XAD-7 Florisil Celite Trichlorphon 84(29) 86(4) 90(22) 18(3) 73(17) 70(20) 99(10) 80(6) 43(3) 92(13) 57(1) 34(1) 34(5) 29(4) 48(13) Triluralin 47(12) 45(3) 51(10) 26(5) 22(5) 17(2) 37(12) 43(3) 26(2) 41(17) 28(7) 26(1) 17(4) 29(6) 34(8) Dicloran 88(30) 81(10) 81(18) 50(9) 52(13) 45(11) 93(20) 67(41) 58(10) 87(19) 60(6) 39(1) 35(1) 44(7) 57(15) Chlorothalonil 200(64) 176(42) 123(1) 155(4) 152(20) 484(66) 369(16) 77(11) 215(21) 484(131) 118(17) 46(4) 8(1) 10(1) 74(31) Prometryn 155(10) 234(11) 158(40) 104(4) 90(6) 93(41) 291(27) 137(2) 177(46) 175(59) 167(30) 63(22) 59(7) 119(11) 104(20) Linuron 50(18) 66(13) 52(37) 85(37) 15(1) 89(5) 113(22) 51(36) 51(9) 88(10) 74(20) 50(11) 21(2) 41(11) 38(11) Malathion 189(28) 160(7) 183(46) 76(21) 106(28) 179(29) 274(72) 130(12) 146(31) 170(69) 129(3) 85(7) 71(2) 80(5) 123(28) Fenthion 337(19) 343(46) 472(19) 49(11) 243(25) 273(30) 674(38) 415(23) 25(9) 325(13) 318(6) 271(16) 196(16) 29(6) 352(14) Captan 59(81) 45(13) 50(12) 26(6) 32(15) 118(2) 113(3) 18(4) 20(15) 74(16) 12(1) 11(1) 9(1) 7(1) 31(19) Folpet 133(14) 111(14) 92(15) 86(5) 152(63) 207(22) 277(80) 73(12) 173(44) 256(28) 91(14) 61(2) 48(6) 44(1) 125(22) Procymidone 102(8) 97(16) 79(18) 56(8) 107(24) 126(3) 127(24) 70(3) 82(14) 121(23) 85(6) 47(2) 45(4) 55(9) 80(23) Iprodione 27(12) 23(2) 18(2) 21(5) 31(14) 22(3) 30(2) 19(3) 20(1) 34(13) 23(3) 9(1) 12(2) 14(2) 24(9) Prochloraz 118(27) 92(22) 64(11) 41(6) 85(25) 52(12) 102(22) 87(21) 31(17) 74(32) 52(9) 29(5) 34(6) 31(7) 69(36) Deltamethrin 73(25) 77(15) 78(15) 31(7) 75(26) 50(18) 14(5) 83(8) 50(9) 81(27) 63(5) 32(1) 46(1) 46(4) 84(22) Recoveries between 70 and 135% are written in bold. Data were obtained from replicate experiments.
hinder the interaction among solid phase and the analytes or prevent the access of extracting solvents to them. Mean values for the humidity of freeze-dried carrots were about 3.0%, while for wet samples they were 90.1%. Relative standard deviations for humidity determinations were 0.33 and 0.25% respectively.
Real samples
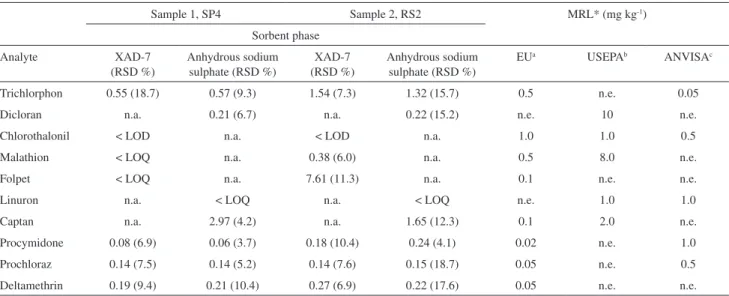
Two samples of commercial freeze-dried carrots (SP4 and RS2) were analyzed using two different MSPD/PLE methods: XAD-7 (method A) and anhydrous sodium
sulphate (method B) as dispersion agents and ethyl acetate as solvent. Ten pesticides were analyzed using these two methods: deltamethrin, prochloraz, procymidone and trichlorphon with both methods; chlorothalonil, folpet and malathion with method A; captan, dicloran, and linuron with method B.
Table 4 shows the amount of pesticides found in samples of freeze-dried carrots. Six residues were found above LOQ values in both samples, using method B: trichlorphon, dicloran, captan, procymidone, prochloraz and deltamethrin. The application of method A resulted in concentrations above the LOQ for 4 and 6 pesticides in
Figure 2. A - Chromatogram of an extraction blank obtained from a free pesticide carrot sample. B - Chromatogram of the 14 pesticides extracted from
samples 1 and 2, respectively: trichlorphon, procymidone, prochloraz and deltamethrin (plus malathion and folpet).
Prochloraz and procymidone showed concentrations below the MRL set by ANVISA, but higher than that for the European Community. Trichlorfon was detected at levels above those established by EU and ANVISA, while chlorothalonil and malathion were found in lower amounts than those determined by all the agencies. ANVISA does not prescribe the use of folpet and deltamethrin, for growing carrots. However the levels found for both analytes in the investigated samples are above the MRL designated by EU. Method B allowed the detection of seven compounds in both samples. Concentrations of dichloran and linuron were below the maximum residue limits set by the three regulatory agencies quoted. Captan and deltamethrin were found in concentrations above those values set as safe by the EU, although these two compounds are not regulated by USEPA and ANVISA for the culture of carrots. Procymidone and prochloraz were detected at concentrations below those recommended by ANVISA but above the MRL designated by EU. The use of trichlorfon is not allowed for carrot culture according to USEPA, but was found in concentrations above the MRL set by EU and ANVISA.
Conclusions
The proposed extraction methods proved to be eficient for the determination of ten pesticides in liophylized carrots, as recovery values ranged from 70 to 130% for the method A (XAD-7 as dispersion agent) and 74 to 121% for the method B (anhydrous sodium sulphate as
dispersion agent). Results obtained with wet carrots were not satisfactory, as most of the recoveries values were below 70%. The use of C18, XAD-4 e XAD-7 solid phases as dispersion agents and of dichloromethane and ethyl acetate as extracting solvents provided the best results in the MSPD/PLE processes. Good recoveries were obtained also when drying agents (sodium sulphate and Celite) were employed. The use of drying agent (anhydrous sodium sulfate) gave recoveries similar to those obtained with C18, XAD-4 and XAD-7 solid phases, indicating that these dispersion agents did not improve the extraction process. Employing acetone as solvent resulted in low recoveries, however, when using C18 and Celite acceptable values were achieved for ive and six compounds, respectively. The presence of water molecules in the matrix may hinder the interaction among solid phase and the analytes or prevent the access of extracting solvents to them. LOD and LOQ were well below the MRL recommended by Brazilian, North American and European regulatory agencies.
Acknowledgments
The authors thank CNPq, CAPES and FAPERGS for inancial support and scholarships and also Andréia L. Silva for humidity measurements. We also thank Ewelin M. P. N. Canizzares from FEPAM for the use of GC/MS equipment.
References
1. Stajnbaher, D.; Zupancic, L. K.; J. Chromatogr. A2003, 1015, 185.
Table 4. Pesticides contents found in carrot samples (mg kg-1) using the MSPD/PLE proposed method for freeze-dried carrots with two different sorbent
phases and ethyl acetate in comparison with MRL from several agencies
Sample 1, SP4 Sample 2, RS2 MRL* (mg kg-1)
Sorbent phase
Analyte XAD-7
(RSD %)
Anhydrous sodium sulphate (RSD %)
XAD-7 (RSD %)
Anhydrous sodium sulphate (RSD %)
EUa USEPAb ANVISAc
Trichlorphon 0.55 (18.7) 0.57 (9.3) 1.54 (7.3) 1.32 (15.7) 0.5 n.e. 0.05
Dicloran n.a. 0.21(6.7) n.a. 0.22 (15.2) n.e. 10 n.e.
Chlorothalonil < LOD n.a. < LOD n.a. 1.0 1.0 0.5
Malathion < LOQ n.a. 0.38 (6.0) n.a. 0.5 8.0 n.e.
Folpet < LOQ n.a. 7.61 (11.3) n.a. 0.1 n.e. n.e.
Linuron n.a. < LOQ n.a. < LOQ n.e. 1.0 1.0
Captan n.a. 2.97 (4.2) n.a. 1.65 (12.3) 0.1 2.0 n.e.
Procymidone 0.08 (6.9) 0.06 (3.7) 0.18 (10.4) 0.24 (4.1) 0.02 n.e. 1.0
Prochloraz 0.14 (7.5) 0.14 (5.2) 0.14 (7.6) 0.15 (18.7) 0.05 n.e. 0.5
Deltamethrin 0.19 (9.4) 0.21 (10.4) 0.27 (6.9) 0.22 (17.6) 0.05 n.e. n.e.
2. Pittertschatscher, K.; Inreiter, N.; Schatzl, A.; Malissa, H. Jr.;
Fresenius J. Anal. Chem. 1999, 365, 338.
3. Agüera, A.; Contreras, M.; Crespo, J.; Fernández-Alba, A. R.;
Analyst2002, 127, 347.
4. Gfrerer, M.; Chen, S.; Lankmayr, E. P.; Quan, X.; Yang, F.;
Anal. Bioanal. Chem. 2004, 378, 1861.
5. Lambropoulou, D. A.; Albanis, T. A.; Anal. Bioanal. Chem.
2007, 389, 1663.
6. Abbas, K. A.; Mohamed, A.; Abdulamir, A. S.; Abas, H. A.;
Am. J. Biochem. Biotechnol. 2008, 4, 345. 7. Beyer, A.; Biziuk, M.; Food Chem. 2008, 108, 669.
8. López, B. G.; Reyes, J. F. G.; Díaz, A. M.; Talanta2009, 79, 109.
9. Richter, B. E.; Jones, B. A.; Ezzel, J. L.; Porter, N. L.; Avdalovic, N.; Pohl, C.; Anal. Chem. 1996, 68, 1033.
10. Lehotay, S.; Lee, C.; J. Chromatogr. A1997, 785, 313. 11. Vidal, J. L. M.; Arrebola, F. J.; Sánchez, M. M.; J. Chromatogr.
A2002, 959, 203.
12. Chuang, J. C.; Hart, K.; Chang, J. S.; Boman, L. E.; van Emon, J. M.; Reed, A. W.; Anal. Chim. Acta2001, 444, 87.
13. Arrebola, F. J.; Vidal, J. L. M.; Sánchez M. M.; Castellón, F. J. A.; Anal. Chim. Acta2003, 484, 167.
14. Moreno, J. L. F.; Liebanas, F. J. A.; Frenich, A. G.; Vidal, J. L. M.; J. Chromatogr. A2006, 1111, 97.
15. Frenich, A. G.; Salvador, I. M.; Vidal, J. L. M.; Lopes, W. G.; Lopes, T. L.; Anal. Bioanal. Chem. 2005, 383, 1106.
16. Barker, S. A.; Long, A. R.; Short, C. R.; J. Chromatogr. A1989,
475, 353.
17. Garcinuño, R. M.; Ramos, L.; Hernando, P. F.; Cámara, C.;
J. Chromatogr. A2004, 1041, 35.
18. Bogialli S.; Di Corcia A.; J. Biochem. Biophys. Methods2007,
70, 163.
19. Tekel, J.; Hatrík, S.; J. Chromatogr. A1996, 754, 397. 20. Dórea, H. S.; Sobrinho, L. L.; J. Braz. Chem. Soc. 2004, 15,
690.
21. Barker, S. A.; J. Biochem. Biophys. Methods2007, 70, 151. 22. Picó, Y.; Fernández, M.; Ruiz, M. J.; Font, G.; J. Biochem.
Biophys. Methods2007, 70, 117.
23. Martínez, R. C.; Gonzalo, E. R.; Ruiz, P. R.; Méndez, J. H.;
J. Chromatogr. A2005, 1089, 1.
24. Bogialli, S.; Curini, R.; Di Corcia, A.; Lagana, A.; Nazzari, M.; Tonci, M.; J. Chromatogr. A2004, 1054, 351.
25. Bogialli, S.; Curini, R.; Di Corcia, A.; Lagana, A.; Nazzari, M.; Tamburro, J.; J. Agric. Food Chem.2004, 52, 665.
26. Gentili, A.; Perret, D.; Marchese, S.; Sergi, M.; Olmi, C.; Curini, R.; J. Agric. Food Chem.2004, 52, 4614.
27. Vonderheide, A. P.; Kauffman, P. E.; Hieber, T. E.; Brisbin, J. A.; Melnyk, L. J.; Morgan, J. N.; J. Agric. Food Chem.2009,
57, 2096.
28. Pereira, M. B.; Castro, M. J. G.; Lorenzo, S. M.; Mahía, P. L.; Rodríguez, D. P.; Fernández, E. F.; Talanta2007, 71, 1345. 29. Soler, C.; James, K. J.; Picó, Y.; J. Chromatogr. A2007, 1157,
73.
30. Doong, R.; Chang, S.; Sun, Y.; J. Chromatogr. A2000, 879,177. 31. Kawata, K.; Asada, T.; Oikawa, K.; J. Chromatogr. A2005,
1090,10.
32. Taylor, J. K.; Anal. Chem. 1983, 55, 600A.
33. European Comission, Method Validation and Quality Control Procedures for Pesticide Residues Analysis in Food and Feed,
2007.
34. Vial, J.; Jardy, A.; Anal. Chem.1999, 71, 2672.
35. CITAC/Eurachem, Guide to Quality in Analytical Chemistry: An Aid to Accreditation, 2002.
36. ICH - International Conference on Harmonisation of Technical Requirements for Registration of Pharmaceuticals for Human Use, Q2B Validation of Analytical Procedures: Methodology.
1996.
37. http://www.epa.gov/pesticides/food/viewtols.htm, accessed in January 2008.
38. http://ec.europa.eu/food/plant/protection/pesticides/index_ en.htm, accessed in January 2008.
39. http://www.anvisa.gov.br/toxicologia/sia.htm, accessed in January 2008.
40. Ribani, M.; Bottoli, C. B. G.; Collins, C. H.; Jardim, I. C. S. F.; Melo, L. F. C.; Quim. Nova 2004, 27, 771.
Received: June 10, 2009