FASE: Reaching Scalability in
Unstructured P2P Networks Using
a Divide and Conquer Strategy
Pedro Fonseca
Hugo Miranda
DI–FCUL
TR–08–12
April 2008
Departamento de Inform´
atica
Faculdade de Ciˆ
encias da Universidade de Lisboa
Campo Grande, 1749–016 Lisboa
Portugal
Technical reports are available at http://www.di.fc.ul.pt/tech-reports. The files are stored in PDF, with the report number as filename. Alternatively, reports are available by post from the above address.
FASE: Reaching Scalability in Unstructured P2P
Networks Using a Divide and Conquer Strategy
Pedro Fonseca
Hugo Miranda
April 2008
Abstract
Unstructured peer-to-peer networks have a low maintenance cost, high resilience and tolerance to the continuous arrival and departure of nodes. In these networks search is usually performed by flooding, which is highly inefficient. To improve scalability, unstructured overlays evolved to a two-tiered architecture where regular nodes rely on superpeers to locate re-sources. While this approach takes advantage of node heterogeneity, it makes the overlay less resilient to accidental and malicious faults, and less attractive to users concerned with the consumption of their resources. In this paper we propose a search algorithm, called FASE, which combines a replication policy and a search space division technique to achieve scala-bility on unstructured overlays with flat topologies. We present simulation results which validate FASE improved scalability and efficiency.
1
Introduction
In recent years, peer-to-peer (P2P) systems have moved from hybrid networks, where some features like search depended on centralized servers, to fully decen-tralized architectures. Without a central directory, resource location becomes an issue because peers only have a partial view of the network. Current decen-tralized P2P systems are built over structured or unstructured overlays. Besides resource location, P2P decentralized networks must also cope with the intermi-tent connectivity of the participants, who may freely disconnect their devices. In large scale networks, one may assist to a permanent redesign of the network in a process designated as churn.
Structured P2P overlays are usually based on Distributed Hash Tables (DHT). These networks resolve the resource location problem by constraining the place-ment of nodes and data in the structure. In most impleplace-mentations, DHTs are able to resolve a query in O(log(n)) hops [1, 2, 3]. However, DHTs are designed for exact-match queries and their maintenance cost increases under high churn rates.
In unstructured overlays nodes form random topologies which have low main-tenance cost. Popular P2P systems, such as Gnutella [4] and Kazaa [5], are based on unstructured overlays. In the original Gnutella architecture, search was per-formed by flooding the network. This method will only return results from nodes within a maximum and predefined hop distance from the source known as the time-to-live (TTL). The search scope must be constrained as the number of messages generated by a single query increase exponentially with the TTL.
To address original Gnutella scalability issues, current versions of Gnutella and Kazaa use a hierarchical, two-tier architecture [4, 5]. In these systems most of the nodes are leaf peers but some are elected as superpeers. A superpeer connects to other superpeers and to its leaf peers. The contents offered by a leaf peer are indexed in the correspondent superpeer. Queries are delivered to the node’s superpeer, who will flood to the remaining superpeers if it is unable to find a reply in its indexes.
Using a two-tiered architecture improves query efficiency and allows unstruc-tured overlays to scale but places most of the load in a small set of nodes whose failure has a high impact on the network. It has been observed that Gnutella’s (and topologies with power law distributions in general) is resilient to massive failures of random nodes in the overlay [6, 7]. However, if nodes are not selected at random, the overlay may become partitioned if as few as 4% of the higher degree nodes fail [7]. In addition, two-tiered architectures exhibit an unfair load-balancing. We note that even when superpeers have the capacity to cope with the additional load, the unfair load-balancing may not be acceptable for some users. In an attempt to leverage the load, users may feel compelled to present selfish behavior, contributing to the instability of the network and increasing the large proportion of free-riders found in P2P networks [7, 8].
This paper presents the Frequency-Aware SEarch algorithm (FASE). FASE is a scalable search protocol over unstructured overlays. FASE improves fairness and resilience to node failure by relying on a flat, non-hierarchical topology, where all nodes are required to perform a similar role. The algorithm uses a search space partitioning mechanism, combined with a replication policy and biased random walks to attain low hop count searches with a reduced number of messages. FASE does not rely on a two-tiered architecture and therefore is more resilient to node failures. Our algorithm does not require the exchange of routing information between nodes, which would impact on its capability to recover from node failures; the search remains an uninformed search, but with a refined scope.
The rest of this paper is structured as follows. Section 2 surveys related work. The detailed design and some implementation aspects are discussed respectively in Sections 3 and 4. In Section 5 we present the simulation environment and discuss the obtained results. We present our conclusions as well as future work in Section 6.
2
Related Work
Locating an item in non-hierarchical unstructured overlays with moderate re-source consumption is an interesting challenge. A na¨ıve approach to the problem is to flood the network with a query message. In flooding, nodes receiving some message for the first time propagate it to every neighbour. Flooding is reliable (given that the message is delivered to every node thus ensuring that the item will be found) but does not scale well. In particular, it may consume large amounts of the available bandwidth even if each node has a small number of neighbours.
In random walks, messages are not replicated. Instead, when receiving a message for the first time, each node forwards it to exactly one of its neighbours selected at random. Elsewhere [9], it was shown that random walks can find
objects within a comparable number of hops, while reducing network traffic by a order of magnitude when compared to flooding.
The performance of random walks can be improved if the selection of the next hop is biased to nodes where the location of the item is more probable. For example, using information collected during past searches [10]. Unfortunately, this method has limited applicability when the probability of having a large number of queries to the same item hitting the same node is low. This is the case of large scale P2P networks.
Some P2P search algorithms rely on Bloom Filters [11] to store routing in-formation. A Bloom Filter is a lossy data structure used to test membership. Upon insertion, an item i is hashed k times, each using a different hash function. The result of applying each hash function to the item will set a position in the bit vector with m bits which constitutes the filter. To test if some item is in-cluded in the filter, the same k hash functions are applied. An item is inin-cluded in the filter if all the bits returned by the k hash functions are set. Given that a single Bloom filter may include many items, a test may return a false positive. Scalable Query Routing(SQR) [12] uses information encoded in probabilistic routing tables to forward queries to the probable location of the desired object. It can be used with hierachical and flat topologies.
SQR probabilistic routing tables use one Exponentially Decaying Bloom Fil-ter (EDBF) per link. An EDBF is similar to a standard Bloom FilFil-ter where a membership test θ(x) yields the number of bits present instead of a boolean value. To create an update, SQR merges all its neighbors corresponding filters, except the one where the update is going to be sent; the resulting filter bits remain set to 1 with a probability 1
d (with d being a system defined
param-eter) and the result is merged with the nodes own (undecayed) filter; finally, the resulting filter is compressed and forwarded. Queries are forwarded to the neighbor with greater θ(x), that is to the node which has a filter with more bits corresponding to the queried item. When a query revisits a neighbor it is randomly forwarded.
The maintenance of the probabilistic routing table implies a non-negligible overhead. To mitigate this problem, information for each update degrades with the distance to the host, thus implying an increasing “noise”. In consequence, a search too far away from the searched object behaves like a random walk. Performance is expected to improve in the neighborhood of an host, however, the query may still be incorrectly forwarded due to false positives in the probabilistic data structure.
Gia [13] was designed considering the heterogeneity of P2P systems by adapt-ing the overlay topology to the capacity of the participatadapt-ing nodes. Random walks are preferably routed to the nodes with the higher capacity, those that are more likely to store a pointer to the item. In practice, Gia defines a hierarchical overlay network by concentrating queries on more powerfull devices.
Gia is built over four components: topology adaptation according to node ca-pacity, flow control, one-hop replication, where a nodes index is replicated on its neighbors at the distance of one-hop, and biased random walks directed to high capacity nodes. The capacity is a system parameter defined, for instance, by the node bandwith and/or CPU. Nodes with higher capacity accept more neigh-bors up to a maximum defined by the algorithm. In addition, Gia computes a “satisfaction level” where nodes with high degree and capacity neighbors have a higher satisfaction. Therefore, a Gia peer accepts new neighbors according to its
capacity, the minimum and maximum number of neighbors parameters and its satisfaction level. To bound the resources consumed at each node, nodes grant flow control tokens according to their capacity and queries are only forwarded to nodes with available tokens.
Gia emphasises the resilience problems that have been refered for hierarchi-cal networking models. Furthermore, determining a node capacity can be non trivial - a user may fool the system - and does not take into account participant behaviour, for instance, high capacity nodes may have short session times, thus forcing a overhead in overlay adaptation for short lived gains.
Search could also be improved by adapting the overlay topology to establish communities of peers with the same interests. In Acquaintances [14] nodes keep neighbor links, chosen randomly like in Gnutella, and acquaintance links. Nodes which return a positive response are promoted to the acquaintances link list of the query source. Such algorithms are feasible in stable networks where peers have long session times. Maintaining interest relationships in a network where most of the nodes have short session times is more complex, as it is unlikely that a node performs or returs a positive reply to more than a few queries.
Both GIA and SQR nodes distribute information by their neighbors. The goal is to bias random walks, so that they are directed to the nodes where the probability of success is higher. In this paper we describe an algorithm that follows a similar approach. However, in FASE, random walks are biased by information that can be locally computed by any node, irrespective of its session time or resources. Therefore, FASE overlay can be maintained with lower costs.
3
FASE
To achieve scalability and efficiency, FASE defines a policy for partitioning the search space and a replication policy. FASE partitions both the key space and the nodes in a common “frequency space”. FASE was designed with wired peer-to-peer networks in mind. However, as it will be shown, FASE search algorithm has some resemblances with a model where queries are broadcasted in a frequency echoed only by some objects. Each node has a label which we call a frequency. The problem is similar to a graph coloring problem although by definition, in a colorable graph, two adjacent nodes can not have the same color. In FASE, nodes with the same frequency or color can share an edge. Henceforth, we will refer to a node label as a frequency. Nodes neighbors are freely created and are expected to be from different frequencies. A “frequency path” is defined as an uninterrupted sequence of neighbouring nodes of the same frequency. In FASE, pointers to the objects are stored on nodes with the same frequency of the object, preferably on different frequency paths. Improved search results are achieved by having nodes to forward random walks preferably to nodes in the same frequency of the seeked object.
FASEmakes no assumptions about overlay structure, nor is overlay mem-bership the focus of this work. The algorithm does not require node memmem-bership to be constrained in any way. However, it is assumed for the remainder of this paper that the overlay topology has a constant degree (although this is not en-forced or required by the algorithm). The degree of a network is the approximate number of connections established by each node. A constant degree leverages
the contribution of each node to the overlay. HyParView [15] is an example of a membership protocol which maintains a symmetric, constant degree topology.
A frequency is defined to be any element of a finite and discrete set Φ.
We define functions fN : N 7→ Φ and fK : K 7→ Φ mapping respectively
the set of nodes (N ) and keys (K) in frequencies. Mappings should uniformly distribute nodes and keys by frequencies. A non-uniform mapping will result in unbalanced partitions leading to a sub-optimal performance of the algorithm. Good examples of mapping functions are hashes of a node’s IP address, port or keys. The set Φ and functions fN and fK are known by every node in the network.
In this paper, we assume that a single copy of the object is stored at the node that created it. In deployed P2P networks, the available items have different popularity and the most popular items are naturaly replicated. By storing a single copy, our aim is to model a worst case scenario as well as to evaluate the efficiency of the FASE replication mechanism.
The goal of FASE is to provide to nodes good storage and retrieval mecha-nisms for pointers. A pointer is a unique reference (e.g. an URL) that permits to uniquely identify both the object and the node storing it.
3.1
Pointer Replication
Pointers are replicated in a Replication message, forwarded using a biased random walk. The Replication message is initiated by the source node of the item and carries a replica counter, to be decremented by every peer deciding to store a pointer. Each Replication message carries pointers for one frequency. A pointer is defined as follows:
1. Pointer: (Ref, U RL) 2. Ref: String|Key|Set 3. Frequency: hash(Ref )
The pointer to an item can be one of the following pairs:
• (String, U RL) one or more words with the same frequency describing the item and the location of the item;
• (Key, U RL) a key, e.g. a criptographic hash, which identifies an item and the corresponding location of the item;
• (Set, U RL) a set of items and the node that contains them.
The Replication message is successively forwarded at each node n ∈ N to one of n’s neighbors (nn) not visited by the message. Preference is given to neighbors in the frequency of the key, that is, with fN(nn) = fK(k). The forwarding of the random walk stops when the replica counter reaches 0 or when there are no unvisited nodes.
A node n′ stores the item when it belongs to the same frequency of the key and it has received a message from a node n with a different frequency, that is, fN(n′) = fK(k) ∧ fN(n) 6= fK(k). Recall that the random walk is preferably forwarded to nodes in the same frequency of the item. Therefore, if
there is a sequence of nodes in the same frequency, only one replica is stored for the whole sequence. While the process of replication may sound costly, keep in mind that it happens only once. As it will be shown below, the search algorithm takes advantage of the dissemination model to achieve interesting performance results that are able to mitigate the dissemination costs.
3.2
Item Retrieval
If the mapping functions uniformly distribute nodes and keys by frequencies, the search space of some key should be approximately |N ||Φ|. Depending on the num-ber of frequencies |Φ|, this may represent a substantial reduction of the search space. The retrieval algorithm takes advantage of this property by forwarding random walks preferably to nodes in the same frequency of the item.
To locate an item, a peer uses a Query message forwarded in one or more random walks. The message includes a search string which can be mapped to an item and to the items frequency. The random walks follow the same forwarding rules used for forwarding the Replication messages. In brief: queries are forwarded to a neighbor picked randomly from the set of unvisited neighbors with the same frequency of the queried item; or, if there is no node with the same frequency, to a random unvisited neighbor. That is, once a random walk enters a path of nodes in the frequency of the target item it will follow the path. Therefore, if a replica of the item was stored in the path, there is a good probability that the random walk will find it before exiting the path.
4
Implementation
The novel aspects of FASE have been presented in Sec. 3. In this section, we discuss the implementation options and propose some optimizations to the original algorithms.
4.1
Dissemination of Multiple Items
A common technique to efficiently manage the storage space occupied by the caches of pointers in a network are Bloom filters [11]. FASE works equally well if the keys in Replication messages are replaced by Bloom filters created for all the items made available by the node for a single frequency. In this case, the frequency must be included in the Replication message given that nodes will not be able to derive it from the information in the Bloom filter. To advertise items belonging to multiple frequencies, peers prepare one Replication mes-sage per frequency and apply the replication algorithm independently to each. Given that the number of frequencies is expected to be small, when compared to the number of items, we expect the multiplication of Bloom filters per peer to represent a negligible increase on the overhead imposed to the participants.
4.2
Random Walk Forwarding
There are multiple implementation choices for random walks in peer to peer networks. We note that although they may produce a non-negligible impact on performance, the selection of some of these criteria is orthogonal to FASE.
There are at least two possibilities to prevent random walks from visiting more than once the same node. One possibility is to store on the nodes the unique IDs of the messages that have visited him recently. When a message is received for the second time to a node it is discarded. This approach may significantly impact the performance of algorithms relying on a small number of parallel random walks. The alternative we implemented includes the list of traversed nodes in the message. Although it may lead to significantly large messages, this approach permits to nodes to avoid next hops that have been previously visited so that the probability of the message being dropped is re-duced.
When using multiple random walks it is important to define a criteria that permits to stop all the random walks after the first successful hit. In FASE implementation we used “adaptive termination” [9] which dictates that when an item is found the query source is contacted and the walker is terminated. Nodes hosting walkers periodically connect to the source of the query to confirm that no reply was found. The random walk is terminated otherwise.
5
Evaluation
We evaluated FASE through extensive simulations. In addition, we imple-mented and compared FASE results with SQR (see Sec. 2).
Simulation results were obtained using PeerSim [16] event driven simulation engine. The simulations use a 20,000 node network. For each test case we used 10 different topologies, running 10 tests for each topology, giving a total of 100 distinct simulations. Plots present the average of the 100 simulations. The variation of the results is presented by error bars, showing the value of the 10th lowest and highest results. Error bars are not always visible due to their proximity to the average.
Each simulation creates 2000 unique data items, each advertised by a distinct node selected at random. 20000 queries (one per each node) are performed. Each query tries to find one item, randomly selected using a uniform distribution. In a number of running P2P networks, items have a non-uniform distribution that depends on their popularity. In our uniform distribution model, each item is hosted by a single node, thus representing the least popular items of the networks.
The “adaptive termination” [9] parameter of random walks (see Sec. 4.2) was configured so that each random walk checks for termination every four hops. Topologies were generated by HyParView [15]. P2P topologies are char-acterized by their degree and clustering coeficient. The degree of a network is the approximate number of connections established by each node. Cluster-ing coefficient is defined as the probability that two neighbors of a node are neighbors themselves. Our topologies have constant degree and low clustering coefficient (between 4.05×10⁻⁴and 5.29×10⁻⁴for topologies with degree = 10; between 1.38 × 10⁻³ and 1.42 × 10⁻³ for topologies with degree = 30). SQR was evaluated with the topologies above as well as with random topologies with a degree distribution in the interval [3, 8]. SQR’s parameters d (the filter decay rate) and k (the number of hash functions) were selected using the values in [12] to achieve low routing overheads; the m parameter (the EDBF length) is lower as we used substantially less objects.
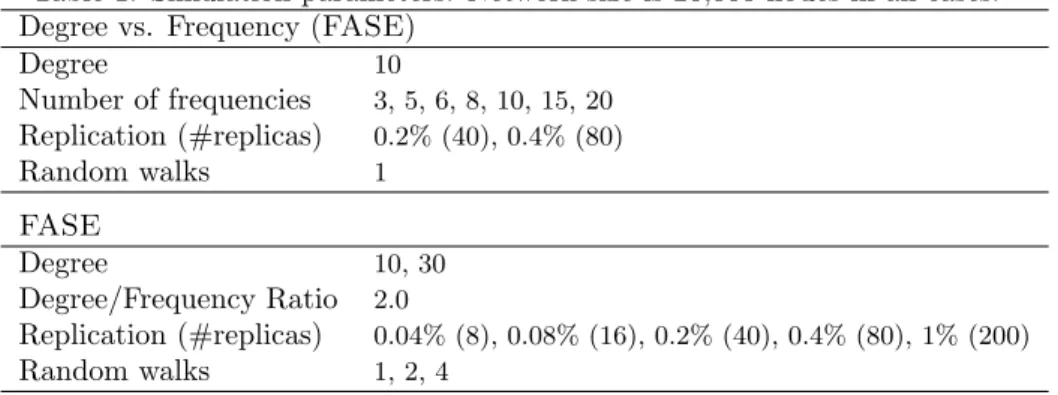
Table 1: Simulation parameters. Network size is 20,000 nodes in all cases. Degree vs. Frequency (FASE)
Degree 10 Number of frequencies 3, 5, 6, 8, 10, 15, 20 Replication (#replicas) 0.2% (40), 0.4% (80) Random walks 1 FASE Degree 10, 30 Degree/Frequency Ratio 2.0 Replication (#replicas) 0.04% (8), 0.08% (16), 0.2% (40), 0.4% (80), 1% (200) Random walks 1, 2, 4
To ensure a fair comparison we replicated objects across the overlay for the SQRsimulations. In deployed P2P networks it is common to observe content replication (although in a non-uniform way). In FASE we use the replication protocol to increase the availability of items, specifically with unpopular items in consideration.
Table 1 summarizes the parameters used.
We observed FASE behavior for both low and high degree topologies, using different replication rates and varying the number of parallel random walks. The topology with degree = 10 models a network of participants with limited resources. With degree = 30 we have a topology which imposes a higher load on each user to achieve better hop counts. The later can be compared to an overlay with superpeers, as the degree distribution in modern Gnutella superpeers peaks at 30 [6]. In either case the number of frequencies is half of the degree. Due to memory constraints imposed by its routing tables, SQR was evaluated only up to degree = 10 topologies.
The evaluation of FASE uses two metrics. The hop count shows the number of hops traversed by the first random walk to locate the item. The number of messages counts the total number of forwardings of every random walk used in the operation, which can be either a replication or a query.
5.1
Degree vs Frequency Tradeoff
Two factors influencing the performance of FASE are i) the effectiveness of the biased random walk in finding nodes of the desired frequency, and ii) the length of sequences of consecutive nodes of the same frequency. This section discusses and presents some experimental results of their impact on the performance of FASE.
Each hop traversed by a random walk on a node not belonging to the desired frequency does not contribute to the success of the search or storage operation. Therefore, each node should be aware of at least one node in each frequency so that it is able to route any random walk to a suitable location.
Section 3.1 shows that a pointer of a key k is stored when a random walk passes from a node n with fN(n) 6= fK(k) to a node n′ with fN(n′) = fK(k). Because random walks are preferably forwarded to nodes with frequency fK(k), after storing a key, a random walk will visit a sequence of neighbors of its frequency before another copy is stored. In practice, this algorithm attempts to
Q1 Q2
Figure 1: A sequence of nodes with equal fN and the path followed by 3 random walks. 0 1000 2000 3000 4000 5000 6000 7000 8000 9000 10000 0.5 1 1.5 2 2.5 3 3.5 Hop Limit Degree/Frequency Query 90% (0.2%) Query 100% (0.2%) Query 90% (0.4%) Query 100% (0.4%) Replication (0.2%) Replication (0.4%)
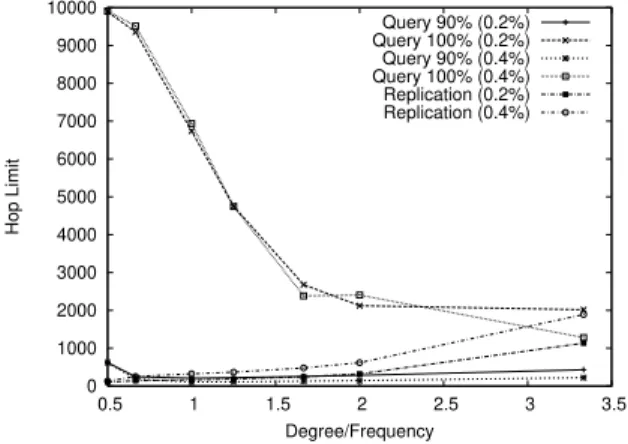
Figure 2: Degree/F requency ratio effect on query efficiency and replication costs.
store at most one pointer by each such sequence, knowing that a random walk searching for the key will also traverse the same sequence of nodes. Assume that sequences of these nodes are lines defined on the overlay, as depicted in Fig. 1. The figure shows in white the node storing a pointer to some object. Apparently, sequences should be as long as possible so that the number of pointers in proximity is reduced. However, we note that when a random walk enters such a sequence, it may not be routed to the correct direction. This is the example of the path followed by query Q1, which will not find the pointer stored in this sequence. In contrast, Q2 will find the pointer.
The size of the sequences and the probability of finding a node of each frequency in the neighborhood are mostly dictated by the ratio between the degree of the network and the number of frequencies. Let δ be this ratio.
Figure 2 shows the hop limit for 90% success and replication costs with δ varying from 0.5 (20 frequencies) to 3.3 (3 frequencies), for topologies with a constant degree = 10. The hop limit for 90% sucess is defined as the highest hop count to attain 90% of sucessful queries. Queries were performed using one random walk. Concerning replication, the figure refers to the number of messages used.
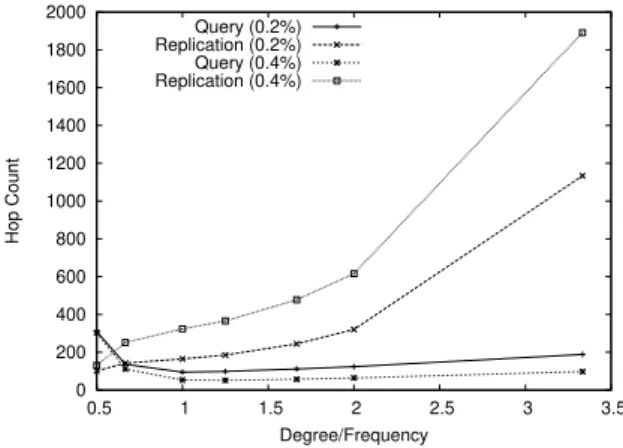
Figure 3 zooms in on the replication costs of the previous figure, and com-pares them with the average hop count. Notice the increase of replication costs for Degree/F requency above 2.
The figures confirm that the replication cost is affected by the length of the node sequences. With a higher δ, longer sequences of nodes with the same frequency need to be transversed and the number of replication messages in-creases. For 90% query success the hop count decreases in a pronounced way,
0 200 400 600 800 1000 1200 1400 1600 1800 2000 0.5 1 1.5 2 2.5 3 3.5 Hop Count Degree/Frequency Query (0.2%) Replication (0.2%) Query (0.4%) Replication (0.4%)
Figure 3: Average hop counts vs. Degree/F requency ratio.
from δ = 0.5 to δ = 1, it remains stable from δ = 1 to δ = 1.5, but it starts showing a slow increase from δ = 1.5 to δ = 3.3. We can see a decrease in the hop limit until the δ = [1.5, 2] interval is reached. With lower δ, the sequence lenght is reduced and, in the worst case, a query may find a different frequency every new hop, thus having to search most of the overlay to get a hit.
In the evaluation that follows, we present results for two degrees (10 and 30) and kept δ stable at 2. Although not presenting the best hop counts, this ratio was chosen because it strikes a good balance between replication costs and query hop count while allowing a high success ratio with a greatly improved hop count over lower values of δ.
5.2
Replication Costs
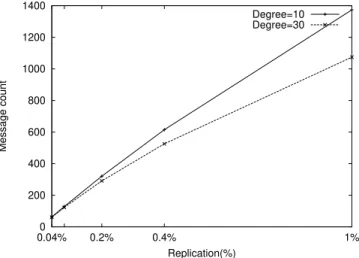
Figure 4 compares the number of replication messages used in low (10) and high (30) degree topologies. The figure shows that the replication cost has a linear increase. We define replication rate as the percentage of nodes in the overlay that contain a pointer to an item. For replication rates higher than 0.4%, the difference between 10 and 30 degree topologies is more pronounced but, considering the difference in degree, it is not significative.
In practice, the results present in Fig. 4 represent the cost of disseminating any number of data items of the same frequency using bloom filters as described in Sec. 4.1. An important result is that the cost of advertising will not grow linearly with the number of items advertised by each node as the number of messages will be bounded by the number of frequencies.
5.3
Query Efficiency
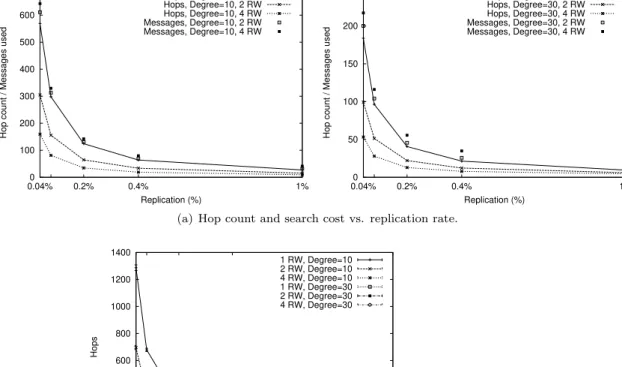
In Fig. 5(a) we compare the average hop count for all the queries with the number of messages used, for replication rates of 0.04%, 0.08%, 0.2%, 0.4% and 1%. The number of messages using a single random walk is equal to the hop count. In all test cases the success rate was 100%. While doubling the number of random walks lowers the hop count approximately by half, the number of messages used remains surprisingly close for all cases. In the worst case, for a
0 200 400 600 800 1000 1200 1400 0.04% 0.2% 0.4% 1% Message count Replication(%) Degree=10 Degree=30
Figure 4: Number of replication messages. Table 2: Simulation parameters for SQR. SQR
Degree 10 (constant); min=3, max=8
Replication (#replicas) 0.04% (8), 0.08% (16), 0.2% (40), 0.4% (80), 1% (200)
d 8
m 40960
k 32
replication rate of 0.04% in a network with degree = 10, the hop count using four random walks is approximately 400 hops lower than with one, with a message increase of only 75. With higher replication rates the number of messages used for 1, 2 and 4 random walks are even closer. With degree = 30 and 4 random walks the average hop count drops below 30 with only 16 (0.08%) replicas.
The average hop count varies from 569 hops to 5 hops. With four random walks and a 0.4% replication rate, which represent a search cost close to the case with only one random walk, in both 10 and 30 degree networks the average hop count is below 20 hops.
The hop limit for 90% success (Figure 5(b)) remains under 25 for all the cases using more than one random walk.
Clearly, using FASE with 1% replication has costs which make it less at-tractive compared with other algorithms. Notice that the number of replicas for frequency (200) with 15 frequencies represents 200 replicas for 1333 nodes, hence the extremely low hop count. In future work, we plan to address the problem of bounding the number of pointers when the number of frequencies is high and which results in an excessive number of replicas.
5.4
FASE vs SQR
Next, we present the results for SQR and compare them with FASE. Table 2 summarizes the parameters used in SQR simulations.
0 100 200 300 400 500 600 700 0.04% 0.2% 0.4% 1%
Hop count / Messages used
Replication (%) Hops, Degree=10, 1 RW Hops, Degree=10, 2 RW Hops, Degree=10, 4 RW Messages, Degree=10, 2 RW Messages, Degree=10, 4 RW 0 50 100 150 200 250 0.04% 0.2% 0.4% 1%
Hop count / Messages used
Replication (%) Hops, Degree=30, 1 RW Hops, Degree=30, 2 RW Hops, Degree=30, 4 RW Messages, Degree=30, 2 RW Messages, Degree=30, 4 RW
(a) Hop count and search cost vs. replication rate.
0 200 400 600 800 1000 1200 1400 0.04% 0.2% 0.4% 1% Hops Replication(%) 1 RW, Degree=10 2 RW, Degree=10 4 RW, Degree=10 1 RW, Degree=30 2 RW, Degree=30 4 RW, Degree=30
(b) Hop count limit for 90% success ratio.
Figure 5: Average hop count and hop count limit for 90% success rate. Figure 6 compares SQR and FASE average hop counts using various repli-cation rates, for a random topology, while Fig. 7 shows the results for a constant degree topology. Figures 8 and 9 present the results for hop count limit for 90% (8(a) and 9(a)) and 100% success rate (8(b) and 9(b)), for replication rates of 0.04%, 0.08%, 0.2%,0.4% and 1%. SQR results are compared with FASE re-sults for a constant degree = 10 topology using 4 random walks, for the same replication rates.
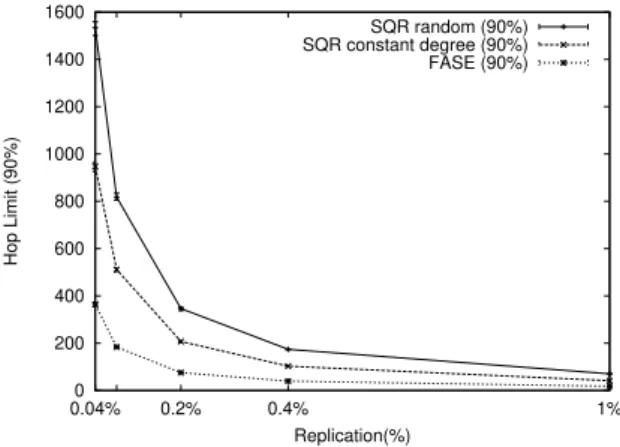
Figure 10 compares the results for 90% success presented in the previous figures.
For 100% success SQR shows a slight advantage, while FASE attains better hop counts at lower replication rates.
The comparison shows that a blind search algorithm like FASE can achieve comparable results against informed algorithms like SQR, without incurring in the later maintenance overhead. With an additional overhead, which can be high for higher replication rates but remains feasible for lower replication (considering the improved hop count), FASE can effectively improve the reachability of rare objects. If the number of replicas is low, FASE has an advantage over SQR
0 100 200 300 400 500 600 700 0.04% 0.2% 0.4% 1% Hop Count Replication(%) SQR (Avg.) FASE (Avg.)
Figure 6: SQR average hop count using a random topology with a degree distribution in the interval [3, 8].
0 50 100 150 200 250 300 350 400 450 0.04% 0.2% 0.4% 1% Hop Count Replication(%) SQR (Avg.) FASE (Avg.)
Figure 7: SQR average hop count using a constant degree topology. (see Fig. 6, 7 and 10).
6
Conclusion and Future Work
This paper presented FASE, a novel search algorithm over non-hierarchical unstructured overlays which combines a replication policy and a division of the search space to achieve scalable and efficient search using random walks. Simulation results show that our approach is comparable with other search systems for unstructured P2P networks. In this paper we have established FASE scalability, and evaluated costs and performance for finding items with a uniform query distribution.
As further work we plan to evaluate FASE performance under churn and with different item and query distributions. We believe that FASE can be improved as, depending on the popularity of an object, the replication costs can be reduced without losing search efficiency. The tradeoffs of using FASE under various topologies will also receive additional attention.
0 200 400 600 800 1000 1200 1400 1600 0.04% 0.2% 0.4% 1% Hop Count Replication(%) SQR (90%) FASE (90%)
(a) Hop limit for 90% success ratio.
0 2000 4000 6000 8000 10000 12000 0.04% 0.2% 0.4% 1% Hop Count Replication(%) SQR (100%) FASE (100%)
(b) Hop limit for 100% success ratio. Figure 8: SQR results using a random topology with a degree distribution in the interval [3, 8]. 0 100 200 300 400 500 600 700 800 900 1000 0.04% 0.2% 0.4% 1% Hop Count Replication(%) SQR (90%) FASE (90%)
(a) Hop limit for 90% success ratio.
0 1000 2000 3000 4000 5000 6000 7000 8000 0.04% 0.2% 0.4% 1% Hop Count Replication(%) SQR (100%) FASE (100%)
(b) Hop limit for 100% success ratio. Figure 9: SQR results using a constant degree topology.
References
[1] Rowstron, A., Druschel, P.: Pastry: Scalable, decentralized object loca-tion, and routing for large-scale peer-to-peer systems. Lecture Notes in Computer Science 2218 (2001) 329–350
[2] Stoica, I., Morris, R., Karger, D., Kaashoek, M.F., Balakrishnan, H.: Chord: A Scalable Peer-to-peer Lookup Service for Internet Applications. In: Proceedings of the ACM SIGCOMM ’01 Conference, San Diego, Cali-fornia (August 2001)
[3] Maymounkov, P., Mazieres, D.: Kademlia: A peer-to-peer information
system based on the XOR metric. Proceedings of the 1st International Workshop on Peer-to-Peer Systems (IPTPS ’02) 258 (2002) 263
[4] Clip2: The Gnutella Protocol Specification v0.4
http://www9.limewire.com/developer/gnutella protocol 0.4.pdf.
[5] Liang, J., Kumar, R., Ross, K.: The Kazaa Overlay: A Measurement
0 200 400 600 800 1000 1200 1400 1600 0.04% 0.2% 0.4% 1% Hop Limit (90%) Replication(%) SQR random (90%) SQR constant degree (90%) FASE (90%)
Figure 10: Comparison between FASE and SQR for 90% sucess. [6] Stutzbach, D., Rejaie, R., Sen, S.: Characterizing unstructured overlay
topologies in modern P2P file-sharing systems. In: IMC’05: Proceedings of the Internet Measurement Conference 2005 on Internet Measurement Conference, Berkeley, CA, USA, USENIX Association (2005) 5–5
[7] Saroiu, S., Gummadi, P., Gribble, S.: A Measurement Study of Peer-to-Peer File Sharing Systems. In: Proceedings of Multimedia Computing and Networking (MMCN ’02). (2002)
[8] Fessant, F., Handurukande, S., Kermarrec, A.M., Massouli´e, L.: Clustering in Peer-to-Peer File Sharing Workloads. In: Proceedings of the 3rd Inter-national Workshop on Peer-to-Peer Systems (IPTPS), San Diego, USA. (2004). (2004)
[9] Lv, Q., Cao, P., Cohen, E., Li, K., Shenker, S.: Search and Replication in Unstructured Peer-to-Peer Networks. In: ICS ’02: Proceedings of the 16th International Conference on Supercomputing. (2002) 84–95
[10] Tsoumakos, D., Roussopoulos, N.: Adaptive Probabilistic Search for Peer-to-Peer Networks. In: P2P ’03: Proceedings of the 3rd International Con-ference on Peer-to-Peer Computing. (2003)
[11] Broder, A., Mitzenmacher, M.: Network Aplications of Bloom Filters: A Survey. Internet Mathematics Vol. I, No. 4: 485-509 (2004)
[12] Kumar, A., Xu, J., Zegura, E.: Efficient and Scalable Query Routing for Unstructured Peer-to-Peer Networks. Proceedings IEEE INFOCOM 2005. 24th Annual Joint Conference of the IEEE Computer and Communications Societies. 2 (2005) 1162–1173
[13] Chawathe, Y., Ratnasamy, S., Breslau, L., Lanham, N., Shenker, S.: Mak-ing Gnutella-like P2P Systems Scalable. In: SIGCOMM ’03: ProceedMak-ings of the 2003 conference on Applications, Technologies, Architectures and Protocols for Computer Communications. (2003) 407–418
[14] Cholvi, V., Felber, P., Biersack, E.: Efficient Search in Unstructured Peer-to-Peer Networks. In: SPAA ’04: Proceedings of the Sixteenth Annual
ACM Symposium on Parallelism in Algorithms and Architectures. (2004) 271–272
[15] Leit˜ao, J., Pereira, J., Rodrigues, L.: Hyparview: a membership pro-tocol for reliable gossip-based broadcast. In: Proceedings of the 37th Annual IEEE/IFIP International Conference on Dependable Systems and Networks, Edinburgh, UK (June 2007) 419–429
[16] M Jelasity, A Montresor, G.P.J.: PeerSim: A Peer-to-Peer Simulator http://peersim.sourceforge.net.
![Figure 6: SQR average hop count using a random topology with a degree distribution in the interval [3, 8].](https://thumb-eu.123doks.com/thumbv2/123dok_br/15470544.1034112/15.892.289.595.190.419/figure-average-count-random-topology-degree-distribution-interval.webp)
![Figure 8: SQR results using a random topology with a degree distribution in the interval [3, 8]](https://thumb-eu.123doks.com/thumbv2/123dok_br/15470544.1034112/16.892.188.692.200.389/figure-results-using-random-topology-degree-distribution-interval.webp)