Article
*e-mail: [email protected]
Comparison of Diode Array and Electrochemical Detection
in the C
30Reverse Phase HPLC Analysis of Algae Carotenoids
Thais Guaratini,a Karina H. M. Cardozo,a,b Ernani Pintoc and Pio Colepicolo*,a
aDepartamento de Bioquímica, Instituto de Química - USP, Av. Professor Lineu Prestes 748,
CP 20780, 05508-900 São Paulo-SP, Brazil
bFleury Medicina e Saúde, Av. General Valdomiro de Lima 508, 04344-070 São Paulo-SP, Brazil
cDepartamento de Análises Clínicas e Toxicológicas, Faculdade de Ciências Farmacêuticas - USP,
Av Professor Lineu Prestes 580, 05508-900 São Paulo-SP, Brazil
A determinação qualitativa e quantitativa de carotenóides pode fornecer diferentes e importantes informações sobre os organismos que os contêm. Na análise de pigmentos por HPLC diversos detectores podem ser utilizados, como diode array (DAD) e eletroquímico (ED). O presente trabalho tem como objetivo desenvolver um método por HPLC utilizando uma coluna C30 para a identiicação e quantiicação de dezesseis pigmentos em diferentes classes de algas, além de comparar as respostas obtidas nos detectores DAD e ED por meio da análise dos resultados de precisão e exatidão. Apesar do ED ser geralmente um detector mais sensível que o DAD, os resultados de precisão e exatidão foram mais satisfatórios para o DAD. O método desenvolvido foi eiciente para a análise quantitativa dos pigmentos de cianobactérias e diferentes classes de algas, sendo que o padrão cromatográico encontrado em cada classe foi discutido.
Qualitative and quantitative determination of carotenoids pigments can provide valuable information about the organisms in which this important class of compounds is found. In the HPLC analysis of pigments, diode array (DAD), electrochemical (ED) and other kinds of detector may be used. The aim of this work is to develop an HPLC method using a C30 column to identify and quantify sixteen different pigments from algae. A further aim is to compare precision and accuracy obtained by DAD and ED. ED is normally more sensible than DAD. On the other hand, the highest precision and accuracy was obtained with DAD. In conclusion, the method was eficient for quantitative and qualitative analyses of pigments from cyanobacteria and different microalgae classes. Their pigment patterns for several organisms are also discussed.
Keywords: carotenoids, chlorophylls, HPLC-DAD, HPLC-ED, algae
Introduction
Carotenoids are pigments found mostly in plants and algae. Their biological function in these organisms is to act as antioxidants,1,2 membrane stabilizers3,4 and light
harvesters in photosynthetic organisms.5 More than 700
natural carotenoids from different sources have been isolated and chemically characterized. They are derived
from the same basic C40 isoprenoid skeleton.6,7 Algae, in
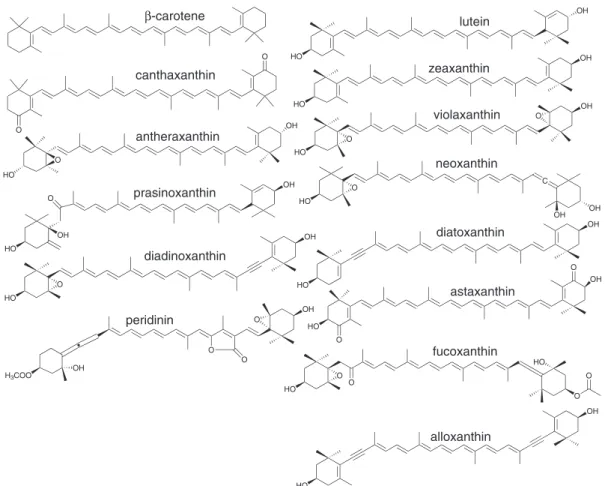
particular, have several structurally different pigments in their photosynthetic apparatus (Figure 1) making them an important and sometimes unique commercial source
of carotenoids.1 Moreover, the carotenoid proile in algae
may provide information about their photoacclimation,
photoprotection responses,8,9 phylagenetic distribution10 and
serve as important biomarkers of environmental impacts.11,12
Alternative methods to detect and quantify these pigments in other different matrixes are also valuable tools for
investigating their biological activity and bioavailability.13
Due to improved separation efficiency, carotenoid analyses are routinely performed by reversed-phase HPLC. Many methods for the separation of pigments from algae
have been developed.14,15 However, the complexity of their
composition makes the resolution of all pigments from
different algae species dificult in a single run method.16
of purity of all peaks, since carotenoids are structurally similar. Consequently, in order to obtain a wide range of information, several methods with different detectors are available in the literature. The diode array detector (DAD) is by far the most common detector used in carotenoids analyses, as it makes use of the absorption properties of these compounds in the visible region. DAD can also furnish some structural information for analyte identiication. This characteristic makes DAD an important tool for characterization, since the spectrum associated with a given retention time can be compared
with known analytical standard proiles.17 However, spectra
of carotenoids cannot be used as conclusive evidence of structure, since many carotenoids present very similar absorption proiles. Moreover, the detection limit of DAD
can be a major disadvantage.17 Accordingly, other detectors,
notably the electrochemical detector (ED) have been used to counter the disadvantages of the DAD. ED is based on the oxidation and reduction properties of analytes. Since carotenoids are electroactive, the HPLC-ED system can be
another option for their analysis.18-20
Since carotenoids can be analyzed by either an electrochemical or a diode array detector, the aim of this work was to develop an HPLC method to identify and
quantify sixteen carotenoids and chlorophylls from algae
using a C30 column and to compare the precision and
accuracy values and overall performance obtained with DAD and ED.
Experimental
Materials
All solvents were HPLC or reagent grade, from Sigma Chemical Company (St. Louis, USA), Tedia (São Paulo, Brazil) and Mallinckrodt (Paris, USA). Deionized water was obtained using a Milli-Q water puriication system (Millipore, Bedford, USA). Stock solutions of alloxanthin
(1.04 mg L−1), antheraxanthin (0.625 mg L−1), canthaxanthin
(0.559 mg L−1), diadinoxanthin (1.197 mg L−1), diatoxanthin
(0.935 mg L−1), fucoxanthin (1.438 mg L−1), lutein
(1.296 mg L−1), neoxanthin (1.137 mg L−1), peridinin
(0.984 mg L−1), prasinoxanthin (1.281 mg L−1), violaxanthin
(0.814 mg L−1), and zeaxanthin (0.591 mg L−1) in
ethanol were purchased from DHI Water & Environment
(Copenhagen, Denmark) and stored at −80 oC. β-carotene,
astaxanthin and chlorophyll a and b were purchased from
Sigma (St. Louis, USA). Figure 1. Structure of the carotenoids studied.
O
O
HO OH
HO
HO
O
C
OH
O HO
O O
OH
HO O
O β-carotene
canthaxanthin
lutein
zeaxanthin
antheraxanthin
violaxanthin
neoxanthin
astaxanthin
fucoxanthin peridinin
prasinoxanthin
diatoxanthin
alloxanthin diadinoxanthin
OH
OH
HO
HO
OH
H3COO
OH
OH O
OH
O
OH
HO O
OH OH
HO
OH
O O
HO
HO
O O O
HO O
Instrumentation and chromatography
The HPLC instrument consisted of a SCL-10AVP
Shimadzu system equipped with two LC-10AD pumps,
a SIL-10ADVP automatic sample injector, a DGU-14A
degasser, and a SPD-M10AVP photodiode-array detector.
The Coulochem III ED (ESA Inc., Chelmsford, MA) was coupled in series with the photodiode-array detector and consisted of a guard cell (Model 5021) and an analytical cell (Model 5010) with two porous graphite working electrodes, palladium reference electrodes and platinum counter electrodes.
Chromatographic separations were carried out on a C30
column (Ultracarb, 250 x 4.6 mm, 5 µm, Phenomenex) at
1.0 mL min−1 and room temperature, using as mobile phase:
(A) MeOH:H2O:NH4Ac buffer 1 mol L−1 (pH 4.6) (90:8:2)
and (B) MeOH:MTBE:NH4Ac buffer 1 mol L−1 (pH 4.6)
(30:68:2). The gradient elution was performed as follows: a linear increase from 5 to 10% of solvent B (0-15 min); maintaining 10% B for 10 min; a linear gradient (10 min) to 15% B followed by another linear gradient (5 min) to 40% B and then an increase to 45% of solvent B in 2 min, an isocratic elution for 20 min and an increase to 100% B in 1 min and maintaining 100% B for 5 min, for a total run time of 68 min.
The chromatographic parameters, capacity factor (k)
and separation factor (α) were calculated to evaluate the
separation eficiency. The injection volume of standards
and samples was 50 µL and all ultraviolet-visible spectra
were recorded from 200 to 800 nm. For quantitative analyses chromatograms were integrated at 445 nm. The ED was operated in the DC-mode and the settings were as follows: +850 mV at the guard channel (to improve the baseline signal by oxidizing interfering compounds possibly present in the mobile phase) and +600 mV at the irst cell (channel 1). For confection of hydrodynamic voltammograms, data were acquired in channel 1, which was set at different potentials in each run (+100 to +900 mV, in 50 mV increments).
Sample preparation
Non-axenic cultures of Prorocentrum minimum
(Pavillard) (Proro.min.-C2) (Dinophyceae), Minutocellus
polymorphus (Hargraves and Guillard) Hasle, von Stosch and
Syvertsen (Min.poly-CF1) (Bacillariophyceae), Isochrysis
galbana Parke (Iso.g.-USA1) (Prymnesiophyceae), Tetraselmis gracilis (Kylin) Butcher (Tetra.g.-C1)
(Prasinophyceae), Hillea sp. (Hil.-PB1) (Cryptophyceae),
and Synechococcus lividus Copeland (Syn.liv.-C1)
(Cianophyceae) were obtained from the Culture Collection
of the Oceanographic Institute of the University of São Paulo (Brazil). The cultures were grown in Guillard f/2
medium21 at 20 ± 1 °C on a 12 h light / 12 h dark cycle
with cool-white fluorescent light at an irradiance of
120 µmol photons m−2 s−2. Light intensity was measured
by a Biospherical Instrument QSL 100 photometer with a 4p scalar sensor. Samples were collected in the exponential phase at midday, ground with liquid nitrogen and dried
in a speed-vacuum (SpeedVac, Savant, City, USA).
The homogeneous, freeze-dried samples were weighed, dissolved in methanol:acetone (1:1, v/v) and sonicated for 15 min. The extracts were then centrifuged and iltered
through a 0.45 µm membrane (Millex HN nylon, 13 mm,
Millipore). Aliquots (50 µL) of each extract (3 mg mL-1)
were injected into the HPLC system. The pigment content
was expressed as µg per mg of dried weight (µg mg−1 DW).
Peak identiication
Most peaks were identified according to the characteristics of their electronic absorption spectra and chromatographic retention times by comparing retention times with those of the corresponding standards.
Quantitative analysis
Calibration was performed using dilutions of stock standard solutions. The respective peak areas obtained in the DAD (445 nm) and in the irst channel of the ED
(+ 600 mV) were plotted vs. the nominal concentrations.
For precision assays, samples with the same concentration were analyzed five times and the intra-assay relative standard deviation (RSD) was calculated. The inter-assay RSD was determined by analyzing the samples on ive different days. The intra- and inter-assay accuracy was evaluated by assessing the agreement between the measured and nominal concentrations of the analytes.
Results and Discussion
Many methods are available in the literature for analysis and quantification of carotenoids and chlorophylls in different matrices due to the importance and applicability
of these compounds.14-16,22-24 The C
30 stationary phase
has been widely used for carotenoid separations since, in general, it provides signiicant resolution of complex
mixtures.22,23 In addition to the column selection, mobile
phase choice is extremely important. In the case of ED, the presence of an electrolyte is required. Hence, researchers have employed mobile phases containing salt or buffer
(pH 4.6) (95:3:2) and MeOH:MTBE:acetate buffer
1 mol L−1 (pH 4.6) (25:73:2)24 or 13.44 mmol L−1 lithium
perchlorate in MeOH:EtOH:2-propanol (88:24:10).19 In the
present work, we chose to use ammonium acetate (NH4Ac)
buffer, which reduces losses or degradation by minimizing the acidity effects of the free silanol groups present in the
derivative silica stationary-phase.17 After testing different
mobile phases and elution gradients, the most suitable was the method described in the experimental section. This method was able to resolve a total of sixteen pigments.
Retention times, separation (α) and capacity (k) factors are
presented in Table 1. A good selectivity of mobile phase for all the peaks was attained as indicated by the separation values higher than 1. Low capacity factor values indicate low retention in the stationary phase, while the longer the analyte is retained, the greater capacity factor and consequently, the longer total run time. The capacity factors between 0.5 and 20 indicate that a proper solvent strength
was maintained throughout the analysis.25, 26 Capacity
factor values higher than 20, which were observed for some analytes, are consistent with the long total run time.
In addition to DAD, another possible technique for carotenoid analysis is ED, which detects the electroactivity
of a compound.27 In order to determine the potential of
maximum response and thus improve the selectivity and sensitivity, each standard was injected into the HPLC system
and analyzed by varying the applied potential in each run.28
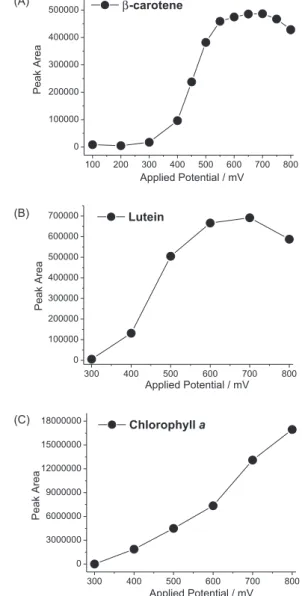
With these data, it was possible to obtain hydrodynamic
voltammograms, as shown in Figure 2 for β-carotene, lutein
and chlorophyll a. In a previous study, Ferruzzi et al.24
determined the maximum response for several carotenoids and obtained somewhat different results using a system with an array of electrochemical cells (8, 12 or 16 channels) connected in series. This multi-channel system offers the possibility of obtaining the hydrodynamic voltammograms in a single run. However, the maximum response can be underestimated if not submitted to mathematical corrections. Oxidations and reductions in the electrochemical cells are not reversible processes and each species has its own
intrinsic redox potential.29-30 When using electrochemical
cells in series, increasing potentials are applied. If the irst cell detects the analyte, the next cell will detect a smaller quantity of sample. Consequently, the resultant signal will
Table 1. Peak number (Pn), retention time (Rt), maximum wavelength (λmax), capacity factor (k) and separation factor (α) between peaks (indicated in parenthesis) of standard pigments analysis obtained by HPLC-DAD (445 nm)
Pigments Pn Rt/min λmax / nm k α
Peridinin 1 7.3 475 2.5 1.7 (1/2)
Fucoxanthin 2 10.9 450 4.2 1.2 (2/3)
Neoxanthin 3 12.8 435 5.1 1.2 (3/4)
Prasinoxanthin 4 15.4 459 6.3 1.1 (4/5)
Violaxanthin 5 17.1 438 7.1 1.3 (5/6)
Astaxanthin 6 21.2 476 9.1 1.1 (6/7)
Diadinoxanthin 7 22.9 445 9.9 1.2 (7/8)
Antheraxanthin 8 26.5 445 11.6 1.2 (8/9)
Alloxanthin 9 30.5 451 13.5 1.2 (9/10)
Diatoxanthin 10 36.2 450 16.2 1.1 (10/11)
Lutein 11 38.3 445 17.2 1.0 (11/12)
Zeaxanthin 12 40.1 450 18.1 1.1 (12/13)
Canthaxanthin 13 44.8 474 20.3 1.1 (13/14)
Chlorophyll b 14 48.9 459 22.3 1.2 (14/15) Chlorophyll a 15 56.5 420 25.9 1.2 (15/16)
β-carotene 16 66.8 451 30.8
be the real response minus the response in the previous cell and so on for the other cells. Thus, the maximum response is not exactly what would be obtained if only one electrode, operating at the exact redox potential of the analyte, were
employed. For example, the potential in which β-carotene
presented maximum response in a multi-channel system was approximately 340 mV and in a one channel system the maximum response was at 600 mV. Furthermore, the oxidation potential of lutein maximum response was 400 and
650 mV, respectively.24 Although the use of electrochemical
cells connected in series is very useful for a wide dynamic
range of analyses,31 including those with completely different
redox potentials, an undesirable decrease in the sensitivity of the method can occur when the redox potentials cover only a narrow range of potentials.
Since the carotenoids and chlorophylls tested herein exhibited maximum responses at similar potentials, a potential of + 600 mV was used in the irst cell to obtain analytical curves, precision and accuracy parameters. For DAD analysis, the wavelength selected was 445 nm.
Chromatograms of β-carotene, lutein and chlorophyll a
obtained at the same run in both detectors are presented in Figure 3. Peak Area Ratio (P.A.R.) between DAD and ED responses showed a higher peak for all carotenoids
by DAD than by ED, as shown for β-carotene and lutein
in Figure 3. On the other hand, chlorophylls were more responsive to ED than to DAD. Although chlorophylls absorb at 445 nm, the highest absorption wavelength of
chlorophyll a is at approximately 420 nm (spectra shown
in Figure 3), resulting in a more intense signal at ED and a much lower absorption at 445 nm.
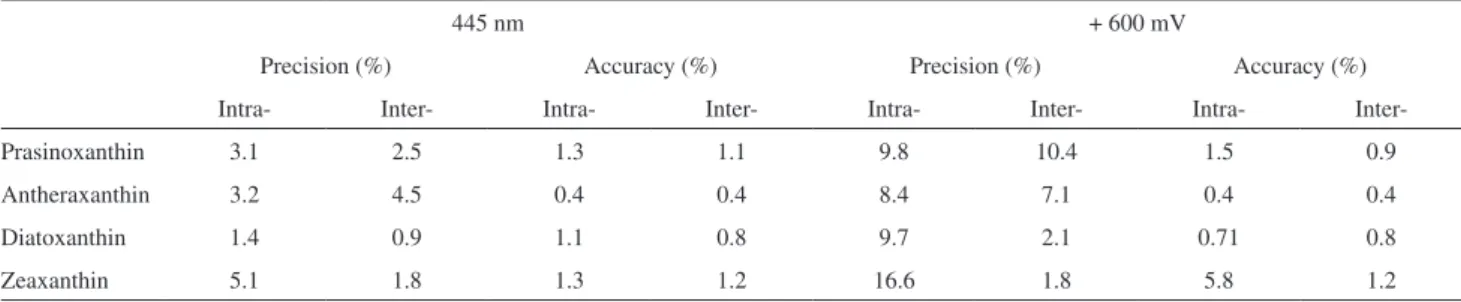
In the quantiication of algal carotenoids, analytical curves were constructed by injecting different concentrations of each pigment. Curves were constructed using both DAD (445 nm) and ED (+ 600 mV) data. Intra- and inter-day precision and accuracy were also calculated for all pigments using the results obtained with both detectors (Table 2).
Comparing the results obtained, it is possible to conclude that, in this case, the DAD exhibited higher precision and accuracy than ED (Table 2). ED is normally more sensitive than DAD. However, for analytes exhibiting high molar extinction coeficients, such as the carotenoids, DAD may be a more sensitive detector and may improve the precision and accuracy of the detection. Indeed, the results obtained by both HPLC coupled DAD and ED showed that the light absorbing properties of the carotenoids provide a better detection performance than their electroanalytical properties. Although carotenoids are easily oxidized at + 600 mV, our data suggest that their electroanalytical properties are less optimal for detection.
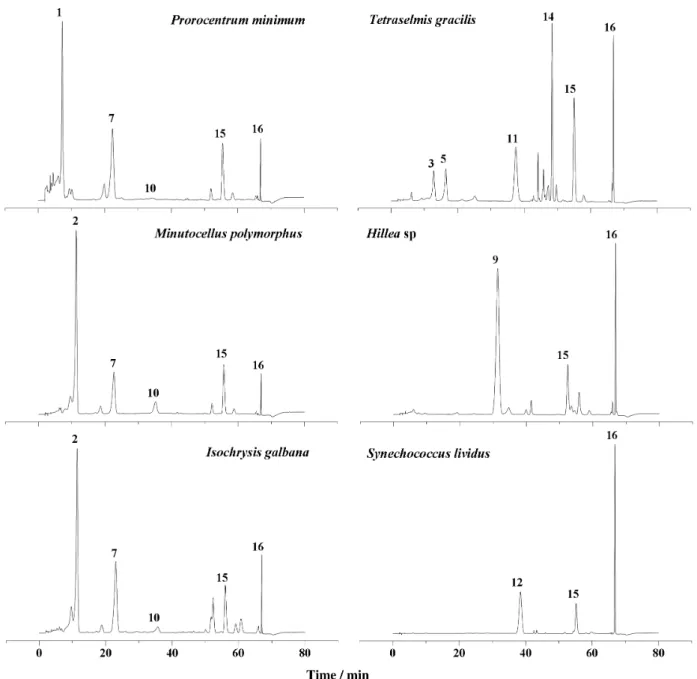
The HPLC-DAD chromatograms of pigment extracts from the six species of marine phytoplankton are shown in
Figure 4. The pigments β-carotene and chlorophyll a are
present in all algae studied (Figure 4 and Table 3). It is known that extraction conditions can interfere in the chromatogram proile due to differences in the polarity of carotenoids.32 Using
our extraction protocol, peridinin and diadinoxanthin were the
main carotenoids identiied in the dinolagellate Prorocentrum
minimum (Table 3). These pigments are typically found in this
class of marine microalgae.33,34 The chromatogram obtained
for the diatom Minutocellus polymorphus showed one major
peak, which was further identiied as fucoxanthin (Figure 4) and two lower intensity peaks, identiied as diadinoxanthin
and diatoxanthin. Likewise, Sigaud-Kutner et al.35 found the
Table 2. Intra- and inter-day precision and accuracy (n = 5) assays of representative pigments. Data obtained from DAD (445 nm) and ECD (+ 600 mV)
445 nm + 600 mV
Precision (%) Accuracy (%) Precision (%) Accuracy (%)
Intra- Inter- Intra- Inter- Intra- Inter- Intra-
Inter-Prasinoxanthin 3.1 2.5 1.3 1.1 9.8 10.4 1.5 0.9
Antheraxanthin 3.2 4.5 0.4 0.4 8.4 7.1 0.4 0.4
Diatoxanthin 1.4 0.9 1.1 0.8 9.7 2.1 0.71 0.8
Zeaxanthin 5.1 1.8 1.3 1.2 16.6 1.8 5.8 1.2
Figure 4. HPLC-DAD (445 nm) chromatograms of pigments from cyanobacteria and different microalgae. Chromatographic conditions are described in the text and peaks are identiied in Tables 1 and 3.
same pattern of pigments in this species. Additionally, the xanthophylls fucoxanthin, diadinoxanthin and diatoxanthin
were also present in the prymnesiophyceae Isochrysis
galbana. Previous studies showed that this species contains
other pigments such as chlorophyllide a, chlorophyll c1 and
c
2, β-carotene. 36
According to Egeland et al.37 prasinophytes may contain
either pigments similar to those produced by common green
algae (β-carotene, lutein, zeaxanthin and the epoxides
violaxanthin and neoxanthin) or carotenoids unique to this algal class (prasinoxanthin, anhydroprasinoxanthin, uriolide, anhydrouriolide, micromonal, anhydromicromonal, micromonol, anhydromicromonol and dihydrolutein),
where prasinoxanthin is the most abundant carotenoid.
In our Tetraselmis gracilis (Prasinophyceae)strain, the
carotenoids neoxanthin, violaxanthin and lutein were
detected and the concentrations estimated. Chlorophyll b
was also identiied in T. gracilis.
The genus Cryptophyta displays two acetylenic
class-speciic marker compounds alloxanthin and monadoxanthin,
plus crocoxanthin, chlorophyll a and c
2, zeaxanthin, and
α- and β-carotene. Alloxanthin is very often the most abundant
carotenoid.38 Our strain of Hillea sp (Cryptophyceae)
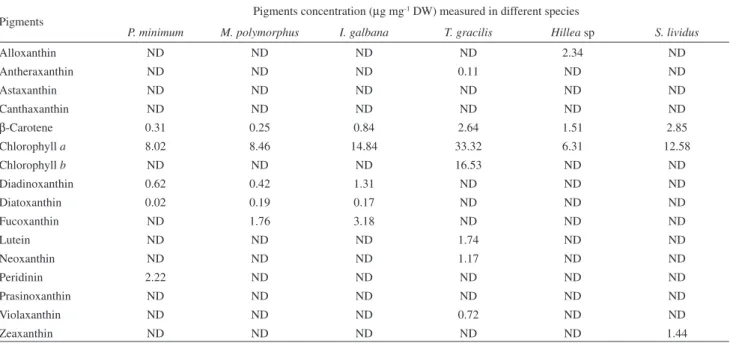
Table 3. Quantiication of the pigments present in algae measured by comparison to external standards using HPLC-DAD (445 nm)
Pigments Pigments concentration (µg mg
-1 DW) measured in different species
P. minimum M. polymorphus I. galbana T. gracilis Hillea sp S. lividus
Alloxanthin ND ND ND ND 2.34 ND
Antheraxanthin ND ND ND 0.11 ND ND
Astaxanthin ND ND ND ND ND ND
Canthaxanthin ND ND ND ND ND ND
β-Carotene 0.31 0.25 0.84 2.64 1.51 2.85
Chlorophyll a 8.02 8.46 14.84 33.32 6.31 12.58
Chlorophyll b ND ND ND 16.53 ND ND
Diadinoxanthin 0.62 0.42 1.31 ND ND ND
Diatoxanthin 0.02 0.19 0.17 ND ND ND
Fucoxanthin ND 1.76 3.18 ND ND ND
Lutein ND ND ND 1.74 ND ND
Neoxanthin ND ND ND 1.17 ND ND
Peridinin 2.22 ND ND ND ND ND
Prasinoxanthin ND ND ND ND ND ND
Violaxanthin ND ND ND 0.72 ND ND
Zeaxanthin ND ND ND ND ND 1.44
* The absence of a pigment was indicated as not detected (ND).
A peculiarity of freshwater cyanobacteria is the presence of the primary ketocarotenoids canthaxanthin and echinenone and the monocyclic carotenoid-glycoside myxoxanthophyll. The later is typical of many freshwater cyanoprokaryota and apparently is a class-speciic pigment
since it has not been detected in eukaryotic algae up to date.38
However, under conditions used by us, these pigments were not detected. It is also known that cyanobacteria are not
capable of ε-ring biosynthesis;39 therefore, α-carotene and
lutein are not found. Instead, zeaxanthin and β-carotene
are always present in this group. Indeed, in our cultures of
Synechococcus lividus (Cianophyceae), zeaxanthin was
detected as the major carotenoid (Figure 4 and Table 3).
Conclusion
This manuscript reports a new method for the HPLC analysis of carotenoids and chlorophylls. Results obtained using two different detectors were compared and better accuracy and precision was observed for HPLC-DAD. The method was eficiently applied to quantitative and qualitative analyses of different algal species and should prove a powerful tool for monitoring of pigments in complex matrices.
Acknowledgements
The authors thank FAPESP (Fundação de Amparo à Pesquisa do Estado de São Paulo), CAPES (Coordenação de Aperfeiçoamento de Pessoal de Nível Superior),
CNPq (Conselho Nacional de Desenvolvimento Cientíico e Tecnológico) and Milênio-Redoxoma for fellowships and inancial support. Drs. Norberto Lopes (FCFRP-USP) and Mauricio Yonamine (FCF-USP) contributed with helpful comments and discussions. Finally, the authors also thank Dr. Adrian Pohlit for suggestions and text editing.
References
1. Cardozo, K. H. M.; Guaratini, T.; Barros, M. P.; Falcão, V. R.; Tonon, A. P.; Lopes, N. P.; Campos, S.; Torres, M. A.; Souza, A. O.; Colepicolo, P.; Pinto, E.; Comp. Biochem. Physiol., Part C: Toxicol. Pharmacol.2007, 146, 60.
2. Guaratini, T.; Medeiros, M. H. G.; Colepicolo, P.; Quim. Nova
2007, 30, 206.
3. Havaux, M.; Trends Plant Sci.1996, 3, 147.
4. Barros, M. P.; Pinto, E.; Colepicolo, P.; Pedersen, M.; Biochem. Biophys. Res. Commun.2001, 288, 225.
5. Holt, N. E.; Zigmantas, D.; Valkunas, L.; Li, X. P.; Niyogi, K. K.; Fleming, G. R.; Science2005, 307, 433.
6. Fraser, P. D.; Bramley, P. M.; Prog. Lipid Res.2004, 43, 228. 7. van den Berg, H.; Faulks, R.; Granado, H. F.; Hirschberg, J.;
Olmedilla, B.; Sandmann, G.; Southon, S.; Stahl, W.; J. Sci. Food Agric.2000, 80, 880.
8. Rodriguez, F.; Chauton, M.; Johnsen, G.; Andresen, K.; Olsen, L. M.; Zapata, M.; Mar. Biol.2006, 148, 963.
9. Schubert, N.; Garcia-Mendonza, E.; J. Phycol. 2008, 44, 1437. 10. Tran, D.; Haven, J.; Qiu, W. G.; Polle, J. E. W.; Planta 2009,
11. Hollnagel, H. C.; Di Mascio, P.; Asano, C. S.; Okamoto, O. K.; Stringher, C. G.; Oliveira, M. C.; Colepicolo, P.; Braz. J. Med. Biol. Res.1996, 29, 105.
12. Bjørnland, T.; Haxo, F. T.; Liaaen-Jensen, S.; Biochem. Syst. Ecol.2003, 31, 1147.
13. Nakagawa, K.; Kiko, T.; Hatade, K.; Asai, A.; Kimura, F.; Sookwong, P.; Tsuduki, T.; Arai, H.; Miyazawa, T.; Anal. Biochem. 2008, 381, 129.
14. Cardozo, K. H. M.; Oliveira, M. A. L.; Tavares, M. F. M.; Colepicolo, P.; Pinto, E.; Biol. Rhythm Res.2002, 33, 371. 15. Di Mascio, P.; Hollnagel, H. C.; Sperança, M.; Colepicolo, P.;
Biol. Chem.1995, 376, 297.
16. Yuan, J. P.; Gong, X. D.; Chen, F.; J. Agric. Food Chem.1997, 45, 1952.
17. Feltl, L.; Pacáková, V.; Štulík, K.; Volka, K.; Curr. Anal. Chem.
2005, 1, 93.
18. Liu, D.; Gao, Y.; Kispert, L. D.; J. Electroanal. Chem.2000, 488, 140.
19. Finckh, B.; Kontush, A.; Commentz, J.; Hübner, C.; Burdelski, M.; Kohlschütter, A.; Anal. Biochem.1995, 232, 210. 20. Hermans, N.; Cos, P.; Berghe, D. V.; Vlietinck, A. J.; Bruyne,
T. J. Chromatogr., B 2005, 822, 33.
21. Guillard, R. R. L. In Culture of Marine Invertebrate Animals; Smith, W. L.; Chanley, M. H., eds.; Plenum Publishing Corporation: New York, 1975.
22. Sander, L. C.; Sharpless, K. E.; Pursch, M.; J. Chromatogr., A
2000, 880, 189.
23. Schlatterer, J.; Breithaupt, D. E.; J. Agric. Food Chem. 2006,
54, 2267.
24. Ferruzzi, M. G.; Sander, L. C.; Rock, C. L.; Schwartz, S. J.; Anal. Biochem.1998, 256, 74.
25. Dolan, J. W.; LCGC1990, 5, 1030.
26. Inbaraj, B. S.; Chien, J. T.; Chen, B. H.; J. Chromatogr., A2006, 1102, 193.
27. Frank, H. A.; Brudvig, G. W.; Biochemistry 2004, 43, 8607. 28. Andreoli, R.; Careri, M.; Manini, P.; Mori, G.; Musci, M.;
Chromatographia1997, 44, 605.
29. Guaratini, T.; Vessecchi, R. L.; Lavarda, F. C.; Campos, P. M. B. G. M.; Naal, Z.; Gates, P. J.; Lopes, N. P.; Analyst2004, 129, 1223.
30. Guaratini, T.; Vessecchi, R.; Pinto, E.; Colepicolo, P.; Lopes, N. P.; J. Mass Spectrom.2005, 40, 963.
31. Castro-Gamboa, I.; Cavalheiro, A. J.; Cardoso, C. L.; Silva, D. H. S.; Furlan, M.; Bolzani, V. S.; J. Braz. Chem. Soc.2003, 14, 771.
32. Szymczak-Zyła, M.; Louda, J. W.; Kowalewska, G.; J. Liq. Chromatogr. Relat. Technol.2008, 31, 1162.
33. Wright, S. W.; Jeffrey, S. W.; Mantoura, R. F. C.; Llewellyn, C. A.; Bjørnland, T.; Repeta, D.; Welschmeyer, N.; Mar. Ecol. Prog. Ser.1991, 77, 183.
34. Jeffrey, S. W. In Phytoplankton Pigments in Oceanography: Guidelines to Modern Methods; Jeffrey, S. W.; Mantoura, R. F. C.; Wright, S. W.; eds.; Unesco Publishing: Paris, 1997. 35. Sigaud-Kutner, T. C. S.; Pinto, E.; Okamoto, O. K.; Latorre, L.
R.; Colepicolo, P.; Physiol. Plant.2002, 114, 566. 36. Zapata, M.; Garrido, J. L.; J. Phycol.1997, 33, 209.
37. Egeland, E. S.; Eikrem, W.; Throndsen, J.; Wilhelm, C.; Zapata, M.; Liaaen-Jensen, S.; Biochem. Syst. Ecol.1995, 23, 747. 38. Schagerl, M.; Donabaum, K.; Int. J. Limnol.2003, 39, 35. 39. Armstrong, G. A.; Hearst, J. E.; FASEB J.1996, 10, 228.
Received: November 18, 2008
Web Release Date: September 4, 2009