Article
0103 - 5053 $6.00+0.00*e-mail: [email protected]
#Present address: Natural Sciences, Health and Wellness, Miami Dade
College, 300 N. E. 2nd Avenue, Miami Florida, 33132 USA
Can Factor Analysis be Applied to Spectra Taken in Binary Solvent Mixtures?
Thalyta S. Thurler,a Raquel G. S. da Souza,a Marcel Maeder,b Sarah E. Normanb and Ira M. Brinn*,a,#
aInstituto de Química, Universidade Federal do Rio de Janeiro, Ilha do Fundão, CP 68.563,
21945-970 Rio de Janeiro-RJ, Brazil
bDepartment of Chemistry, University of Newcastle, Callaghan, NSW, 2308, Australia
Sugere-se aqui que, apesar das inconsistências lógicas, o método de análise fatorial pode ser aplicado, em muitos casos, aos espectros de luorescência e absorção de sistemas de corantes em solventes binários. Os limites para a aplicação bem sucedida do método são derivados. A idéia foi aplicada aos sistemas de quatro corantes em duas soluções diferentes de solvente binário. Os resultados obtidos indicaram que este método geralmente gerava curvas mais lisas, num gráico de contribuição de uma das duas bandas contribuintes aos espectros experimentais contra a fração molar de um dos solventes, quando comparado com o método normalmente utilizado de graicar a posição do pico máximo contra a fração molar de um dos solventes.
It is suggested that, in spite the logical inconsistencies, factor analysis can be applied in many cases to luorescence and absorption spectra of dyes in binary solvent mixtures. Limits as to when this application will be successful are derived. This idea was applied to four different dyes in two different binary solvent mixtures and was generally found to generate smoother curves, plotting the contribution of one of the two contributing bands to the experimental spectrum vs. solvent component mole fraction, as compared to those that are generated when one uses the normally applied method of plotting maximum peak position vs. solvent component mole fraction.
Keywords: binary solvents, factor analysis, absorption spectra, luorescence spectra
Introduction
Although the great majority of studies of solutions in the chemical laboratory are done on solutes dissolved in pure (to the extent that they can be attained practically) solvents, most solutions encountered in nature are considerably more complex. Thus, the importance of studying binary (and higher order) solvent systems is obvious. A major question which comes up in these studies is to what extent is there preferential solvation by one of the solvents, which can be related to the speciic solute-solvent and solvent-solvent1
interactions as well as dipole-dipole interactions, the latter being quite general. These are measured most often by plotting curves of some spectroscopic2 property (maximum
wavelength, peak height, etc.) of an added probe against mole fraction of one of the solvents. However, the apparent
interpretation of the data often varies3 with the particular
spectroscopic property and molecular probe used. This is not surprising, as each spectroscopic property is affected in a different manner by the solute-solvent interactions. In addition, when using luorescence spectroscopy, as compared to normal electronic absorption spectroscopy, time-dependent4 behavior must sometimes be considered.
An alternative approach that has been applied5 is to
eliminate the probe molecule and study the vibrational spectra of one of the solvents, either through Raman or infrared spectroscopy. Such methods are more limited in that they furnish only information on solvent-solvent interactions, however not solute-solvent interactions.
molecules. The spectrum observed should then be a linear combination of the two spectra, X in pure A and X in pure B. And applying factor analysis to a series of these spectra should generate the two deconvoluted spectra characteristic of X in the pure solvents and the fractional contribution of each in each of the experimental spectra. This model suffers from the fact that it is not expected to be the general case, even though it might hold for certain data sets.
The second model considers that, in solvent mixtures, solvation of X will be through a large distribution of combinations of A and B. This distribution should relect the concentration of solvents in the bulk solution and the relative solvation energies of X in the two solvents. In this case the experimentally determined spectra will be a linear combination of a large number of X (A)n (B)m combinations, where for any given combination of n and m there may be several distinct possible spectra due to permutation of the solvent positions. This second model is obviously the general case, however, under certain conditions, it is possible to adequately describe the electronic spectra of these systems as a linear contribution of only two spectra. What follows describes these conditions.
Consider the emission spectrum of the solute in a pure solvent to be adequately described by a single Gaussian, which can be given by
I (ῡ) = c exp [- α (ῡ - ῡ0)2 ] (1)
where I is the emission intensity at ῡ (in wavenumbers), ῡ0 is the location of the maximum of the band, and α is
given by
α≡ 4 ln(2) / f2 (2)
where f is the full width at half amplitude and c is a linear parameter deining the emission intensity.
If the emission spectrum in any solvent mixture can be expressed as a linear combination of the emission spectra in each pure solvent
I (ῡ) = c1 exp [- α (ῡ - ῡ0,A)2 ] + c
2 exp [- β (ῡ - ῡ0,B) 2 ] (3)
c1 and c2 are related to the solvent composition but not
experimental emission curve in a solvent mixture it should have the appearance of a Gaussian. This implies that I (ῡ) cannot have a minimum between the two maxima at ῡ0,A and ῡ0,B. To localize all minima in equation 4 we can calculate
the irst derivative
d I (ῡ) / d ῡ = - 2 α {c1 (ῡ - ῡ0,A) exp [- α (ῡ - ῡ0,A)2] +
c2 (ῡ - ῡ0,B) exp [- α (ῡ - ῡ0,B)2]} (5)
and observe its zeros. It can be shown that the values of α
which generate no minima in the interval between ῡ 0,A and ῡ 0,B, independent of c1 are
α≤ 4 ln 2 (6)
or
f ≥ῡ0,B- ῡ0,A (7)
i.e., the bands are wider than their maximal spectral shifts. This condition is relatively easy to satisfy, as f values are commonly in the order of 3000 cm-1, whereas
solvatochromic shifts usually are not much greater than 2000 cm-1. In addition, through a judicious choice of
solvents A and B, this condition can always be met. Fluorescence spectra which cannot be adequately described as a single Gaussian can be treated in a similar manner, albeit they will almost certainly give inferior its. In the case of these more complicated bands many more parameters would have to be deined and a simple analytical treatment, such as given above, would not be possible.
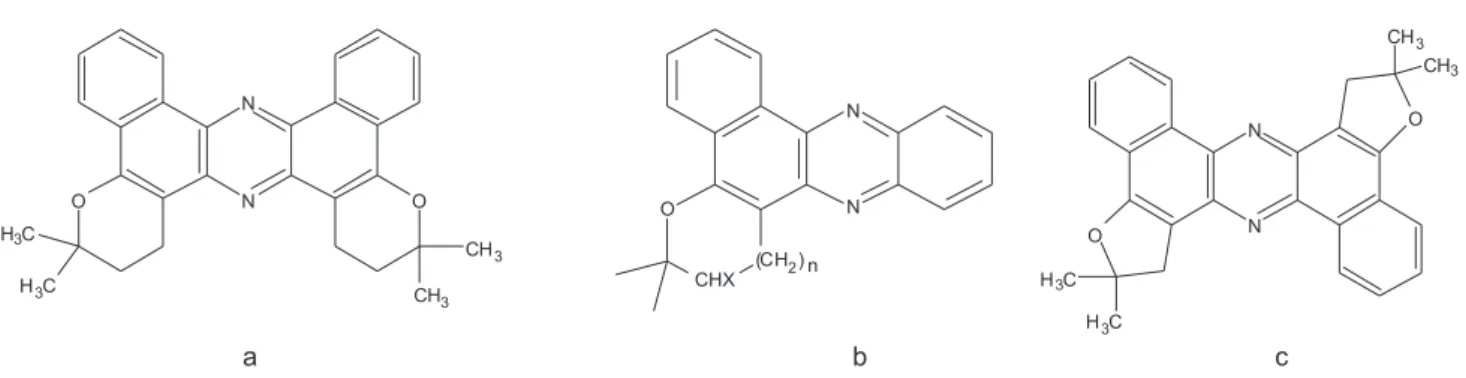
What follows is a series of factor analyzed spectra of four different strongly luorescent dyes in two different solvent binary mixtures, i.e., chloroform/2-propanol and acetonitrile/ethyl acetate.
Experimental
Preparation of chemicals
(PZ5), 2,2-dimethyl-3-Br-1,4-pyran[3,2-c]benzo[e] phenazine (PZ6Br) and 2,2,10,10-tetramethyl-1H,9H-difuran[3,2-c,j]dibenzo[e,l]phenazine (DPZ5t), which were prepared and puriied as previously6 given. The absorption
and luorescence spectra peak maxima in various pure solvents, including chloroform (Chl), 2-propanol (2Prop) and acetonitrile (ACN) have been reported7 previously.
The dye concentration used for the absorption spectra was typically between 10-5 and 10-4 mol L-1 and in the order of
2 × 10⁻⁵ mol L-1 for the luorescence spectra. The solvents
used for this study were Chl, 2Prop and Ethyl Acetate (EtAc) (Merck, Spectroscopic grade) and ACN (Merck, for chromatography). Any HCl that may have formed in the chloroform was eliminated immediately prior to using by the addition of Na2CO3. The other three solvents were used as received.
Absorption spectroscopy
Absorption spectra were taken on a Analytic Jena Second 210 spectrophotometer. Starting with a solution of one of the dyes in one of the pure solvents, the second solvent of the pair was added continuously until equal volumes of the two solvent in the binary mixture was attained. The experiment was then repeated, starting with the dye in the second solvent and titrating with the irst solvent to the same point of equal volumes. Absorption spectra over a range of 120 nm with a spectral resolution of 1 nm were taken. More than 100 spectra were generated, composing the entire set of spectra of any given dye in either of the solvent mixtures, of which over 30 spectra were used in the application of factor analysis.
Fluorescence spectroscopy
Fluorescence spectra were taken on a Hitachi F-4500 Spectroluorimeter and not corrected for instrumental sensitivity. Eleven different binary solutions were prepared, varying the volume per cent of the second solvent at
intervals of 10%. The eleven (uncorrected) luorescence spectra of each set were recorded at intervals of 0.2 nm, over a range of 100 nm.
Factor analysis
Factor analysis was done utilizing the Self-Modeling Factor Analysis method8 in a locally written program9
that has been shown10 to be capable of successfully
removing statistical noise. The method analyzes a set of normalized (to the same area = 1.0) spectra as an eigenvalue-eigenvector problem, in which the calculated contributing spectra are derived from the eigenvectors and the corresponding eigenvalues represent the contribution of the calculated spectra to the experimental spectra. In all cases only the two calculated spectra with the highest eigenvalues were maintained and linear combinations of these two normalized calculated spectra were itted to all of the normalized experimental spectra of the set. This process is optimized by calculating the point-by-point square of the deviations (ssq) of the calculated and experimental spectra.
Results and Discussion
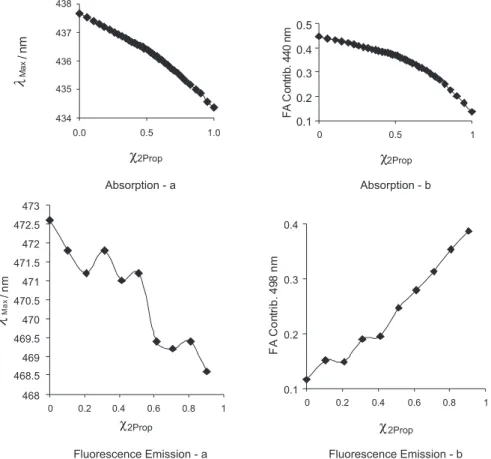
Figures 2 through 7 show, side by side, for the four dyes studied here, the variation in the wavelength at maximum intensity (λMAX) compared to the variation of the contribution of one of the factor analysis calculated contributing spectra (FA con), as a function of χ2Prop (in the CHCl3/2-propanol mixtures) and as a function of χACN
(in the ethyl acetate/acetonitrile mixtures). In the cases of the dyes DPZ6c and PZ6Br both the absorption and luorescence spectra were treated, whereas in the cases of DPZ5t and PZ5 only the absorption spectra were taken.
The maxima of the two calculated spectra making the greatest contributions to the experimental spectra, according to the factor analysis calculations are shown in Table 1. A reasonable measure of the goodness of it, using a linear combination of the two calculated contributing
Figure 2. Spectral results of DPZ6c in Chloroform/2-Propanol binary mixtures as function of mole fraction of 2-propanol. a) band maximum and b) factor analysis calculated contribution of irst of two calculated spectral bands; 434 nm (Abs.) and 498 nm (Fluor.).
Figure 3. Spectral results of DPZ6c in Ethyl Acetate/Acetonitrile binary mixtures as a function of mole fraction of Acetonitrile. a) band maximum and b)
Figure 4. Spectral results of PZ6Br in Chloroform/2-Propanol binary mixtures as a function of mole fraction of 2-propanol. a) band maximum and b) factor analysis calculated contribution of irst of two calculated spectral bands; 430 nm (Abs.) and 489 nm (Fluor.).
Figure 5. Spectral results of PZ6Br in Ethyl Acetate/Acetonitrile binary mixtures as a function of mole fraction of Acetonitrile. a) band maximum and b)
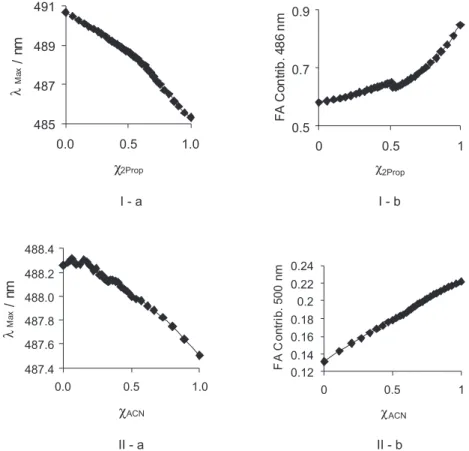
Figure 6. Absorption spectral results of DPZ5t; I) in Chloroform/2-Propanol binary mixtures as a function of mole fraction of 2-propanol, II) in Ethyl Acetate/Acetonitrile binary mixtures as a function of mole fraction of Acetonitrile. a) band maximum and b) factor analysis calculated contribution of irst of two calculated spectral bands; 486 nm (I-b) and 500 nm (II-b).
Figure 7. Absorption spectral results of PZ5; I) in Chloroform/2-Propanol binary mixtures as a function of mole fraction of 2-propanol, II) in Ethyl Acetate/
spectra, to the experimental spectra is the sum of the squares of the differences, summed over all of the points on the spectrum. The average ssq value, taken over every experimental spectrum in any given set, is shown in Table 1 also. A typical (average of the average ssq’s) it is shown in Figure 8.
The dyes used here were chosen because their high luorescence quantum yield10 permitted the use of very low
concentrations (< 10-5 mol L-1) of dye, thus guaranteeing
that the formation of their dimers could be ignored. The maxima of the factor analysis calculated spectra are not necessarily contained within the wavelength envelope
Table 1. Factor analysis calculated spectra maxima and average sum of square deviations
Dye Spectroscopy Solvent pair λMAX / nm Average ssq
DPZ6c Absorption CHCl3/2-Prop 434, 440 1.01 × 10⁻⁶
Eth. Acet./Acetonit. 436, 442 1.10 × 10⁻⁶
Fluorescence CHCl3/2-Prop 484, 498 5.90 × 10⁻⁷
Eth. Acet./Acetonit. 442, 476 2.78 × 10⁻⁷
PZ6Br Absorption CHCl3/2-prop 422, 430 4.50 × 10⁻⁷
Eth. Acet./Acetonit. 402, 438 1.90 × 10⁻⁸
Fluorescence CHCl3/2-prop 420, 489 2.10 × 10⁻⁶
Eth. Acet./Acetonit. 471, 493 3.80 × 10⁻⁷
DPZ5t Absorption CHCl3/2-prop 485, 497 2.40 × 10⁻⁶
Eth. Acet./Acetonit. 488, 500 4.04 × 10⁻⁷
PZ5 Absorption CHCl3/2-prop 427, 466 5.81 × 10⁻⁷
Eth. Acet./Acetonit. 409, 427 7.59 × 10⁻⁷
Figure 8. An average (ssq = 7.59 ×10⁻⁷) it of calculated (dotted line) and
experimental (solid line) spectra, in this case one of the absorption spectra of PZ5 in an ethyl acetate/acetonitrile mixture.
of the experimental spectra in the set that generated them. This is probably due to the fact that in non-polar solvents all four dyes used here have various vibrational ine structure peaks7 in both the luorescence band and the lowest energy
absorption band. Thus, consistent with this hypothesis, is that the factor analysis calculations are measuring the partial convergence of these peaks as the solvent mixture becomes more polar. This hypothesis also explains why the tendencies in the FA calculated contributions as the fraction of the more polar solvent increases sometimes favor the longer wavelength band and sometimes favor the shorter wavelength band. As the polarity of the solution increases, (i) the wavelength maximum (deined by the principal peak) is red shifted, however, (ii) the peaks merge. If the peak whose contribution decreases is originally red shifted relative to the other, effects i and ii, above, oppose one another and the tendency can go in either direction.
At this point it would be reasonable to raise the question as to whether the superiority of the FA method proposed here would be expected to be a general phenomenon, or just hold for a limited number of dye/solvent mixture combinations, such as those demonstrated here. Although the method would need to be tested with other dye/binary solvent combinations to give a definitive answer, the evidence presented here would lead one to suspect that this may be a general phenomenon, considering that the FA curves for any one of the given dyes are more linear in the Ethyl Acetate/Acetonitrile binary solvent mixtures than in the corresponding Chloroform/2-Propanol mixtures. This is to be expected because the former mixture involves a smaller polarity variation, therefore should show less preferential salvation (more ideality) and a straighter line.
Acknowledgments
The authors gratefully acknowledge Prof. Jack Saltiel (Florida State University) for an interesting discussion that gave rise to this project, the Brazilian National Research Council (CNPq) for partial inancial support (to T.S.T., R.G.S.S. and I.M.B.), and the Research Management Committee of the University of Newcastle for research visitor support (to I.M.B.).
References
1. Laha, A. K.; Das, P. K.; Bagchi, S.; J. Phys. Chem. A 2002,106, 3230.
Chem. A 2002,106, 8525; Fu, K.-X; Li, X.-Y.; Zhu, Q.; Gong, Z.; Lu, S.-Z.; Bao, Z.-M.; THEOCHEM 2005, 715, 157; Rotkiewicz, K.; Rettig, W.; Kohler, G.; Rechthaler, K.; Danel, A.; Grabka, D.; Chem. Phys. 2004, 307, 45.
5. Malinowski, E. R.; Cox, R. A.; Haldna, U. L.; Anal. Chem. 1984, 56, 778; Holden, C. A.; Hunnicutt, S. S.; Sanchez-Ponce, R.; Craig, J. M.; Rutan, S. C.; Appl. Spectrosc. 2003, 57, 483. 6. Pinto, A. V.; Pinto, C. N.; Pinto, M. C. F. R; Emery, F. S.; de
Moura, K. C. G.; Carvalho, C. E. M.; Brinn, I. M.; J. Chem. Res. (M) 1999, 2811 (Part 2); Pinto, A. V.; Pinto, C. N.; Pinto, M. C. F. R.; Emery, F. S.; de Moura, K. C. G.; Carvalho C. E. M.; Brinn, I. M.; Heterocycles 1997, 45, 2431; Kooker, S. C.; J. Chem. Soc. 1893, 63, 1376.
7. Carvalho, C. E. M.; Brinn, I. M.; Pinto, A. V.; Pinto, M. C. F. R.; J. Photochem. Photobiol., A 2000, 136, 25.
8. Lawton, W. H.; Sylvestre, E. A.; Technometrics 1971, 13, 617. 9. da Silva, A. S.; Silva, M. A. A.; Carvalho, C. E. M.; Antunes, A.
O. C.; Brinn, I. M.; Mangrich, A. S.; Inorg. Chim. Acta 1999, 292, 1.
10. Cabo, J. L.; Faria, H. B.; Portugal, S. G. M.; Silva, M. A. A.; Brinn, I. M.; Photochem. Photobiol. 1999, 69, 664; Carvalho, C. E. M.; Silva, A. S.; Brinn, I. M.; Pinto, A. V.; Pinto, M. C. F. R.; Lin, S.; Moore, T. A.; Gust, D.; Maeder, M.; Phys. Chem. Chem. Phys. 2002, 4, 3383; Lunardi, C. N.; Tedesco, A. C.; Kurth, T. L.; Brinn, I. M.; Photochem. Photobiol. Sci. 2003, 2, 954; Carvalho, C. E. M.; Silva, M. A. A.; Brinn, I. M.; Pinto, M. C. R.; Pinto, A. V.; Schripsema, J.; Longo, R. L.; J. Lumin.
2004, 109, 207.
Received: December 26, 2008