Brazilian Microwave and Optoelectronics Society-SBMO received 24 Jan 2016; for review 28 Jan 2016; accepted 5 May 2012 Brazilian Society of Electromagnetism-SBMag © 2016 SBMO/SBMag ISSN 2179-1074
Abstract— Measurement of dielectric permittivity of soil has been studied by many researchers. However, few studies have been conducted on contaminated soil. The motivation of the present study is to investigate the behavior of sandy soil contaminated by lubricant oil at microwave frequency. Two different artificially prepared soil samples are measured in the laboratory. The measurement of the complex permittivity of soil samples is reported in the frequency range 500 MHz – 4 GHz using open-ended coaxial probe technique. Measurements are carried out using a dielectric assessment system associated with an automatic network analyzer and a dielectric probe connected to a computer. The experimental set up is described and the system response is obtained. It is observed that the complex permittivity of the soil is associated with the contamination. The measurement results show that the change in the dielectric loss of dry sand before and after lubricant oil contamination is quite significant. Measuring these dielectric contrasts provide a basis for using ground-penetrating radar or other high-frequency electromagnetic sensors in the detection of soil contamination.
Index Terms— Microwave frequency, dielectric properties, permittivity measurement, contaminated sandy soil.
I. INTRODUCTION
A leakage from oil-pipeline is dangerous for people and the environment. It contaminates soil and ground-water [1]. Old pipelines may be fractured or leaking due to a variety of reasons, including corrosion, cracking, material defects, and human interference. Soil contamination due to oil leakage is not always visible. It may spread over large areas and it is difficult to locate. In the case of buried pipelines, where an inspection is impossible, different techniques exist for determining if a soil is potentially contaminated [2]. Some are invasive techniques that require drilling, testing and sampling. The invasive way to monitor the contaminated soil is to collect samples for the physical and chemical analysis, however, this traditional method may consume much time and high cost [3]. Furthermore, it is difficult to achieve a thorough understanding of the pollution conditions and geological drilling could destroy the original pollutants distribution and concentration in the soil. Invasive techniques, although they may work well, are labor intensive and impractical for inspecting the vast network of pipes henceforth an effective monitoring method needs to be developed.
Measured Dielectric Permittivity of
Contaminated Sandy Soil at Microwave
Frequency
Ahmad H. Abdelgwad, Tarek M. SaidBrazilian Microwave and Optoelectronics Society-SBMO received 24 Jan 2016; for review 28 Jan 2016; accepted 5 May 2012 Brazilian Society of Electromagnetism-SBMag © 2016 SBMO/SBMag ISSN 2179-1074
Non-invasive techniques offer rapid and relatively inexpensive characterization of contaminated soil without producing fractures [4]. The extent of contamination has a lot to do with the chemical composition of contaminant and the dielectric properties of the soil [5]. Soil contaminated by oil behaves differently and gives emission as well as scatters the energy at microwave frequencies [6]. Both emissivity and scattering coefficients are a function of the dielectric constant. The detection of contaminants can be done by the direct measurement of the dielectric permittivity of the contaminated area [7]. From the measured values of dielectric properties, one can estimate emissivity and scattering coefficient that will provide the tools for designing the microwave remote sensing sensors [8]. The underlying principle is based on sensing the change of dielectric characteristics that occurs in the soil when oil escapes from the pipe. The presence of oil provokes a local, detectable change of the dielectric characteristics of the soil [9].
Ground Penetrating Radar (GPR) is one of the most relevant technologies that form part of non-invasive techniques, which can detect and monitor oil leakage in underground environments [10]. In order to gain a better understanding of the radar signal returns from a contaminated area over a wide frequency band, the measurement of the dielectric properties of contaminated soil is therefore necessary. The detection of oil contamination in soils, by mean of the GPR, depends on the contrast of reflection coefficient between the dielectric permittivities of the clean and contaminated soil [11]. The higher the reflection coefficient, the higher the possibility for the detection of the contaminant [12]. The success of GPR in detecting the contaminant depends also on the penetration depth and frequency of GPR signal.
The dielectric properties of contaminated and uncontaminated soils have been measured by Darayan et al using two independent techniques: the guarded-electrode method and the parallel-plate capacitor method. It is found that the dielectric constant increases with the addition of diesel oil [13]. This is attributed to the fact that diesel oil replaces air contained within the pore spaces of the soil samples and changes the path of electric current conduction. The dielectric properties of a sandy soil contaminated with non-aqueous phase liquids has been investigated by Francisco and Montoro [14]. The dielectric permittivity of the soil in their study is measured using a coaxial impedance dielectric reflectometry sensor. Two different tests were performed in the study to characterize the dielectric properties of the soil and to verify the displacement of organic liquids inside the soil pores. Results of the Francisco and Montoro study indicate that as the volumetric oily liquid content of the samples increase, the dielectric permittivity of the samples also increase.
Brazilian Microwave and Optoelectronics Society-SBMO received 24 Jan 2016; for review 28 Jan 2016; accepted 5 May 2012 Brazilian Society of Electromagnetism-SBMag © 2016 SBMO/SBMag ISSN 2179-1074
Contaminated sand may remain in place for months or even years before being excavated for use. Previous studies showed that the dielectric constant of sand increases almost linearly with temperature [15]-[16]. At low temperatures, change in the dielectric constant is small, while rapid increase in the dielectric constant was observed at temperatures above 40 ºC. Under high temperature in the desert, volatile compounds will evaporate, leaving the heavier residues. Up to this point, the aging effect on measured soil is ignored and will be examined in a separate study. It is anticipated that a cohesion intercept may develop with time, particularly if the material is compacted to very high relative densities [17].
II. EXPERIMENTAL SETUP
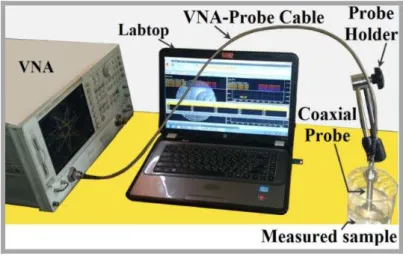
At microwave frequencies, different measurement techniques can be used for the measurement of the dielectric permittivity. These include transmission line techniques (free-space, waveguide and coaxial), impedance and cavity methods [18]. In the current study, the complex dielectric permittivity of different soil samples before and after contamination is measured using Dielectric Assessment Kit (DAK). DAK system is based on the open-ended coaxial probe technique which uses advanced algorithms and novel hardware for all applications where high-precision dielectric measurements (permittivity, conductivity and loss tangent) are required. The open ended coaxial probe is a cut off section of 50 Ohm transmission line used for contact the measured sample either by touching the probe to the surface of a solid/semi-solid media or by immersing it into a liquid media. The electromagnetic fields at the probe end fringe into the material to be measured and its parameters are determined from the change of the scattering parameter S11.
Fig. 1. DAK measurement system setup
Brazilian Microwave and Optoelectronics Society-SBMO received 24 Jan 2016; for review 28 Jan 2016; accepted 5 May 2012 Brazilian Society of Electromagnetism-SBMag © 2016 SBMO/SBMag ISSN 2179-1074
to measure the scattering parameters seen at the end of the open-ended coaxial probe, while DAK software on an external computer calculates the dielectric constant from the measurement. The measured sample volume is large enough to ensure that reflections at the sample boundaries do not significantly influence the measurements. The minimum sample volume depends on the frequency, probe size and dielectric parameters. DAK system setup is shown in Fig. 1.
III. MEASUREMENT PROCEDURE
All samples are prepared in the chemical laboratory at Fayoum University. The soil samples consist of commercially available sands. The sand was fine grained, and the sample was kept in a tight plastic bottle until the dielectric measurements were made in the laboratory. Oil was added to the sandy soil, allowed to saturate for 24 hours, and stored at room temperature. Table I shows the physical and chemical properties of soil samples. Prior to the measurement, the system imperfections are completely avoided by calibrating the system. The calibration procedure of the probe involves the measurement of air (open), a circuit connection (short). Additionally, the dielectric permittivity of deionized water was measured and stored in memory as a known material reference. Once calibration is completed, then soil samples are measured. The calibration performance was then controlled before and after testing each sample. Finally, the Dielectric Probe Kit software assists in data acquisition and permittivity calculations
TABLE I.PHYSICAL AND CHEMICAL PROPERTIES OF SOIL SAMPLES
Soil Test Uncontaminated sandy soil Contaminated sandy soil
Specific Weight (Ton/m3) 1.42 1.66
Water Content (%) 6.7 % 4.54 %
Max Dry Density (Ton/m3) 1.739 1.912
Soil porosity (%) 35.5 % 28.1 %
Chlorides salts (%) 0.072 % 0.085 %
Sulphates salts (%) 0.35 % 0.35 %
IV. MODELING OF EXPERIMENTAL DATA
Brazilian Microwave and Optoelectronics Society-SBMO received 24 Jan 2016; for review 28 Jan 2016; accepted 5 May 2012 Brazilian Society of Electromagnetism-SBMag © 2016 SBMO/SBMag ISSN 2179-1074
It is common to use relaxation models that estimate the soil dielectric properties. Although a wide variety of models, each with its own characteristics, has been proposed no complete model is available that can describe the dielectric properties of a soil for all its variables. This makes it a challenge to select the best model for each occasion [22]. The dielectric permittivity of the dry sand can be represented by single relaxation Debye equation [23]-[24]:
ia"
f
f
i
s
+
1
-+
=
0
(1)where εs is static permittivity, ε∞ is the extrapolated high frequency permittivity, fo is the relaxation
frequency, and a" is an estimated imaginary part assumed to be due to losses in sand. The dielectric characteristics of many dielectrics deviate from the Debye theory, which assumes the existence of one single relaxation time and ignores the conductive loss.
V. RESULTS AND DISCUSSIONS
The dielectric permittivity of contaminated and uncontaminated sandy soil was measured at room temperature (25o C) as a function of frequency. For the modeling of the measured data, a Debye relaxation spectrum is chosen. A curve fitting routine is implemented using MATLAB based on the least square method to search for the most appropriate values of fitting Cole-Cole model parameters. The goal of data fitting is to find the parameter values that most closely match the measured data. The best Debye fitting parameters for both samples are tabulated in Table II. The tabulated data indicate that the addition of lubricant oil can potentially translate into differences in the effective complex permittivity. These changes in turn reflect on the Debye parameters. The higher value of relaxation frequency for contaminated soil as compared to that of uncontaminated soil may be due to oil molecules.
TABLE II.DEBYE PARAMETERS FOR DIFFERENT SANDY SOILS
Soil Type Uncontaminated sandy soil Contaminated sandy soil
εs 2.51 5.68
ε∞ 2.82 5.99
fo (GHz) 0.249 0.412
a" 0.003 0.285
Brazilian Microwave and Optoelectronics Society-SBMO received 24 Jan 2016; for review 28 Jan 2016; accepted 5 May 2012 Brazilian Society of Electromagnetism-SBMag © 2016 SBMO/SBMag ISSN 2179-1074
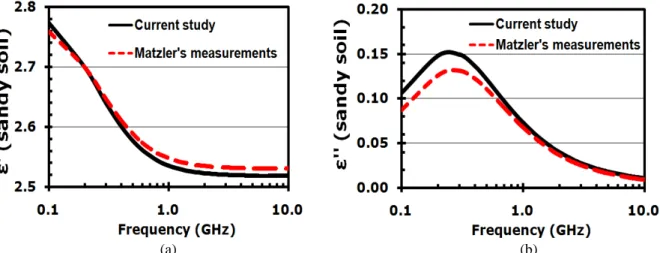
(a) (b)
Fig. 2. Comparison of the fitted permittivity of sandy soil versus frequency (a) dielectric constant (b) dielectric loss factor
In order to reproduce a typical leak-contamination condition, commercial lubricant oil is diffused in the soil using a syringe to spread it uniformly over the top of the sample caused the soil polluted. The dielectric permittivity of the contaminated sample was then measured. This procedure was repeated until the soil sample was completely saturated. As microwaves penetrate into soil the wavelength is shortened and the amplitude rapidly attenuated. The depth at which the amplitude of the wave is reduced to 1/e (about 0.37) compared to the amplitude at the surface is called the "penetration depth". Penetration depth and wavelength will depend on frequency, soil permittivity, and soil conductivity. The power penetration depth is given by the inverse of the absorption coefficient α = 2k0n'', where k0
is the wave number in vacuum and n'' is the imaginary part of the complex refractive index n = √ . Using equation (1), was computed over the frequency range from 0.5–10 GHz. The result for both type of soil is shown in a logarithmic representation in Fig. 3.
Fig. 3. Penetration depth of contaminated and uncontaminated soil versus frequency, according to the fitted permittivity
Brazilian Microwave and Optoelectronics Society-SBMO received 24 Jan 2016; for review 28 Jan 2016; accepted 5 May 2012 Brazilian Society of Electromagnetism-SBMag © 2016 SBMO/SBMag ISSN 2179-1074
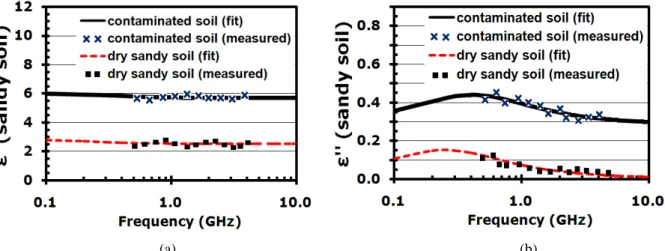
Figure 4 shows the graph of experimentally extrapolated measured values of the dielectric constant ' and the dielectric loss '' for both type of soil at microwave frequency band. From the analysis of measured data from both the uncontaminated sandy soil and the soil impregnated with lubricant oil, it is anticipated that both the dielectric constant and the dielectric loss increase with the addition of oil. This can be attributed to the fact that the oil penetrates deep into soil, replaces the air in the pore space and block air spaces. As a result, the soil becomes more compact, its physical and chemical properties alter; finally its characteristics become more similar to characteristics of lubricant oil and consequently cause the changes in its dielectric permittivity. After the addition of lubricant oil in soil, the amount of change in the dielectric constant of compound seems to be significant. Thus the GPR and other high frequency electromagnetic sensors should be able to sense the signal for soils with and without oil contaminations. The results show that oil contaminants are easily detected in dry sand, yet detection becomes very difficult in wet sand.
(a) (b)
Fig. 4. Measured and curve-fitted permittivity of sandy soil versus frequency before and after oil was added (a) dielectric constant (b) dielectric loss factor
VI. CONCLUSION
Brazilian Microwave and Optoelectronics Society-SBMO received 24 Jan 2016; for review 28 Jan 2016; accepted 5 May 2012 Brazilian Society of Electromagnetism-SBMag © 2016 SBMO/SBMag ISSN 2179-1074
ACKNOWLEDGMENT
The authors are thankful to Dr. T. Abou-Elnaga, Electronics Research Institute, Egypt, for providing the necessary laboratory facilities for measurements.
REFERENCES
[1] S. Yanxun, W. Yani, Q. Hui, F. Yuan, “Analysis of the groundwater and soil pollution by oil leakage,” Procedia Environmental Sciences, vol. 11, pp. 939–944, 2011
[2] A. Cataldo, G. Cannazza, E. De Benedetto, and N. Giaquinto, “Performance evaluation of a TDR-based system for detection of leaks in buried pipes,” Proceedings of IEEE International Instrumentation and Measurement Technology Conference, pp. 792–795, Graz, Austria, 2012
[3] M. R. Nanni, and J. A. M. Dematte, “Spectral reflectance methodology in comparison to traditional soil analysis,” Soil Science Society of America Journal, vol. 70, no. 2, pp. 393–407, 2006
[4] R. K. Rowe, J. Q. Shang, and Y. Xie, “Complex permittivity measurement system for detecting soil contamination,” Canadian Geotechnical Journal, vol. 38, no.3, pp. 498–506, 2001
[5] J. P. Robinson, E. R. Binner, A. saeid, M. al-harahsheh, S. W. Kingman, “εicrowave processing of Oil Sands and
contribution of clay minerals,” Fuel, vol. 135, pp. 153–161, 2014
[6] N. Ahmadian, S. Hasan, and O. N. Calla, “Permittivity and Backscattering Coefficient of Diesel Oil-Contaminated Soil
at C Band (5.3 GHz),” International Journal of Microwave Science and Technology, vol. 2013, pp. 1–9, 2013
[7] M. Huang, C. Lui, L. C. Shen, D. Shattuk, “Monitoring soil contamination using a contactless conductivity probe,” Geophysical Prospecting, vol. 43, pp. 759–778, 1995
[8] N. R. Peplinski, F. T. Ulaby, and M. C. Dobson, “Dielectric properties of soils in the 0.3–1.3-GHz range,” IEEE Trans. Geosci. Remote Sensing, vol. 33, no. 3, pp. 803–807, 1995
[9] Y. Son, M. Oh, and S. Lee, “Influence of oil fuel contamination on the electrical properties of unsaturated soil at a low frequency range of 100 Hz–10 MHz,” Environmental Geology, pp. 1341–1348, 2009
[10]D. A. Robinson, S. B. Jones, J. M. Wraith, D. Or, and S. P. Friedman, “Detecting oil contamination by Ground Penetrating Radar around an oil storage facility in Dhanbad, Jharkhand, India,” J. Ind. Geophysics Union, vol. 18, no. 4, pp. 448–454, 2014
[11]A. Kaya and H. Fang, “Identification of contaminated soils by dielectric constant and electrical conductivity,” J. Environ. Eng., vol. 123, no. 2, pp. 169–177, 1997
[12]P. Hoekstra and A. Delaney, “Dielectric properties of soils at UHF and microwave frequencies,” Journal of Geophysical Research, vol. 79, no. 11, pp. 1699–1708, 1974
[13]S. Darayan, C. Liu, L. C. Shen and D. Shattuck, “Measurement of electrical properties of contaminated soil,” Geophysical Prospecting, vol. 46, pp. 477–488, 1998
[14]F. M. Francisco and M. A. Montoro, “Measuring the dielectric properties of soil-organic mixtures using coaxial impedance dielectric reflectometry,” Journal of Applied Geophysics, vol. 80, pp. 101–109, 2012
[15]A. Aiban, “The effect of temperature on the engineering properties of oil-contaminated sand,” J. Environ. Int., vol. 24, pp. 153–161, 1998
[16]C. Liu, L. Zhang, J. Peng, C. Srinivasakannan, B. Liu, H. Xia, J. Zhou, L. Xu, “Temperature and moisture dependence of the dielectric properties of silica sand,” J Microw Power Electromagn Energy, vol. 47, no. 3, pp. 199–209, 2013 [17]H. A. Alsanad and N. F. Ismael, “Aging effect on oil contaminated Kuwaiti sand,” Journal of Geotechnical and
Geoenvironmental Engineering, vol. 123, no. 3, pp. 290–294, 1997
[18]M. S. Venkatesh and G. S. V. Raghavan, “An overview of dielectric properties measuring techniques,” Canadian Biosystems Engineering, vol. 47, pp. 715–730, 2005
[19]A. R. Von Hippel, Dielectric Materials and Applications, MIT Press, Cambridge, Mass., UAS, 1961
[20]R. H. Cole, “On the analysis of dielectric relaxation measurements,” J. Chem. Phy., vol. 23, pp. 493–499, 1955
[21]K. Y. You, Z. Abbas, M. F. A. Malek, E. M. Cheng, H. K. Mun, “εodeling of dielectric relaxation for lossy materials at microwave frequencies using polynomial approaches,” Jurnal Teknologi. vol. 58, pp. 51–65, 2012
[22]J. O. Curtis, “Microwave dielectric behavior of soils; Report 1, Summary of related research and applications,” Technical Report EL-93-25, U.S. Army Engineer Waterways Experiment Station, Vicksburg, MS, 1993
[23]P. Debye, Polar Molecules, New York, USA: Chemical Catalog Co., 1929
[24]C. Mätzler, “Thermal microwave radiation - applications for remote sensing,” IET Electromagnetic Waves Series 52, London, UK, 2006