This study deals with the reduction of the stiffness in precast concrete structural elements of multi-storey buildings to analyze global stability. Hav-ing reviewed the technical literature, this paper present indications of stiffness reduction in different codes, standards, and recommendations and
compare these to the values found in the present study. The structural model analyzed in this study was constructed with inite elements using ANSYS® software. Physical Non-Linearity (PNL) was considered in relation to the diagrams M x N x 1/r, and Geometric Non-Linearity (GNL) was calculated following the Newton-Raphson method. Using a typical precast concrete structure with multiple loors and a semi-rigid beam-to-column connection, expressions for a stiffness reduction coeficient are presented. The main conclusions of the study are as follows: the reduction coef
-icients obtained from the diagram M x N x 1/r differ from standards that use a simpliied consideration of PNL; the stiffness reduction coeficient for columns in the arrangements analyzed were approximately 0.5 to 0.6; and the variation of values found for stiffness reduction coeficient in concrete beams, which were subjected to the effects of creep with linear coeficients from 0 to 3, ranged from 0.45 to 0.2 for positive bending mo -ments and 0.3 to 0.2 for negative bending mo-ments.
Keywords: precast concrete, physical non-linearity, global stability, M x n x 1/r diagrams.
no presente trabalho investiga-se a redução da rigidez de elementos estruturais de concreto pré-moldado de edifícios de múltiplos pavimentos
para a análise da estabilidade global. Apresentam-se as indicações da redução de rigidez de diferentes códigos, normas e recomendações de associações encontradas na literatura técnica, para servir de comparação com os valores encontrados no estudo. O modelo estrutural analisa
-do foi construí-do em elementos initos com o auxílio -do software ANSYS®. A não-linearidade física (NLF) foi considerada com as relações dos diagramas M x N x 1/r e a não-linearidade geométrica (NLG) segundo o método de Newton-Raphson. Tomando como base uma estrutura típica de concreto pré-moldado de múltiplos pavimentos com ligação viga x pilar de comportamento semi-rígido, são apresentadas expressões para o coeiciente redutor de rigidez. As principais conclusões do estudo desenvolvido são: os coeicientes redutores obtidos segundo o diagrama M x N x 1/r divergem das indicações normativas para consideração simpliicada da NLF; o coeiciente redutor de rigidez para os pilares dos arranjos analisados foi da ordem de 0,5 a 0,6; a variação dos valores encontrados para os coeicientes redutores de rigidez nas vigas em concreto armado submetidos aos efeitos da luência pelo coeiciente linear de 0 a 3 foi de 0,45 a 0,2 para momento positivo e de 0,3 a 0,2 para momento negativo.
Palavras-chave:concreto pré-moldado, não-linearidade física, estabilidade global, diagramas M x n x 1/r.
Contribution to assessing the stiffness reduction of
structural elements in the global stability analysis of
precast concrete multi-storey buildings
Contribuição para a avaliação da redução da rigidez de
elementos estruturais de concreto pré-moldado de edifícios
de múltiplos pavimentos para análise da estabilidade global
M. C. MARIN a [email protected]
M. K. EL DEBS b [email protected]
a Department of Structural Engineering, São Carlos School of Engineering, University of São Paulo, [email protected], CEP 13566-590, São Carlos, Brazil;
b Department of Structural Engineering, São Carlos School of Engineering, University of São Paulo, [email protected], CEP 13566-590, São Carlos, Brazil.
Received: 23 Oct 2011 • Accepted: 08 Mar 2012 • Available Online: 26 Jun 2012
Abstract
1. Introduction
The manufacturing components and industrial conditions involved in producing precast concrete result in numerous advantages, including facilities for quality control, low wastage of materials, and use of high-strength concrete. However, when compared to concrete structures cast on site, the connections between precast components compli-cates evaluation of structural behavior(s), a situation of particular im-portance when it comes to global stability analyses of structures with
multiple loors.
In general, the Physical Linearity (PNL) and Geometric Non-Linearity (GNL) are taken into account when analyzing the global stability of concrete structures. One of the predominant ways in which PNL is considered in concrete structures is through reduc
-ing stiffness in structural elements, as recommended by NBR 6118:2003 [1]. If the beam-to-column connections are perfectly
rigid, which is usually the case in concrete structures cast on site,
the indications from NBR-6118:2003[1] can be applied. However, the indications from NBR 6118:2003 do not apply when the beam-to-column connections are not perfectly rigid. Few studies in the
technical literature regarding precast concrete structures consider
conditions of semi-rigid connections. For the case of a pinned beam-to-column connection, Hogeslag [2] recommends a stiffness reduction coeficient (in columns) of 1/3.
Until the last decade of the twentieth century, connections in precast concrete structures were either pinned or rigid. A program in the Euro
-pean Community called COST C1 (“Control of the Semi-Rigid Behav
-ior of Civil Engineering Structural Connections”) developed between 1991 and 1998 increased research in this regard for precast concrete structures [3-8]. Since then, the possibility of developing relatively
simple beam-to-column connections that have semi-rigid behavior has been investigated in relation to evaluations of global stability for
precast concrete structures with multiple loors.
The present study evaluates the reduction of stiffness in structural ele-ments for typical situations involving precast concrete buildings with
multiple loors. The study is focused on the case of plane frames with
semi-rigid beam-to-column connections and columns embedded in the foundation. The structural arrangements analyzed correspond to the usual modulation(s) and load(s) in multi-storey precast concrete
framed structures. The study is performed using the M x N x 1/r dia
-grams for columns and beams, based on NBR 6118:2003 [1]. The GNL is considered in a non-approximated way according to the inite element model, which was constructed using ANSYS® software [9]. The values for the stiffness reduction coeficients obtained are com -pared with the values recommended by standards and codes found in the technical literature.
2. Values for reduction coeficients
in the technical literature
Taking PNL into account, the reduction of stiffness can be deined as follows:
(1)
cci
I
E
EI
sec=
a
where
α represents the stiffness reduction coeficient; EIsec represents the secant stiffness.
In this section, ive recommendations from different codes, stan
-dards, and association committees are presented. It should be not -ed that only some of these recommendations are direct-ed towards
precast concrete structures. In principle, the irst three pertain to
concrete structures cast on site, while the last two pertain to pre-cast concrete.
a) Current Brazilian standard for structural concrete – NBR 6118:2003 [1]
The NBR 6118:2003 [1] allows for an approximate consideration of
physical non-linearity to analyze global stability in reticulated
struc-tures with at least four loors. For this, the secant stiffness (EI)sec, is deined for each element as follows:
(2)
c ci
I
E
EI
sec=
0
.
3
Slabs:
(3)
cci
I
E
EI
sec=
0
.
4
for A’s
≠
A
sBeams:
(4)
cci
I
E
EI
sec=
0
.
5
for A’
s= A
s(5)
cci
I
E
EI
sec=
0
.
8
Columns:
where
Ic is the moment of inertia of concrete, including, when appropriate, collaborating lange;
Eci is the initial tangent modulus of elasticity;
As is the cross-sectional area of tension longitudinal reinforcement; A’s is the cross-sectional area of compression longitudinal rein-forcement.
When the bracing frame is composed exclusively of beams and
columns and γz is less than 1.3, the beams and columns stiffness
can be calculated by the following equation:
(6)
EI
sec= 0.7E
ciI
The coeficient γz is determined from the results of a irst-order lin -ear analysis, where it is taken into account the structure’s tipping
(13)
cd c yd tot sf
A
f
A
,=
w
andf
cd is the design value of the compressive strength of concrete(MPa);λ
is the slenderness ratio;j
is the creep coeficient;tot s
A
, is the total longitudinal area of steel in the section.d) Brazilian standard for precast concrete - NBR 9062:1985 [12]
Because the current Brazilian standard for structures of precast concrete (NBR 9062:2006 [13]) does not mention the reduction co
-eficient for obtaining secant stiffness in columns, it was utilized the previous version of NBR 9062:1985 [12]. The reduction of stiffness
in columns on frames with symmetrical reinforcement is, therefore,
determined by the following expression:
(14)
α
= 0.2 +
15ρ
where
(15)
bd
A
s,tot=
r
e) Committee of the American Institute of precast/prestressed Concrete [14]
The Committee on Prestressed Concrete Columns from the Pre
-cast/prestressed Concrete Institute provides the following equation to calculate reduced stiffness in the columns:
(16)
d m g cI
E
EI
b
l
+
=
1
/
sec where:(17)
0
.
3
³
=
qh
l
m
(18)
70
6
6
.
1
5
.
2
+
0Þ
£
£
=
h
h
P
P
b) Committee 318 of the American Concrete Institute - ACI 318-08 [10]
The ACI 318-08 (Building Requirements for Structural Concrete and Commentary) contains two expressions. The irst (Eq. 7) is designed for situations with high axial load and small eccentricity values, wherein the effect of slenderness is large. The second (Eq. 8) is a simpliied version of the irst.
(7)
ds s g
c
I
E
I
E
EI
b
+
+
=
1
2
.
0
sec(8)
d g cI
E
EI
b
+
=
1
4
.
0
sec where cE
is the modulus of elasticity of the concrete. According to ACI,its value is Ec= 4700 fc', where f´c is the speciied compressive
strength of concrete; s
E
is the modulus of elasticity of steel;g
I
is the moment of inertia of concrete in relation to the section’scenter of gravity without considering reinforcement; s
I
is the moment of inertia of the reinforcement in relation to thesection’s center of gravity; d
b
is the coeficient related to the creep of concrete and express-es the relationship between the dead axial load and the total axial load. In the case where creep is not considered, bd = 0.
c) Bulletin 16 of the Beton International Federation [11] In Bulletin 16 (Design examples for FIP recommendations ‘practi
-cal design of structural concrete’), the Beton International Federa
-tion (FIB, Federa-tion Internacional du Beton) presents the follow
-ing expression for stiffness evaluat-ing:
(9)
s s g c
e
E
I
E
I
EI
sec= a
a
j+
where
(10)
α
φ= 1 - 0.
8φ
(1 -
λ
/200)
ω
0.25(11)
α
e= 0.08ν
0(0.85f
cd)
0.6e
(λ/100-2ω)(12)
ν0
=
A
N
d c0.85f
cdThe GNL was analyzed according to the complete Newton-Raph
-son method. Displacement control was the criterion used to deter
-mine when the iterative process was stopped. The deined toler -ance was 0.5%, meaning that the iterative process was interrupted when there the increase in displacement relative to the previous iteration was no more than 0.5%. The non-linear analysis was per-formed by dividing the load into 10 steps.
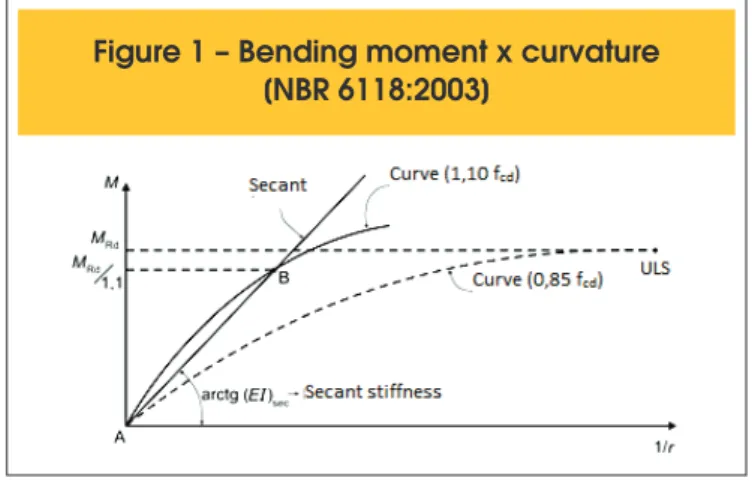
According to NBR 6118:2003 [1], non-linearity can generally be considered through each section’s bending moment x axial force x curvature relationships (M x N x 1/r diagrams), where the re
-inforcement and acting axial force are supposedly known. NBR 6118:2003 [1] describes two ways of using the M x 1/r diagram; the irst is designed for the ultimate limit state, and the second is de
-signed for evaluating the secant stiffness of the elements. Figure 1 shows the M x 1/r diagram from NBR 6118:2003 [1].
According to NBR 6118:2003 [1], to calculate ULS, the design
value of the compressive strength of concrete should be multiplied
by 0.85. As explained by CARVALHO and FIGUEIREDO [15], be -cause the concrete shows greater compressive strength in
short-term trials, the value of 0.85 fcd is assigned to the duration of the compressive strength tests. In typical structures, the load contin
-ues to act on the structure throughout its entire useful life. Under dead load, concrete’s compressive strength decreases over time, a phenomenon called the Rüsch effect.
According to FRANÇA [16], calculating the stiffness from constitu -tive relationships based on design values of the concrete strength can lead to overestimating the effects of non-linearity. To account for stiffness, the design value of the concrete compressive strength
should be multiplied by 1.10. This coeficient considers the fact
(19)
θ
=
kL/r - 0.05
27
and
P
represents the axial load in the column in a irst-order analysis;0
P
represents the maximum acceptable centered load on the col-umn;
κ
represents the coeficient of effective length of the column con-sidering the boundary conditions;
L
represents the length of the column;r
represents the radius of gyration of the cross section.In this case, it is noteworthy that the expression takes into ac -count the geometric characteristics and connections in the struc-tural elements.
As shown by Table 1, a comparative table of the factors considered
in each recommendation, a) there is a large difference between the
factors considered and b) NBR 6118:2003 [1] is the only scenario with ixed values. It is important to note that the factors considered
are only applied to columns.
3. Models for analysis
The precast concrete structure considered in this study was modeled
as a plane frame, using ANSYS® software [9] for structural analyses with inite elements. The non-simpliied consideration of PNL implies knowing the M x N x 1/r diagram (in other words, the stiffness) for
each section in which there is a change in stress, cross-section, rein-forcement, concrete cover, and strength of concrete. Thus, structures
that are discretized into a greater number of inite elements have more representative solutions. Using the ANSYS® software [9], the constitu -tive relationship between beams and columns can be represented by
the M x N x 1/r diagram using the beam element BEAM188.
The discretization adopted for modeling the structure through the
inite element method employed 8 inite elements for each column
section, where each section corresponds to the region between
loors. With regard to the beams, 16 inite elements were used for each beam section, where each section was deined by the region between corbels. The corbels were discretized into a inite ele
-ment, and the stiffness of the corbels was deined by the product EciIc. The elements of connection were modeled using COMBIN39, permitting the bending moment x rotation relationship to be repre -sented in a non-linear and asymmetric way.
Table 1 – Factors considered in each recommendation
VALUES
FORCE
AXIAL
CREEP
REINFORCEMENT
SLENDERNESS
NBR 6118:2003
FIXED
NO
NO
NO
NO
ACI 318-08
VARIABLE
NO
YES
YES
NO
FIB (2002)
VARIABLE
YES
YES
YES
YES
NBR 9062:1985
VARIABLE
NO
NO
YES
NO
PCI (1988)
VARIABLE
YES
YES
NO
YES
that not all of the sections in the structural element are made from materials with values corresponding to lower statistical quantiles.
In other words, not all of the sections in the element are equally af
-fected by the conditions taken into account by coeficientγm, which considers the weights of strengths.
Regarding the safety of the loads, the second-order analyses were performed using the M x N x 1/r diagram(s). NBR 6118:2003 [1]
suggests using a formula for safety in which the loads are increased by γf /γf3. After determining the second-order effects, the loads are increased by γf3, with γf3=1.1. According to NBR 8681:2003 [17], the
coeficient γf3 considers the possible errors in evaluating the effects of the loads, whether from constructive problems or from deicien -cies in the calculation method used.
Secant stiffness is calculated as follows: a) irst, the resistant mo
-ment in the transversal section (Mrd) is calculated, using a value of 0.85fcd for stress on the concrete, and the acting load is increased by γf (nd); b) next, the M x N x 1/r diagram is constructed using a value of 1.1fcd for stress on the concrete, and the acting load is increased by γf /γf3 (nd/ γf3).The secant stiffness is deined by the
relationship between the resistant moment(Mrd)/γf3 and the corre-sponding curvature in the M x N x 1/r diagram constructed with a
value of 1.1fcd of stress on the concrete and acting load increased by γf /γf3 (nd/ γf3).
The combined effects of the intact concrete between cracks and
the concrete’s tensile strength constitute a phenomenon known as “tension stiffening”. The manual from ib [18] accounts for this ef
-fect with regard to the relationship M x 1/r. However, this ef-fect is
not taken into account in the present study.
The procedures used here are valid for experimental veriications
of concrete with fck values up to 50 MPa, the maximum strength
grade for which NBR 6118:2003 [1] is applicable. Construction of the M x N x 1/r diagram is accomplished by determining the axial strength force (νRd) that is able to balance a pre-ixed axial force (νixo). Because the pre-ixed axial force is associated with a curva -ture and neutral position, this procedure is necessarily incremental
and iterative. After deining the neutral axis, the dimensionless re -sistant moment is calculated. The procedure used to construct the
M x N x 1/r diagram and a description of the incremental and itera
-tive process can be found in the study by MARIN [19]. The M x N x 1/r diagrams can be shown as dimensionless values. The study of FUSCO [20] details the relationships between the dimension
-less bending moment (µ), the dimension-less axial force (ν), and
curvature (d/r) that can be found for different d’/h relationships and
grades of steel. The study of OLIVEIRA [21] contains abacuses
that relate the dimensionless bending moment, the dimensionless
axial force, and the secant stiffness adjusted for the effect of the linear creep coeficient.
The results obtained in MARIN [19] for the resistant moment and
secant stiffness were compared with the values found in the
aba-cuses developed by OLIVEIRA [20], with differences of approxi
-mately 1%. The values shown in the abaci by FUSCO [20] were also compared with those obtained by MARIN [19], with differenc
-es of approximately 1%.
4. Numerical simulations in the
representative cases
The analysis herein was performed using a structural arrange-ment representative of multi-storey precast concrete buildings.
Figure 2 shows the schematic arrangement with modulations of
7.5 m and 10 m.
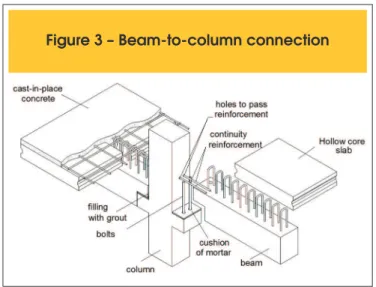
The structural system used in the present study is constituted by frames with semi-rigid beam-to-column connections and columns
embedded in the foundation. As illustrated in Figure 3, this
beam-to-column connection is formed by two bolts and concrete topping cast on site, with reinforcement passing through the central
col-umns. On the end columns, the reinforcement for negative bending moments is anchored in mechanical splices. For any direction in
which there is no column-beam plane, the stability must be en-sured by the stiffness in the columns. Horizontal wind loads are transferred to the other components by the slab, which behaves like a diaphragm. Thus, a central frame in direction y was selected,
as shown in Figure 2, as an object of study.
The semi-rigid behavior of the beam-to-column connection was
tak-en into account using the btak-ending momtak-ent x rotation of connection proposed in El Debs et al. [22], which is reproduced in Figure 4. Using the semi-rigid beam-to-column connection, the increasing of loors number typically used with pinned connections (3 loors, approximately 12 m in height) was investigated. Based on prelimi -nary calculations, which were subsequently proven, the
beam-to-column connection allowed for increasing the number of loors to 6 when the column’s cross section was 50 cm x 50 cm for a modula
-tion of 7.5 m and 60 cm x 60 cm for a modula-tion of 10 m. For both
Figure 2 – Schematic arrangement
modulations, buildings with up to 4 loors were stable for column cross-sections of 40 cm x 40 cm.
Based on the above considerations, the variables and parameters
described below were analyzed.
a) Number of loors (height): 4 loors (16 m), 5 loors (20 m), and 6 loors (24 m).
b) Materials: concrete C-35 (fck=35 MPa), steel CA-50 for longitudinal reinforcement, and steel CA -60 for cross-sectional reinforcement. c) Cross-sectional and longitudinal reinforcement in the columns (according to Table 2): the longitudinal reinforcement (As,tot) was uni-formly distributed in the sides of the section, and the geometric rate of
reinforcement corresponded to approximately 3% of all the sections of
the columns. The cross-sectional reinforcement consisted of stirrups
with a diameter of 6 mm; and a minimum concrete cover of 2.5 cm for
the cross-sectional reinforcement in the columns was adopted. d) Dead loads: the self-weight of the hollow core slab was 2.2 kN/ m2 for a span of 7.5 m and 2.6 kN/m2 for a span of 10 m. The struc-tural concrete topping 6 cm thick, with a self-weight of 1.5 kN/m2 and a coating of 0.5 kN/m2. The average thickness of the structural concrete topping was 6 cm (considering the upward delection of the hollow core slabs);, and, for all cases, a load of 10 kN/mper
loor (resulting from the masonry’s self-weight) was used around
the perimeter of the structure.
e) Live loads: two values, - 3 and 5 kN/m2, were considered. f) Wind pressure: wind pressure was calculated according to
NBR 6123:1988 [23]. The force of wind on a given structural ar
-rangement was broken down according to the number of loors and
height, as shown in Table 3, for the case study corresponding to the central frame with a modulation of 7.5 m.
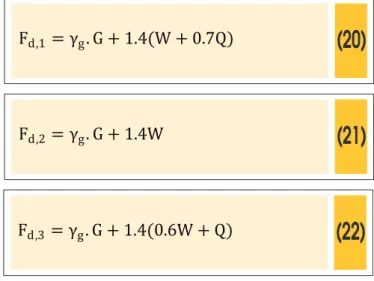
g) Load combinations: three load combinations were considered
for ULS: in the irst, which employed a high concentration of people in a typical commercial, public, or ofice building, the wind’s load
was the main load, and the live load was considered secondary (this combination was important to verify the global stability of the structure as a whole). The second combination did not consider
the contribution of the live load (its veriication was extremely im -portant due to the positive moment caused by the wind on
connec-tions). In the third load combination, the live load was predominant,
and the load from the wind was secondary.
Thus, three expressions for load combinations for the ultimate limit state are obtained, as shown below:
(20)
F
d,1=
γ
g. G + 1.4(W + 0.7Q)
(21)
F
d,2=
γg
. G + 1.4W
(22)
F
d,3=
γ
g. G + 1.4(0.6W + Q)
where:
G represents dead loads;
Q
represents live loads;W represents wind loads.
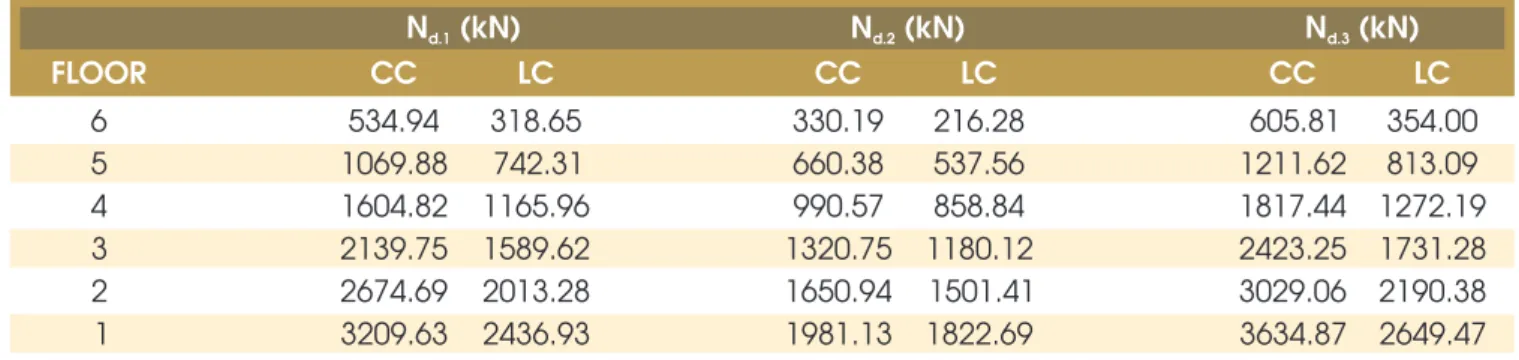
The wind load was considered in all combinations; therefore, the no-bearing walls were inished. The axial force on the columns on each loor were calculated based on the values of the loads con -sidered. Table 4 presents the values for all cases for a modulation
of 7.5 m and live load of 3 kN/m2.
The axial force is shown in dimensionless form in Table 5. This
form of presentation facilitates the association between the
in-crease in axial force and the inin-crease in the element’s stiffness. The loads acting on the structure were deined according to each load combination. Once the loads acting on the structure were de
-ined, the beam and column were characterized with the help of the M x N x 1/r diagrams, which were built using calculation tools developed in MARIN [19]. In this way, the strength and stiffness of
the elements were determined.
Figure 4 – Bending moment versus rotation curve
Table 2 – Cross sections in the structural arrangements
Cross section (cm x cm)
A (cm )
2s,tot
M (m)
Nº floors
40x40
50.4 [16
Ф
20 mm]
7.5 e 10
4
50x50
75.6 [24
Ф
20 mm]
7.5
5 e 6
The model created in ANSYS® [9] was motivated by the evalua -tion of global stability in the structural arrangements studied. The structural arrangements show different shapes, cross-sections of
the elements, and loads. In addition, the semi-rigid behavior of
the beam-to-column connection was considered. The model
ac-counted for PNL while using inite element BEAM188, enabling the relationship M x N x 1/r to be calculated. To evaluate the stabilities
of the arrangements, the γz coeficients were calculated from the displacements obtained in the process. These values varied from
1.05 to 1.20, indicating that the degree of PNL in the models ana
-lyzed was not signiicant.
In models with non-linearity, there were variations in the conigura
-tions of the axial forces on the columns because of the non-linear pro
-cesses. In the model analyzed there are GNL, PNL, and non-linearity
in the beam-to-column connection that has asymmetric behavior.
Changes in the axial forces on the columns would necessitate an iterative analysis in the construction of the M x N x 1/r diagram.
Table 3 – Characteristic wind loading for modulation with 7.5m
Wind Load - Direction Y
Modulation 7.5m
6 FLOORS
5 FLOORS
4 FLOORS
h(m)
S
2V (m/s)
k2
q (kN/m )
H/L1 C
aF (kN)
aH/L1 C
aF (kN)
aH/L1 C
F (kN)
a a4
0.76
34.20
0.717
0.80
1.24
28.11
0.67
1.21 27.43
0.53 1.18 26.75
8
0.80
36.00
0.794
0.80
1.24 31.46
0.67
1.21 30.70
0.53 1.18 29.94
12
0.85
38.25
0.897
0.80
1.24 34.97
0.67
1.21 34.12
0.53 1.18 33.28
16
0.89
40.05
0.983
0.80
1.24
37.41
0.67
1.21 36.50
0.53 1.18 17.40
20
0.91
40.95
1.028
0.80
1.24 39.09
0.67
1.21 18.66
24
0.93
41.85
1.074
0.80
1.24 19.97
h.: Floor height; H: Structure height ; V : Characteristic wind speed; S : Factor used in V ; q: Wind pressure; L1: Structure length; k 2 k
C : Pressure coefficient; F : Wind Load.a a
2
Table 4 – Axial force in columns (P50x50) for structure with modulation 7.5m and live load 3 kN/m
CC (Central Column); LC (Lateral Column); st
N : Axial force for 1 load combination in ULS, where the wind load was taken as main;d.1 nd
N : Axial force for 2 load combination in ULS, where the wind load was taken as single load;d.2 rd
N : Axial force for 3 load combination in ULS, where the live load was taken as main.d.3
N (kN)
d.1N (kN)
d.2N (kN)
d.3FLOOR
CC
LC
CC
LC
CC
LC
6
534.94
318.65
330.19
216.28
605.81
354.00
5
1069.88
742.31
660.38
537.56
1211.62
813.09
4
1604.82
1165.96
990.57
858.84
1817.44
1272.19
3
2139.75
1589.62
1320.75
1180.12
2423.25
1731.28
2
2674.69
2013.28
1650.94
1501.41
3029.06
2190.38
1
3209.63
2436.93
1981.13
1822.69
3634.87
2649.47
Table 5 – Dimensionless axial force
in columns (P50x50) for structure
2
with modulation 7.5m and live load 3 kN/m
n
d.1n
d.2n
d.3FLOOR
CC
LC
CC
LC
CC
LC
6
0.09
0.05
0.05
0.03
0.10
0.06
5
0.17
0.12
0.11
0.09
0.19
0.13
4
0.26
0.19
0.16
0.14
0.29
0.20
3
0.34
0.25
0.21
0.19
0.39
0.28
2
0.43
0.32
0.26
0.24
0.48
0.35
1
0.51
0.39
0.32
0.29
0.58
0.42
cd c
i d
f
A
N
i d
.
, ,=
Because the present study did not consider the effect of such axial force variations, the M x N x 1/r diagrams were constructed and used in the inite element model in one step.
Initially, the stiffness of elements in a precast concrete building with 6 loors was analyzed. According to the above methodology,
the reference bending moment for evaluating the stiffness reduc-tion in the elements depends on the resistant moment in the sec-tion and not on the loads acting on the element.
For each section of the elements in the study, M x N x 1/r diagrams
were constructed and analyzed, and the stiffness reduction
coef-icients were found. Functions to reduction stiffness related to the stiffness reduction coeficient and the dimensionless axial force are proposed. The reduction coeficients found using the stiffness
functions recommended by different standards are compared with
the values found from the M x N x 1/r diagrams.
After deining the value of the axial force and the load combinations acting on a section of a column, the M x N x 1/r diagrams were calcu
-lated. Figure 5 shows an example of a diagram using a stress value
(on the concrete) of 1.1 fcd and increasing the acting loads by γf (nd).
Table 6 shows the coeficients obtained from the M x N x 1/r di -agram that used a stress value (on the concrete) of 1.1 fcd and increased the acting loads by γf /γf3 (nd/γf3). This enabled the
de-termination of the stiffness reduction coeficients corresponding to
secant stiffness.
Analyzing the stiffness reduction coeficients shown in Table 6 with respect to the calculation combinations in ULS, the central column’s stiffness reduction coeficient varied from approximately 0.35 to 0.6, and the lateral column’s coeficient varied from ap
-proximately 0.35 to 0.5. Because of the greater effect of the axial force in the third combination, the stiffness reduction coeficient
found in the third combination of loads is greater than the stiffness
reduction coeficients found in the irst and second combination.
Table 6 – Stiffness reduction coefficient in columns (P50x50) for structure
2
with modulation 7.5m and live load 3 kN/m
st
a.1: Stiffness reduction coefficient in columns for 1 load combination (ULS);
nd
a.2: Stiffness reduction coefficient in columns for 2 load combination (ULS);
rd
a.3: Stiffness reduction coefficient in columns for 3 load combination (ULS).
a
.1a
.2a
.3FLOOR
CC
LC
CC
LC
CC
LC
6
5
4
3
2
1
0.366
0.343
0.345
0.333
0.375
0.347
0.430
0.397
0.384
0.366
0.446
0.404
0.493
0.441
0.422
0.409
0.501
0.453
0.514
0.492
0.459
0.443
0.527
0.498
0.539
0.509
0.495
0.483
0.566
0.516
0.583
0.528
0.507
0.501
0.625
0.538
Table 7 – Stiffness reduction coefficient calculated in each recommendation
n
: Dimensionless axial force;
l
: Slenderness ratio.
n
l
M x N x 1/r
NBR 6118:2003
ACI 318-08
FIB
9062:1985
NBR
PCI
0.58
27.71
0.625
0.800
0.471
0.429
0.758
0.162
0.58
63.74
0.625
0.800
0.471
0.498
0.758
0.038
0.03
27.71
0.333
0.500
0.471
0.280
0.758
0.015
0.03
63.74
0.333
0.500
0.471
0.283
0.758
0.038
Next, the values found for stiffness reducing according to the M x N x 1/r diagram were compared with the values obtained from the ap
-proximate functions recommended by standards. Two limiting situa
-tions based on the axial force and the slenderness are considered. With regard to the axial force, the maximum and minimum axial
force of the load combinations were considered. With regard to the slenderness, two hypotheses are considered because the
beam-to-column connections studied behave as semi-rigid. In the irst, the ef -fective length of the column corresponded to the difference in height
between loors. In the second, the effective length corresponded to the maximum value indicated for precast concrete structures with multiple loors that are unbraced. According to Elliott [24], this value is at least 2.3 times that of the height difference between loors. Table 7 presents the reduction coeficients obtained from the rec -ommendations in the technical literature. The effects of creep on
the columns were not considered. Thus, the creep coeficient j=0
in the construction of the M x N x 1/r diagram and in the expression from FIB [11] are used. Based on the formulas recommended by ACI 318-08 [10] and PCI [14], bd was 0.
The reduction coeficient recommended by NBR 6118:2003 [1] for columns is 0.8, while that for beams with symmetric reinforcement is 0.5. The reduction-coeficient variations depicted in Table 6 indi -cate no correspondence between the values found herein and the
reduction coeficients suggested for columns in NBR 6118:2003 [1]. Considering that due to the low-level axial force, the behavior of columns on the 6th loor is very similar to that of beams, the co
-eficient recommended by NBR 6118:2003 [1] can be interpreted
as 0.5. However, with symmetrical reinforcement, the value of the
reduction coeficient determined from the M x N x 1/r diagram is approximately 0.35.
The reduction coeficient obtained according to NBR 9062:1985 [12] does not agree with the values obtained for the stiffness re
-duction coeficient from the M x N x 1/r diagram, indicating that the latter is inadequate for the example studied. The values obtained according to ACI 318-08 [10] correspond well to the intermediate
sections of the column and, when compared to recommenda-tions from standards, the modulus of elasticity was the same as
NBR 6118:2003 [1].
The procedure presented by PCI [14] and FIB [11] consider the slen -derness of the column. However, considering the slen-derness of the
Figure 6 – Diagram of stiffness reduction
coefficient versus dimensionless axial force for
columns (P50x50) in structures with modulation
2 2
of 7,5 m with live load 3 kN/m and 5 kN/m
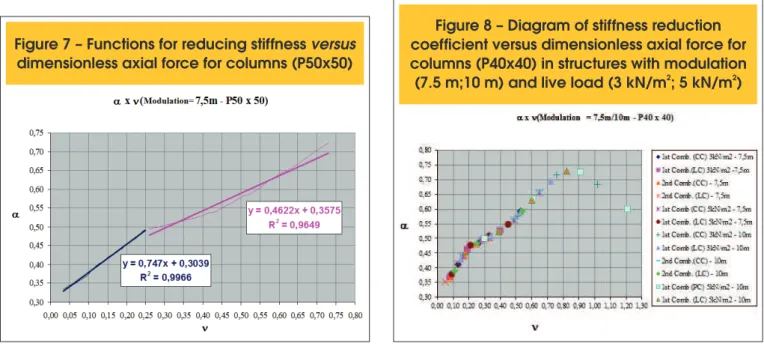
Figure 7 – Functions for reducing stiffness
versus
dimensionless axial force for columns (P50x50)
Table 8 – Functions for reducing stiffness
according to subdomains in dimensionless
axial force for columns (P50x50)
Stiffness reduction function
Subdomain (
n
)
α
= 0.75
ν
+ 1.10 (EsIs)/EI
0
⩽
ν
⩽
0.25
α
= 0.46
ν
+ 1.32 (EsIs)/EI
0.25 <
ν
⩽
0.75
Figure 8 – Diagram of stiffness reduction
coefficient versus dimensionless axial force for
columns (P40x40) in structures with modulation
2 2
column makes the analysis more complex because of the semi-rigid
connection and, consequently, the displacement of the structure.
The values obtained for the stiffness reduction coeficient according to PCI [14] for the two slenderness situations did not agree with the values obtained from the M x N x 1/r diagram. The values found from FIB [11] for dimensionless axial force equal to 0.03, were close to the values found with the M x N x 1/r diagram.
The rate and arrangement of the reinforcement as well as the value
of the axial force have a higher degree of inluence in the present
analysis. The analysis of secant stiffness occurs in each section of the element, and the slenderness of the element is related to the
analysis of the element’s stiffness as a whole.
The study for obtaining stiffness was performed for a structure with
6 loors and live load of 3 kN/m2 was also done for a live load with 5 kN/m2, as observed in the diagram of stiffness reduction coef-icients shown in Figure 6. Each data series shown in Figure 6 has 6 points. Each point corresponds to a stiffness reduction coeficient associated with a loor.
Figure 7 shows two approximations with linear variation divided into two subdomains. Functions for reducing stiffness according to
the respective sub-domains are proposed, as presented in Table
8. It should be noted with a value of approximately 0.25 for dimen
-sionless axial force, there is a change in the rate of the element’s
increase in stiffness.
The same procedure was performed for columns with
cross-sec-tions of 40 x 40 cm and 60 x 60 cm. This report depicts only the study designed for the columns with a 40 x 40 cm cross-section
because, in this case, the variation of stiffness decreases upon
reaching a certain level of axial force. Figure 8 shows the variation in the stiffness reduction coeficient according to the dimension
-less axial force and the modulations and loads to which the col
-umns (40 x 40 cm) were subjected.
In Figure 9, it is possible to evaluate the variation in stiffness reduction coeficients according to the three subdomains and, respectively, the three approximate functions. The portion as
-sociated with reinforcement in the reduction stiffness coeficient has a value of 0.26 when the reinforcement’s area and provision is P(40x40). According to the M x N x 1/r diagram, the reduc
-tion coeficient associated with zero dimensionless axial force is equal to 0.319.
For the column with a cross-section of 40 x 40 cm, the stiffness de
-creased when the value of the dimensionless axial force reached 0.9. This behavior was not observed for other column sections be
-cause the axial force level was lower. Figure 10 shows the M x N x 1/r diagram (for the column with a 40 x 40 cm section), which
was constructed with a concrete stress of 1.1 fcd and increasing acting loads by γf /γf3 (nd/γf3), a modulation of 10 m, and a live load
of 5 kN/m2.
Table 9 presents proposed functions for reducing stiffness accord
-ing to respective sub-domains for columns with sections of 40 x 40 cm, 50 x 50 cm, and 60 x 60 cm. Additionally, a function for
reducing average stiffness for each section studied are proposed. The numerical simulations were designed based on different
col-umn cross-sections, according to the number of loors and the
Figure 9 – Functions for reducing stiffness
versus
dimensionless axial force for columns (P40x40)
load combination in central column P40x40
Figure 10 – M x N x 1/r diagram for first
Table 9 – Functions for reducing stiffness according to sub-domains
in dimensionless axial force for columns (P40x40. P50x50. P60x60)
Stiffness reduction function (a)
Cross Section (cm)
0
⩽
n
⩽
0.25
0.25 <
n
⩽
0.85
0.85 <
n
⩽
1.20
40 x 40
0.67
ν
+ 1.15(E
sI
s)/EI
0.48
ν
+ 1.20(E
sI
s)/EI
–0.24
ν
+ 3.50(E
sI
s)/EI
50 x 50
0.75
ν
+ 1.10(E
sI
s)/EI
0.46
ν
+ 1.32(E
sI
s)/EI
---
60 x 60
0.73
ν
+ 1.12(E
sI
s)/EI
0.44
ν
+ 1.29(E
sI
s)/EI
---
modulation used. Table 10 shows the intervals of stiffness
reduc-tion coeficients obtained for the columns in the models analyzed. The lowest values correspond to the highest loors, and the high
-est values correspond to the low-est loors. For the average values, the reduction coeficients range from 0.5 to 0.6. These coeficients are smaller than the values recommended by NBR 6118:2003 [1], which are 0.7 to 0.8.
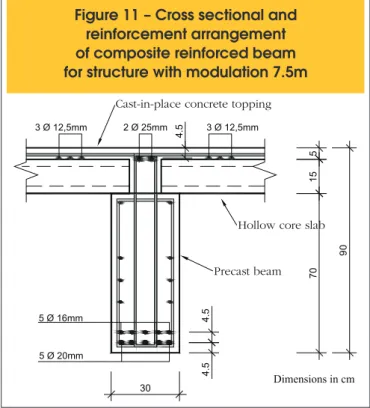
The effects of adopting prestressing steel and non-prestressing
steel in the precast concrete beams arranged on the central axis of the lay-out showed in the Figure 2 are also evaluated. Figure
11 shows the section of the precast concrete beam used in all the
loors with fck=35 MPa and a section composed of topping with fck=20 MPa. The non-prestressing steel uses steel CA-50.
Only the main reinforcement was used in constructing the M x N x 1/r diagram. Figure 12 shows the M x N x 1/r diagram for the beam, which is shown in Figure 11, with a linear coeficient of creep equal to 0 and 2. In constructing the M x N x 1/r diagram, due to the
strength differences between beams made of precast concrete and those made with concrete cast on site, the section related to positive bending moment was built with fck=20 MPa, and the sec -tion related to negative bending moment was built with fck=35 MPa.
Table 11 shows the stiffness reduction coeficient versus the coef
-icient of creep for positive bending moment and negative bending moment. The signiicant decrease in the stiffness reduction coef
-icient as it relates to the progression of creep can be notice. The reduction coeficient shown by NBR 6118:2003 [1] for beams
with asymmetrical reinforcement is 0.4, a value similar to that found for secant stiffness with positive bending moment and a
lin-ear coeficient of creep equal to 0.
Figure 13 summarizes the evaluation of the effect of using pre -stressing steel in the cross-section of the precast concrete beam.
Table 10 – Distribution of stiffness reduction coefficient in columns
Modulation
Cross Section
Nº Floors
Live load (kN/m )
2
a
7.5
50 x 50
6
3
0.35 - 0.60
7.5
50 x 50
6
5
0.35 - 0.70
10.0
60 x 60
6
3
0.40 - 0.70
10.0
60 x 60
6
5
0.40 - 0.77
7.5
40 x 40
4
3;5
0.35 - 0.65
10.0
40 x 40
4
3;5
0.40 - 0.76
Figure 11 – Cross sectional and
reinforcement arrangement
of composite reinforced beam
for structure with modulation 7.5m
70
15
5
30
4.
5
4.
5
90
5 Ø 20mm
2 Ø 25mm 3 Ø 12,5mm
4.
5
5 Ø 16mm 3 Ø 12,5mm
Dimensions in cm
Precast beam Hollow core slab Cast-in-place concrete topping
Figure 12 – M x N x 1/r diagram in composite
reinforced beam for structure
with modulation 7.5m
Table 11 – Stiffness reduction coefficient
in composite reinforced
beam for structure with modulation
7.5m and creep effect
Creep
coefficient (
j
)
0
1
2
3
M (a)
pos0.467
0.340
0.267
0.220
Figure 13 – Cross sectional and
reinforcement arrangement of
composite prestressed beam for
structure with modulation 7.5m
70
15
5
30
5
4.
5
90
5 strands
2 Ø 25mm 3 Ø 12,5mm
5
3 Ø 16mm 3 Ø 12,5mm
Dimensions in cm
Precast beam Hollow core slab Cast-in-place concrete topping
4 strands
The precast concrete beam has fck = 40 MPa, and the concrete cast on the site has fck = 20 MPa. Prestressing steel of the section
is made of strands CP 190 RB 12.7, and non-prestressing steel is made of steel CA-50.
Figure 14 shows the M x N x 1/r diagram, which is modiied for
prestressing steel, and Table 12 shows the stiffness reduction
co-eficients obtained using prestressing steel on the section bottom
and non-prestressing steel on the upper part of the beam.
5. Final remarks and conclusions
Based on the cross-sections, arrangements, reinforcement rates,
and materials used in this study, the following conclusions can
be drawn:
Figure 14 – M x N x 1/r diagram in composite
prestressed beam for structure
with modulation 7.5m
Table 12 – Stiffness reduction
coefficient in composite prestressed
beam for structure with
modulation 7.5m and creep effect
Creep
coefficient (
j
)
0
1
2
3
M (
posa
)
M (
nega
)
0.570
0.402
0.311
0.253
0.211
0.150
0.116
0.095
a) The procedures and recommendations of national codes
regard-ing the simpliied consideration of PNL are less comprehensive
than the procedures and recommendations of international codes.
b) The reduction coeficients obtained from the M x N x 1/r dia -gram differ from the normative indicators obtained with a
sim-pliied PNL, mainly due to the effects of creep, axial force, and prestressing steel. The reduction coeficients are inluenced by the levels of axial force and, consequently, vary according to
the combination of loads used.
c) The rate of increase in stiffness changes when the value of the
axial force is approximately 0.25.
d) According to the studies performed, increasing the level of the axial force increases the stiffness of the sections. However, the section’s stiffness decreases after reaching a threshold value of axial force. In the numerical simulation evaluated herein, a value for the dimensionless axial force of approxi
-mately 0.9 is obtained and a reversal in the trend of increas -ing stiffness is observed.
The following conclusions are limited to the structural arrange-ments, loads, and type of connection used in the structural system studied herein. They serve as a basis of comparison with the
coef-icients of stiffness from NBR 6118:2003 [1] as follows:
a) The stiffness reduction coeficients obtained for columns with
the arrangements analyzed herein showed average values from 0.5 to 0.6.
b) The values found for the stiffness reduction coeficients in the
concrete beams, which were subjected to the effects of creep
with a linear coeficient of 0 to 3, varied from 0.45 to 0.2 for posi -tive bending moment and 0.3 to 0.2 for nega-tive bending
mo-ment. In the elements with prestressing steel, the reduction coef
-icients obtained ranged from 0.55 to 0.25 for positive bending
moment, and from 0.25 to 0.1 for negative bending moment.
It is important to notice that the purpose of this study was to inves -tigate stiffness reduction for a typical case study that has a multi-storey precast concrete structure and a particular semi-rigid con-nection. Therefore, the conclusions are limited, however, they can
be useful for comparisons with values from NBR 6118:2003 [1].
6. Acknowledgements
We are grateful to LEONARDI Industrialized Construction for its developmental support of this research and to the Foundation for Research Support in the State of São Paulo (FAPESP – Fundação de Amparo a Pesquisa do Estado de São Paulo) for its help with
7. References
[01] ASSOCIAÇÃO BRASILEIRA DE NORMAS TÉCNICAS. NBR 6118 (2003). NBR 6118: Projeto de estruturas de concreto - Procedimento. Rio de Janeiro.
[02] HOGESLAG, A. J. (1990). Stability of precast concrete structures. In: HOGESLAG, A. J.; VAMBERSKY, J. N. J. A.; WALRAVEN, J. C. Prefabrication of concrete structures (Proc. Int. Seminar Delft, The Netherlands, October, 25-26, 1990). Delft: Delft University Press, 1990. p.29-40.
[03] CHEFDEBIEN A. de & DALDARE J. (1994). Experimental investigations on current connections between precast concrete components. COST C1 Proc. of 2nd Workshop Semi-rigid Behaviour of Civil Engineering Structural Connections, Prague, p. 21-30. [04] ELLIOTT, K. S.; DAVIES, G.; MAHDI, A.; GORGUN,
H.; VIRDI, K. & RAGUPATHY P. (1998). Precast
concrete semi-rigid beam-to-column connections in
skeletal frames. COST C1 Proc. of The International Conference, Control of Semi-rigid Behaviour of Civil Engineering Structural Connections, Liège, p. 45-54. [05] KERONEN A. & HIETALA J. (1998). Tests and
analysis of the connections in precast concrete
portal frame. COST C1 Proc. of The International Conference, Control of Semi-rigid Behaviour of Civil Engineering Structural Connections, Liège, p. 25-34. [06] CHEFDEBIEN, A. de (1998). Precast concrete beam
to column head connections. COST C1 Proc. of The International Conference, Control of Semi-rigid Behaviour of Civil Engineering Structural Connections, Liège, p. 35-43.
[07] ELLIOTT, K.S.; DAVIES, G.; FERREIRA, M.. GORGUM, H.; MAHADI, A.A. (2003a). Can precast
concrete structures be designed as semi-rigid frames?
Part 1: The experimental evidence. The structural engineer. v.81, n.16 p. 14-27.
[08] ELLIOTT, K.S.; DAVIES, G.; FERREIRA, M.. GORGUM, H.; MAHADI, A.A. (2003b). Can precast
concrete structures be designed as semi-rigid frames?
Part 2: Analytical equations & column effective length factores. The structural engineer. v.81, n.16 p. 28-37 [09] ANSYS RELEASE 10.0 (2005). Documentation for
Ansys. 1st ed. Chicago, USA.
[10] AMERICAN CONCRETE INSTITUTE (2008). ACI 318-08: Building Code Requirements for Structural Concrete and Commentary. Farmington Hills. [11] FÉDÉRATION INTERNACIONALE DU BETON
(2002). Design examples for FIP recommendations ‘ practical design of structural concrete’, Bulletin FIB, Lausanne, v.16.
[12] ASSOCIAÇÃO BRASILEIRA DE NORMAS TÉCNICAS. NBR 9062 (1985). NBR 9062: Projeto e execução de estruturas de concreto pré-moldado. Rio de Janeiro. [13] ASSOCIAÇÃO BRASILEIRA DE NORMAS TÉCNICAS.
NBR 9062 (2006). NBR 9062: Projeto e execução de estruturas de concreto pré-moldado. Rio de Janeiro. [14] Recommended practice for the design of prestressed
concrete columns and walls (1988). Journal of
Presstressed Concrete Institute, Chicago, v.33, n. 4, p. 56-95.
[15] CARVALHO, R. C.; FIGUEIREDO, J. R. (2004). Cálculo e detalhamento de estruturas usuais de concreto armado. São Carlos. EdUFSCar.
[16] FRANÇA, R.L.S. (1991). Contribuição ao estudo dos
efeitos de segunda ordem em pilares de concreto
armado. 232f. Tese (Doutorado) - Escola Politécnica, Universidade de São Paulo, São Paulo, 1991. [17] ASSOCIAÇÃO BRASILEIRA DE NORMAS TÉCNICAS.
NBR 8681 (2003). NBR 8681: Ações e segurança nas estruturas - Procedimento. Rio de Janeiro.
[18] FÉDÉRATION INTERNACIONALE DU BETON (1999). Structural concrete: textbook on behavior on design and performance update of the CEB/FIP model code 1990. Bulletin FIB. Lausanne, v.1-3.
[19] MARIN, M.C. (2009). Contribuição à analise da
estabilidade global de estruturas em concreto
pré-moldado de múltiplos pavimentos. 213f. Dissertação (Mestrado) - Escola de Engenharia de São Carlos, Universidade de São Paulo, São Carlos, 2009. [20] FUSCO, P.B. (1981). Estruturas de concreto:
solicitações normais, estados limites, teoria e aplicações. Rio de Janeiro: Guanabara Dois.
[21] OLIVEIRA, P.H.S. (2004). Processo aproximado para
consideração da não-linearidade física de pilares em
concreto armado. 208f. Dissertação (Mestrado) - Escola Politécnica, Universidade de São Paulo, São Paulo, 2004.
[22] EL DEBS, M.K.; MIOTTO, A.M.; EL DEBS, A.L.H.C. (2010). Analysis of a semi-rigid connection for precast concrete. Buildings & Structures.
[23] ASSOCIAÇÃO BRASILEIRA DE NORMAS TÉCNICAS. NBR 6123 (1988). NBR 6123: