ABSTRACT: This study presents the complex index of refraction and the complex permittivity of a magnetic ceramic material made of copper, cobalt, and iron oxides. The index of refraction and the extinction coeficient of the CuCo-ferrite exhibit an almost frequency independent behavior and were averaged to n = 3.62 ± 0.05 and k = 0.06 ± 0.02, respectively, over the frequency range from 0.2 to 1 THz. The corresponding complex permittivity was ε’ = 13.12 ± 0.35 for the real part and ε’’ = 0.46 ± 0.15 for the imaginary one. The absorption coeficient and the transmittance of the CuCo-ferrite were also determined. The absorption coeficient exhibits a dip at ~0.35 THz, which corresponds to a peak in transmittance at this frequency. The impact of the observations on the potential realization of novel THz electronic devices is discussed.
KEYWORDS: Ferrites, Refractivity, Permittivity, Transmission, Terahertz.
Copper Cobalt Magnetic Ceramic Materials
Characterization at Terahertz Frequencies
Alan Fernando Ney Boss1, Antonio Carlos da Cunha Migliano1,2, Ingrid Wilke3
INTRODUCTION
During the last decades, an unexplored gap in the electromagnetic spectrum has been massively studied. his gap is described nowadays as terahertz (THz) frequency range and it is located between microwave and infrared frequencies. Usually, the THz frequency range is defined between 0.1 and 10 THz (Lee 2009), although it is also possible to ind deinitions between 0.3 and 3 THz (Phillips 2011).
Several methods to achieve these frequencies have been developed and studied. Some sources that generate THz waves are the photomixer (McIntosh et al. 1995), the quantum cascade laser (Williams 2007), the microwave frequency multiplier (Li and Yao 2010), the backward wave oscillator (Mineo and Paoloni 2010), the free electron laser (Williams 2002), synchrotron light sources (Roy et al. 2006), and so on. Among all these methods, a commonly one used is the THz Time-Domain Spectroscopy (THz-TDS) system, which has the advantage to measure the amplitude and phase of THz electromagnetic radiation in the time domain, allowing a large frequency range to be evaluated in a single run. THz-TDS systems usually utilize photo-conductive antennas or electro-optic crystals excited by femtosecond near-infrared laser pulses as THz radiation sources and detectors, combined with lock-in detection and a time delay stage (Bründermann et al. 2012).
THz frequencies may ind use in medicine (Siegel 2004), as an alternative to X-rays in certain imaging applications (Hu and Nuss 1995), in security for detecting explosives (Shen et al. 2005), in narcotics identiication systems (Lu et al. 2006), in bio-defense (Woolard et al. 2003; Kemp 2011), in chemistry and biology for materials identiication (Fischer et al. 2005;
1.Departamento de Ciência e Tecnologia Aeroespacial – Instituto Tecnológico de Aeronáutica – Ciências e Tecnologias Espaciais – São José dos Campos/SP – Brazil.
2.Departamento de Ciência e Tecnologia Aeroespacial – Instituto de Estudos Avançados – Divisão de Física Aplicada – São José dos Campos/SP – Brazil.
3.Rensselear Polytechnic Institute – Department of Physics, Applied Physics and Astronomy – Terahertz and Ultrafast Spectroscopy Laboratory – Troy/NY – USA.
Author for correspondence: Alan Fernando Ney Boss | Departamento de Ciência e Tecnologia Aeroespacial – Instituto Tecnológico de Aeronáutica – Ciências e Tecnologias Espaciais | Praça Marechal Eduardo Gomes, 50 - Vila das Acácias | CEP: 12.228-900 – São José dos Campos/SP – Brazil | Email: [email protected]
Kiwa et al. 2007), and other areas such as astronomy (Kulesa 2011; Smirnov et al. 2012), space science (Siegel 2007), plasma physics (Tauk et al. 2006), and aerospace applications (Petkie et al. 2009; Chen 2007).
In aerospace applications, THz radiation can be used to investigate the Radar Cross Section (RCS) of miniature models of airplanes (Iwaszczuk et al. 2010; Li et al. 2013), which reduces the expenses with real airplanes in anechoic chambers. Also, it is possible to perform nondestructive evaluations of materials used in airplanes, such as foams, paints, and iberglass composites (Quast et al. 2010).
Another type of material that has been studied at THz frequencies and may be applied to aerospace technology are metamaterials, i.e., artiicial materials that present negative permittivity or permeability (Capolino 2009). An example of THz metamaterials is presented by Takano et al. (2013), where TiO2 ceramic balls placed in a metallic grid were used to create a material with negative permittivity and permeability.
Although common ceramics have been previously used for THz applications, we could not ind major studies at THz frequencies about magnetic ceramic materials, also known as ferrites. he lack of information about the properties of these materials, such as index of refraction and complex permittivity, prevents the design and development of novel THz devices. his has motivated us to characterize ferrites at THz frequencies.
he solid state reaction route is a state-of-the-art method for the fabrication of magnetic ceramics (Brito et al. 2009) and achieves the desired composition of a ceramic by weighting powders previously calculated with stoichiometric formula of the ceramic. his process is reproducible if well controlled. Some parameters such as powder granulation, material mixing, and sintering temperature have inluence on the material formation and grain size. In this paper, we describe the CuCo-ferrite fabrication process, the THz-TDS system characteristics as well as optical and dielectric properties of a CuCo-ferrite sample measured with a THz-TDS system.
MATERIALS AND METHODS
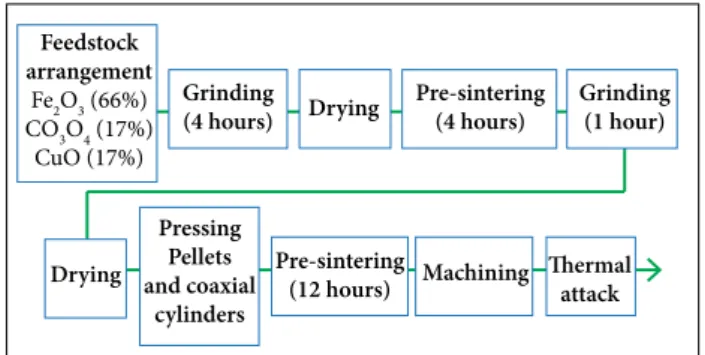
SAMpLE CHARACTERISTICShe sample explored in this study is a CuCo ferrite with the stoichiometry Cu0.5Co0.5Fe2O4. his ferrite was made following the steps described in Fig. 1. Conditions such as weighting the powders and sintering temperature have influence on
the sample characteristics, i.e., a temperature higher than the Curie temperature will melt and fuse the material. Samples were pressed in a cylindrical shape, with a diameter close to 6.4 mm. Sample thickness and latness were adjusted in the inal steps, when the samples were submitted to sandpapering and polishing. Ater machining the samples, they were submitted to a thermal attack to release internal mechanical stress.
Sample thickness has a direct influence on the THz transmission signal, which requires some precautions during sample preparation. If a sample is too thin it may present multiple relections and create an etalon efect ater a Fourier transformation of the transmitted signal. If the sample is too thick, it may strongly attenuate the transmission signal, which afects the peak to peak time delay analysis.
Sample diameter should also be considered since it will drive the sample holder size and may affect the detection of low frequencies. Also, the sample should be as flat and plane-parallel as possible in order to avoid imprecise measurements of the sample thickness and peak to peak time delay analysis.
Inhomogeneous samples may present regions with different concentrations of materials. This may affect the transmitted signal, which will affect the index of refraction calculation. Scanning Electron Microscope (SEM) and Energy-Dispersive X-ray Spectroscopy (EDS) are useful to visualize the surface and make a semi-quantitative prediction of material distribution.
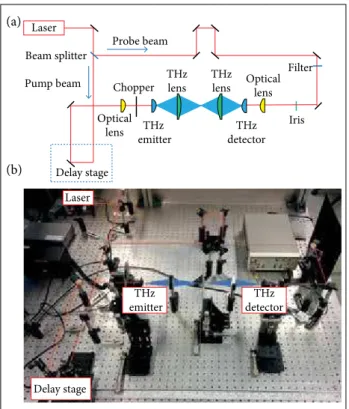
THz TIME-DOMAIN SpECTROSCOpy SySTEM A THz-TDS transmission system (Perenzoni and Paul 2014) was used in these experiments, but, instead of using parabolic mirrors to guide the THz waves, 50-mm tsurupica lenses were employed. A scheme and a picture of the assembled system is presented in Fig. 2.
Figure 1. Steps of sample preparation.
Feedstock arrangement
Fe2O3 (66%) CO3O4 (17%)
CuO (17%)
Pressing Pellets and coaxial
cylinders Grinding (4 hours)
Pre-sintering (4 hours)
Pre-sintering (12 hours)
Grinding (1 hour) Drying
Here, the beam splitter divides the laser beam into pump and probe beams. he pump beam hits the iPCA-21-05-1000-800-h emitter (Batop Electronics 2016b), which has an active antenna area of 1 mm2. The probe beam is focused on the 5 µm antenna gap of the PCA-40-05-10-800 detector (Batop Electronics 2016a). In order to attenuate an echo spot caused by the beam splitter an iris was placed right before the optical lens that focuses the probe beam on the detector. his reduces the echo spot and avoids an etalon effect in the analysis. Since the active area of the emitter is bigger than the gap in the detector, the delay stage is placed in the pump beam. his reduces errors caused by laser drit when the delay stage is scanning.
The laser beam was modulated with a mechanical chopper right before the emitter. The modulation frequency is transmitted to the lock-in amplifier, which used this reference frequency to filter the signal from noise through phase-sensitive detection.
Since the sample diameter is about 6.4 mm, the sample holder aperture is about 5 mm. his ensures that there is no THz signal being transmitted directly to the detector. We can estimate the frequencies that will be afected by the sample holder aperture using the Gaussian intensity distribution across the THz radiation beam:
f = c × z/π × ω
2Laser
Delay stage
THz emitter
THz detector THz
emitter
THz detector
Iris Filter Probe beam
Beam splitter Laser
Pump beam
Delay stage
Optical lens
Optical lens
THz lens THz lens Chopper
Figure 2. THz-TDS transmission setup using two 50-mm tsurupica THz lenses. (a) Scheme; (b) Picture.
where: f is the THz radiation frequency in Hz; c is the speed of light; z is the focal lengths of the THz lens; ω is the THz radiation beam waist.
If we consider that the maximum beam waist will have the size of the aperture, we can estimate that the minimum frequency that will not be afected is approximately ~191 GHz using the 50-mm THz lenses. Frequencies below 191 GHz may be compromised since the focal spot diameter formed by this wavelength (λ = c/f) will be bigger than the aperture. he maximum frequency is determined by the noise loor of the signal ater a Fourier transformation.
he peak to peak time delay is the diference in time of the same peak in the reference signal and in the sample signal. his can be better understood in Fig. 3, where the sample signal has a Δt time diference from the reference signal.
It is possible to perform a rough estimate of the index of refraction of the material under investigation using the time delay Δt considering:
(1)
(2)
Δ
t = (n – 1)d/c
where: n is the index of refraction; d is the thickness.
Time
Reference Sample ∆t
E
le
ct
ric
fie
ld
Figure 3. Peak to peak time delay illustration.
RESULTS AND DISCUSSION
Our investigation of the CuCo ferrite starts with an EDS analysis of the sample (Fig. 4). From this semi-quantitative analysis, we confirm that the CuCo ferrite is an inhomogeneous material. Some regions between grains present a concentration of copper and a lack of iron, while
(a)
cobalt seems equally distributed throughout the sample. Since our THz analysis has a minimum frequency stablished at ~0.2 THz, we can estimate that an area with the size close to the respective wavelength (~1.5 mm) should not be an issue, since the measurement would predict the average composition of the sample. Higher frequencies although may present diferences due the material distribution characteristic. In order to ensure a proper characterization, measurements were performed on both sides of the sample and then compared.
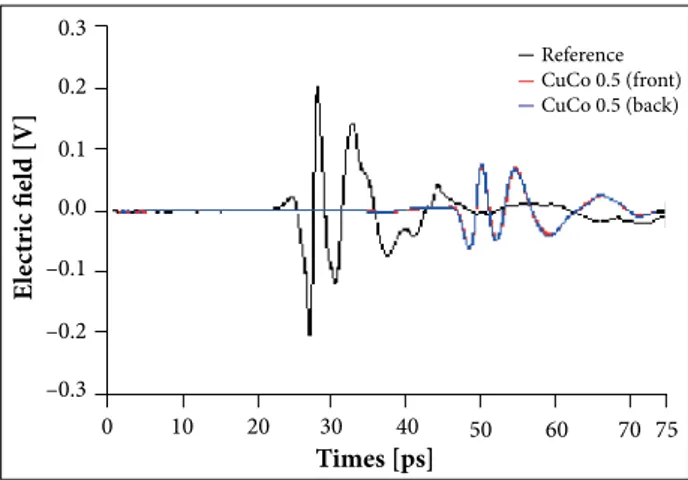
THz analysis requires a reference measurement, which is a measurement of the THz radiation pulse passing through the empty sample holder. After the reference measurement, the sample is placed on the sample holder to be irst measured and then it is lipped to be measured again. he voltage measured by the lock-in ampliier, which is proportional to the THz electric ield (E-ield) is sent to a computer with the respective information of the delay stage position. he position is then converted to time and the inal data is provided in time (ps) by voltage (V). The reference signal measured with a time resolution of 20 fs as well as the front and back measurements of the sample are visualized in Fig. 5.
We notice a ver y slight difference between both sample measurements. The time delay of the front and back measurements are 22.173 and 22.162 ps, respectively. Since our sample has 2.54 mm thickness, we estimated a index of refraction of 3.619 for the front side and 3.618 for the back side.
The Fourier transforms of the measured signals are presented in Fig. 6. Here, we estimate the high frequency limit of the measurement for our analysis. The reference signal approaches the noise floor around 1.2 THz, while the
0.3
0.2
0.1
0.0
–0.1
–0.2
–0.3
0 10 20 30 40 50 60 70 75
Times [ps]
E
le
ct
ric
fie
ld
[
V]
Reference CuCo 0.5 (front) CuCo 0.5 (back)
1
0.1
0.01
1E-3
1E-4
1E-5
1E-6
0.0 0.2 0.4 0.6 0.8 1.0 1.2 1.4 1.6 1.8 2.0
Frequency [THz]
A
m
p
li
tu
d
e [a
rb
it
ra
ry uni
ts]
Reference CuCo 0.5 (front) CuCo 0.5 (back)
Figure 5. Reference and sample measurements in the time domain.
Figure 6. Reference and sample measurements in the frequency domain. From this analysis it was determined that the investigation ranged from 0.2 to 1 THz.
Figure 4. SEM image of the CuCo sample (a), Iron (b), Copper (c), and Cobalt (d) in the same region analyzed with EDS.
(a)
200 μm 500 μm 500 μm 500 μm
(b) (c) (d)
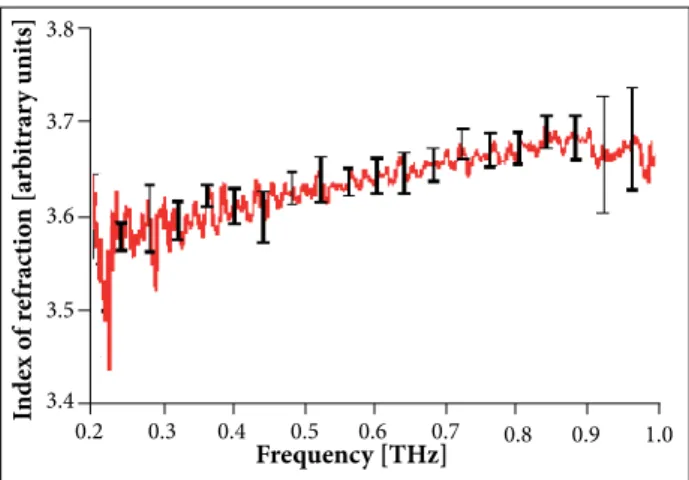
After the Fourier transformation of the signals we calculated the ratio of the Fourier transforms. This provide us the complex transmission coefficient, which is used to calculate the complex index of refraction (Peiponen et al. 2013). Figure 7 presents the complex index of refraction for both sample measurements, i.e., the index of refraction and the extinction coefficient for both sides of the CuCo ferrite. We notice a small difference of the measured index of refrac-tion for the front and back side of the sample, above 0.85 THz. This is attributed to differences in the surface roughness of the front and back side. In our analysis, the index of refraction is considered to be frequency independent within the 0.2 to 1.0 THz frequency band. The extinction coefficient assumes values between k = 0.05 to k = 0.10.
To validate the assembled system, as well as the THz measurement made with it, we compared the index of refraction in Fig. 7 with the index of refraction calculated from time-domain THz transmission measurements performed with a diferent THz-TDS system (Fig. 8). his system is a commercial THz-TDS spectrometer that uses two lasers and an optical trigger (Klatt et al. 2009) instead of a single laser and a mechanical delay stage. he advantage is a faster measurement with higher resolution. he disadvantage is the high cost of the system, inability to change the system setup and energy per THz-radiation pulse.
Since the index of refraction in Figs. 7 and 8 are close, our further analysis will be only with data provided from the THz-TDS assembled system. This is because the assembled system has a lower resolution over the frequency, which provides a smooth curve over the frequency range.
he complex index of refraction of Fig. 7 is converted to complex permittivity by using the relations real permittivity
ε’ = n2– k2 and imaginary permittivity ε” = 2nk for the real
and imaginary parts, respectively. Table 1 presents averaged values over the frequency of the index of refraction, extinction coeicient, real permittivity and imaginary permittivity for both measurements of the CuCo ferrite.
0.50 0.45 0.40 0.35 0.30 0.25 0.20 0.15 0.10 0.05 0.00 0.2
n of CuCo 0.5 (front)
n of CuCo 0.5 (back)
k of CuCo 0.5 (front)
k of CuCo 0.5 (back)
0.3 0.4
Frequency [THz]0.5 0.6 0.7 0.8 0.9 1.0 Ext
inc ti o n c o e ffi ci en t [a rb it ra ry uni ts] 4.0 3.8 3.6 3.4 3.2 3.0 2.8 2.6 2.4 2.2 2.0 R ef rac ti o n ind ex [a rb it ra ry uni ts] 0.2 3.4 3.5 Ind ex o f r ef rac ti o n [a rb it ra ry uni ts] 3.6 3.7 3.8
0.3 0.4 0.5 0.6 0.7 0.8 0.9 1.0
Frequency [THz]
Figure 7. Index of refraction and extinction coeficient of the CuCo sample.
Figure 8. Index of refraction of the CuCo sample measured with THz-TDS spectrometer using optical trigger.
Parameters CuCo 0.5
front
CuCo 0.5 back
Index of refraction 3.62 ± 0.05 3.62 ± 0.04
Extinction coeicient 0.06 ± 0.02 0.06 ± 0.02
Real permittivity (ε’) 13.12 ± 0.35 13.12 ± 0.31
Imaginary permittivity (ε”) 0.46 ± 0.15 0.42 ± 0.11
Table 1. Averaged index of refraction, extinction coeficient, real and imaginary permittivity of the CuCo 0.5 ferrite over the frequency from 0.2 to 1 THz.
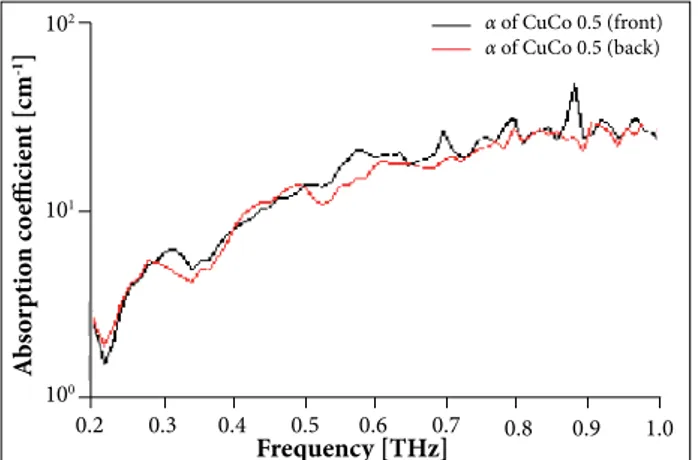
From the extinction coefficient, the power absorption coeicient is calculated using α(f) = (4πf)k(f)/c (Perenzoni and Paul 2014) — Fig. 9. Since the absorption coefficient is calculated considering the frequency dependence of the extinction coeicient, characteristics of the data previously seen in Fig. 7, such as the spike in k for the front measurement above 0.85 THz are observed again in Fig. 9. However, there is a small disturbance at ~0.35 THz on both measurements that was not noticed before.
with others stoichiometries of this ferrite. This may indicate a potential use of this material for THz frequency devices, such as filter.
0.2 –0.05
T
ra
ns
mi
tta
nc
e
0.50 0.45 0.40 0.35 0.30 0.25 0.20 0.15 0.10 0.05 0.00
0.3 0.4 0.5 0.6 0.7 0.8 0.9 1.0
Frequency [THz]
t of CuCo 0.5 (front)
t of CuCo 0.5 (back)
Figure 10. Transmittance in the frequency domain of the sample measurements.
considered to be relevant for the analysis of measurements in the 0.2 to 1 THz frequency band but may become an issue at higher frequencies, where 2 different sites on the sample may present different materials concentrations in the focal spot of the THz radiation beam.
We validate the THz system assembled, as well as the sample’s characteristic, by comparing the index of refraction calculated with another THz-TDS system. We also presented the average values for the complex index of refraction and complex permittivity. he index of refraction was around n = 3.62 and the extinction coeicient, around k = 0.06. he real permittivity was ε’ = 13.12 and the imaginary one, below ε” = 0.46.
Also, the power absorption coefficient and transmittance were calculated and discussed. A small discontinuity in the power absorption coefficient and transmittance close to ~0.35 THz was observed. This may be an indication that other sample stoichiometries may present transmission and absorption characteristics that can be useful for the development of novel THz devices, such as filters.
ACKNOWLEDGEMENTS
Boss AFN thanks the Pró-Estratégia and Demanda Social of the Coordenação de Aperfeiçoamento de Pessoal de Nível Superior (CAPES) for the national scholarships and the Ciências sem Fronteiras of the Conselho Nacional de Desenvolvimento Científico e Tecnológico (CNPq) for the international scholarship. Migliano ACC thanks the Fundação de Amparo à Pesquisa do Estado de São Paulo (FAPESP) for supporting the project 2012//01448-2 and t he CT-INFR A 2013 of t he Financi amento de Estudos e Projetos (FINEP). Wilke I acknowledges a c aref u l pro of re ading of t he manus cr ipt draf t by Charles Khachian from the Rensselaer Polytechnic Institute.
AUTHOR’S CONTRIBUTIONS
Boss AFN and Migliano ACC conceived the idea and discussed about the material preparation; Boss AFN and Wilke I performed the experiments, co-wrote the main text, discussed the results and comments on the manuscript.
α of CuCo 0.5 (front)
α of CuCo 0.5 (back)
0.2 100
A
bs
o
rp
ti
o
n c
o
effi
ci
en
t [cm
-1]
101 102
0.3 0.4 0.5 0.6 0.7 0.8 0.9 1.0
Frequency [THz]
Figure 9. Absorption coeficient in the frequency domain.
CONCLUSION
In this study, we described the fabrication of copper cobalt ferrite Cu0.5Co0.5Fe2O4and the characterization of the dielectric properties of this material in the THz fre-quency range. The sample was prepared using a state-of-the-art s olid state reac tion route, and the THz f requenc y characterization was performed with a THz-TDS transmission system.
Batop Electronics (2016a) Instruction manual and data sheet PCA-40-05-10-800-x; [accessed 2016 Jul 18]. http://www. batop.com/products/terahertz/photoconductive-antenna/data-sheet/manual_PCA-40-05-10-800.pdf
Batop Electronics (2016b) Instruction manual and data sheet iPCA-21-05-1000-800-h; [accessed 2016 Jul 18]. http://www. batop.com/products/terahertz/photoconductive-antenna/data-sheet/manual_iPCA-21-05-1000-800-h.pdf
Brito VLO, Migliano ACC, Lemos LV, Melo FCL (2009) Ceramic processing route and characterization of a Ni-Zn ferrite for application in a pulsed-current monitor. Progress in Electromagnetics Research 91:303-318. doi: 10.2528/ PIER09031603
Bründermann, E, Hübers H-W, Kimmitt MF (2012) Terahertz techniques. Berlin: Springer.
Capolino F (2009) Application of metamaterials. In: Bründermann E, Hübers HW, Kimmitt MF (2012) Terahertz techniques. Berlin: Springer.
Chen CH (2007) Ultrasonic and advanced methods for nondestructive testing and material characterization. Singapore: World Scientific Publishing.
Fischer B, Hoffmann M, Helm H, Modjesch G, Jepsen PU (2005) Chemical recognition in terahertz time-domain spectroscopy and imaging. Semicond Sci Technol 20:S246-S253. doi: 10.1088/0268-1242/20/7/015
Hu BB, Nuss MC (1995) Imaging with terahertz waves. Optic Lett 20(16):1716-1718. doi: 10.1364/OL.20.001716
Iwaszczuk K, Heiselberg H, Jepsen PU (2010) Terahertz radar cross section measurements. Opt Express 18(25):26399-26408. doi: 10.1364/OE.18.026399
Kemp M (2011) Screening mail for powders using terahertz technology. Proc SPIE 8189:8189J. doi: 10.1117/12.898093
Kiwa T, Oka S, Kondo J, Kawayama I, Yamada H, Tonouchi M, Tsukada K (2007) A terahertz chemical microscope to visualize chemical concentrations in microfluidic chips. Jpn J Appl Phys 46(44):L1052-L1054. doi: 10.1143/JJAP.46.L1052
Klatt G, Gebs R, Janke C, Dekorsy T, Bartels A (2009) Rapid-scanning terahertz precision spectrometer with more than 6 THz spectral coverage. Opt Express 17(25):22847-22854. doi: 10.1364/OE.17.022847
Kulesa C (2011) Terahertz Spectroscopy for Astronomy: from comets to Cosmology. IEEE Trans THz Sci Technol 1(1):232-240. doi: 10.1109/TTHZ.2011.2159648
Lee YS (2009) Principles of terahertz science and technology. New York: Springer.
Li HY, Li Q, Xia ZW, Zhao YP, Chen DY, Wang Q (2013) Influence of Gaussian beam on terahertz radar cross section of a conducting sphere. J Infrared Milli Terahz Waves 34:88-96. doi: 10.1007/ s10762-012-9950-6
Li W, Yao J (2010) Microwave and terahertz generation based on photonically assisted microwave frequency twelvetupling with large
tunability. IEEE Photonics Journal 2(6):954-959. doi: 10.1109/ JPHOT.2010.2084993
Lu M, Shen J, Li N, Zhang Y, Zhang C (2006) Detection and identification of illicit drugs using terahertz imaging. J Appl Phys 100:103104. doi: 10.1063/1.2388041
McIntosh KA, Brown ER, Nichols KB, McMahon OB, DiNatale WF, Lyszczarz TM (1995) Terahertz photomixing with diode lasers in low-temperature-grown GaAs. Appl Phys Lett 64:3844-3846. doi: 10.1063/1.115292
Mineo M, Paoloni C (2010) Corrugated rectangular waveguide tunable backward wave oscillator for terahertz applications. IEEE Trans Electron Dev 57(6):1481-1484. doi: 10.1109/ TED.2010.2045678
Peiponen KE, Zeitler JA, Kuwata-Gonokami M (2013) Terahertz spectroscopy and imaging. Berlin: Springer-Verlag.
Perenzoni M, Paul DJ (2014) Physics and applications of terahertz radiation. New York: Springer.
Petkie DT, Kemp IV, Benton C, Boyer C, Owens L, Deibel JA, Stoik CD, Bohn MJ (2009) Nondestructive terahertz imaging for aerospace applications. Proc SPIE 7485:74850D. doi: 10.1117/12.830540
Phillips X (2011) Terahertz technology. Delhi: The English Press.
Quast H, Keil A, Loffler T (2010) Investigation of foam and glass fiber structures used in aerospace applications by all-electronic 3D Terahertz imaging. Proceedings of the 35th International Conference on Infrared, Millimeter, and Terahertz Waves; Rome, Italy.
Roy P, Rouzières M, Qi Z, Chubar O (2006) The AILES Infrared Beamline on the third generation Synchrotron Radiation Facility SOLEIL. Infrared Phys Tech 49:139-146. doi: 10.1016/j. infrared.2006.01.015
Shen YC, Lo T, Taday PF, Cole BE, Tribe WR, Kemp MC (2005) Detection and identification of explosives using terahertz pulsed spectroscopic imaging. Appl Phys Lett 86:241116. doi: 10.1063/1.1946192
Siegel PH (2004) Terahertz technology in Biology and Medicine. IEEE MTT-S International Microwave Symposium Digest 52(10):1575-1578. doi: 10.1109/MWSYM.2004.1338880
Siegel PH (2007) THz instruments for space. IEEE Trans Antenn Propag 55(11):2957-2965. doi: 10.1109/TAP.2007.908557
Smirnov AV, Baryshev AM, Pilipenko SV, Myshonkova NV, Bulanov VB, Arkhipov MY, Vinogradov IS, Likhachev SF, Kardashev NS (2012) Space mission Millimetron for terahertz astronomy. Proc SPIE 8442:84424C. doi: 10.1117/12.927184
Takano K, Yakiyama Y, Shibuya K, Izumi K, Miyazaki H, Jimba Y, Miyamaru F, Kitahara H, Hangyo M (2013) Fabrication and performance of TiO2-ceramic-based metamaterials for terahertz
frequency range. IEEE Trans THz Sci Technol 3(6):812-819. doi: 10.1109/TTHZ.2013.2285521
Tauk R, Teppe F, Boubanga S, Coquillat D, Knap W (2006) Plasma wave detection of terahertz radiation by silicon field effects
transistors: responsivity and noise equivalent power. Appl Phys Lett 89:253511. doi: 10.1063/1.2410215
Wilke I, Ramanathan V, LaChance J, Tamalonis A, Aldersley M, Joshi PC, Ferris J (2014) Characterization of the terahertz frequency optical constants of montmorillonite. Appl Clay Sci 87:61-65. doi: 10.1016/j.clay.2013.11.006
Williams BS (2007) Terahertz quantum-cascade lasers. Nature Photon 1(517):517-525. doi: 10.1038/nphoton.2007.166
Williams GP (2002) FAR-IR/THz radiation from the Jefferson Laboratory, energy recovered linac, free electron laser. Rev Sci Instrum 73(3):1461-1463. doi: 10.1063/1.1420758