ABSTRACT: A sample of 152 accidents and incidents involving Remotely Piloted Aircraft Systems, more commonly referred to as “drones”, have been analysed. The data was collected from a 10-year period, 2006 to 2015, conveniently sourced from a limited population owing to the scarcity of reports. Results indicate that safety occurrences involving Remotely Piloted Aircraft Systems (RPAS) have a signiicantly different distribution of contributing factors when sorted into distinct categories. This provides a thorough and up-to-date characterization of the safety deiciencies speciic to RPAS. In turn, this contributes to the development of adequate safety management systems applicable to the RPAS sector. The majority of RPAS occurrences involved system component failures which were the result of equipment problems. Therefore, airworthiness instead of pilot licensing needs to be considered irst when regulating the Remotely Piloted Aircraft System industry. “Human factors” and “loss of control in-light” were found to be the second most common “contributing factor” and “occurrence category”, respectively; Remotely Piloted Aircraft pilot licensing will help reduce the probability of these secondary occurrences. The most signiicant conclusion is that reporting systems must be implemented to address RPAS accidents and incidents speciically, such that more useful data is available, and further analysis is possible facilitating an improved understanding and greater awareness.
KEYWORDS: RPAS, UAS, UAV, Accidents and incidents, Aviation safety.
A Post-Accident Analysis of Civil
Remotely-Piloted Aircraft System
Accidents and Incidents
Graham Wild1, Kellie Gavin1, John Murray1,2, Jose Silva1, Glenn Baxter1
INTRODUCTION
here is a growing interest in aircrat that are controlled from a remote location without a pilot located in the aircrat itself. Referred to by many terms (“drones”, UAV, UAS, etc.) the International Civil Aviation Organization (ICAO 2015) has recently adopted “Remotely Piloted Aircraft System” (RPAS) to identify these aircrat. he absence of a light crew on-board the aircrat creates unique challenges in terms of the safety risks associated with the operation of RPAS. hat is, the dimensions and applicability of the well-known Sotware, Hardware, Environment, Liveware, and Liveware (SHELL) model adopted by ICAO Circular 216-AN31 (ICAO 1989) will be signiicantly diferent from those associated with the operation of conventionally-piloted aircraft. In particular, the interrelationships between the elements constituting the framework of the SHELL model will be signiicantly diferent.
hese unmanned aircrat, commonly referred to as “drones” in the defence sector, usually conjure up thoughts of Predator UCAVs iring Hellire missiles in combat operations (Callam 2015). In the civil sector, the presence of RPAS is still a relatively new phenomenon (ICAO 2011; Skrzypietz 2012). From the 1990s, civil operation of RPAS was mostly seen in the Japanese agriculture industry (MarketLine 2014; Odido and Madara 2013). he ever-evolving nature of the aviation industry has supported a vast deviation of RPAS into civilian aviation. hese areas include policing activities, wildlife and isheries protection, environmental monitoring, surveillance, as well as search and rescue (Gupta et al. 2013). he aviation industry
1.RMIT University – School of Engineering – Aerospace Engineering and Aviation – Melbourne/Victoria – Australia. 2.Edith Cowan University – School of Engineering – Aviation – Perth/Western Australia – Australia.
Author for correspondence: Graham Wild | RMIT University – School of Engineering – Aerospace Engineering and Aviation | GPO Box 2476 Melbourne, Victoria, 3001, Australia | Email: [email protected]
recognises the economic beneits of remotely piloted aircrat and acknowledges the many opportunities provided by their use in “dull, dirty, dangerous and demanding” tasks, that may otherwise impose high risk to a piloted aircrat (CASA date unknown, b). The examination of past accident and incident cases can assist in the continuous improvement of safety, such that potential hazards, unsafe acts, and latent conditions are identiied before they have disastrous efects (ICAO 2013). his vital data can lead to more informed decision-making by regulatory bodies around corrective actions moving forward and the allocation of resources (ICAO 2007). It also allows for the communication and dissemination of valuable safety information, which is key in fostering a positive safety culture in the industry (ICAO 2013). he deinition of accident and incident adopted by ICAO will be used in the context of this paper. For simplicity, throughout this paper, the term “occurrence” will be used when referring to both accident and incident events. It is hoped that this research will assist in the reduction of accidents and incidents in the civil RPAS sector by analysing past occurrences and identifying common contributing factors. To this end, a sample of 152 civil RPAS accidents and incidents was analysed. he data set spanned a 10-year period, from 2006 to 2015. he data was sourced from multiple online databases and was then classiied by type of occurrence, occurrence category, contributing factors, phase of light, and time of light. he primary research question posed in this paper is “what are the common factors in RPAS accidents and incidents in civil aviation between 2006 and 2015?”.
LITERATURE REVIEW
Accidents and incidents are an unfortunate element of all sectors of the aviation industry, with the RPAS sector being no exception (Clothier and Walker 2015; ICAO 2013). The complexity of the systems and the many external influences on them mean that aiming for zero accidents is unrealistic. A more achievable approach to safety for operators and regulators is to focus on managing the potential hazards and risks associated with their operation to a level as low as reasonably possible (Clothier and Walker 2015; Xunguo
et al. 2014). As supported by ICAO (2013) in their Safety Management Manual, it is clear that the collection of accident and incident data is a key step in the identification of potential hazards and risk areas.
he necessity of this research is exacerbated by the intense growth of the RPAS sector in recent years. Valavanis and Vachtsevanos (2015) attribute this growth to the steps taken by regulatory bodies such as the Federal Aviation Administration (FAA) and the European Commission to outline Civilian RPAS roadmaps. With the use of RPAS becoming more diverse and its development fast-tracked with lowering costs, there is a real need to remain proactive, ensuring the overwhelming beneits are not overshadowed by the potential risk to safety (AIA date unknown; Harrison 2013; Valavanis and Vachtsevanos 2015).
SAFETY TREND
With air travel commonly referred to as the safest form of travel, statistics published by Allianz (2014) show that the aviation sector’s safety level has consistently increased over the decades with accident rates in recent years at their lowest. his positive safety trend has been attributed to advancements of technology and the process of continuous improvement adopted by the industry, which includes the study of accident and incident causation (Allianz 2014).
However, Allianz (2014) also highlights the very real risk that technological advancements such as RPAS may have on this safety position, with a report undertaken by the Joint Authorities for Rule-Making on Unmanned Systems (JARUS WG-6 2014) supporting this. RPAS operations are set to increase substantially in the future and focus on operations in non-segregated airspace, a requirement for the sector’s future viability (AIA date unknown; European Commission 2014). As such, it is important that accidents and incidents involving these systems are mitigated before they eventuate — a sentiment supported by Clarke and Bennett Moses (2014).
THE IMPORTANCE OF IDENTIFYING COMMON FACTORS
here has been extensive research highlighting the potential of the emerging RPAS sector and the challenges it brings in the safety arena. he industry and regulatory bodies are working to address these many challenges (AIA date unknown). As previously discussed, the exploration of common factors in previous occurrences is a key input for helping to identify and inluence relevant regulatory decisions and processes (ICAO 2013).
Previous research undertaken within diferent aviation environments has previously been conducted and highlights the efectiveness of this reactive method. Australia’s Bureau of Air Safety Investigation (BASI 1996) completed a study into fatal accidents in the general aviation (GA) sector. Issues surrounding human factors were found to contribute to approximately 70 – 80% of accidents in this sector. A later report by Australia’s Civil Aviation Safety Authority (CASA date unknown, a) into common factors in Australian GA accidents was able to reveal information including that:
• The high number of fatal accidents in the private light category.
• Key factors in accidents of inadequate light planning and aircrat handling.
• Of the flight planning management category, 17% could be attributed to unnecessary low-level lying. he CASA’s research was undertaken with a similar view to this present study, in that it will enable further detailed analysis to take place in the future (CASA date unknown, a). In 2010, further analysis took place addressing key CASA indings of GA accidents in the private light category. Undertaken by the Australian Transport Safety Bureau (ATSB 2010), the report analysed this type of occurrence in more detail and was able to provide key safety information.
Research completed by Clothier and Walker (2015) used sample data from Tvaryanas et al. (2006). his study of military RPAS accidents and common failure categories identified common human factor elements as a cause for 60.2% of the 221 cases studied. his information allows risks to be identiied with the aim of mitigating them before they eventuate (Clothier and Walker 2015; ICAO 2007, 2013). his study was signiicant as it represented the irst post-accident analysis of a relatively large sample of RPAS accidents for the defence sector.
he relevance of post-accident, explorative research can also be witnessed in a recent report by Boyd (2015), who
investigated the “causes and risk factors for fatal accidents in non-commercial twin engine piston general aviation aircrat”. Having similar motives to the research herein, Boyd’s report highlights the valuable information that can be attained through a post-accident review, and identiied a potential deiciency in key training areas. Armed with this vital knowledge, regulatory bodies were able to make informed decisions, in Boyd’s case about the multi-engine rating training syllabus. Safety bulletins were then disseminated and light schools could review their training methods. Without post-accident analysis, vital statistics would not have been discovered, including that 70 – 80% of accidents are related to human elements (Clothier and Walker 2015), or that 53% of GA accidents during 1999 – 2000 correspond to private light (CASA date unknown, a). Hence valuable safety information and regulations may not have been created or amended.
ACCIDENT AND INCIDENT REPORTING
he rules and regulations governing aviation activities are “as fundamental and rudimentary to the aviation industry as civil order is to modern society” (Bartsch 2015). Australia became one of the irst countries to regulate the operation of RPAS in civil airspace with the introduction in 2002 of rules speciically for unmanned aerial activities, (CASA date unknown). Since then, signiicant progress has been made in the promulgation of rules for RPAS operations with the FAA in the USA putting into place policies in 2007 allowing the integration of RPAS into non-segregated airspace (FAA 2013). Work has continued to progress in Europe to assure harmonisation of regulations across the continents (European RPAS Steering Group 2013). ICAO is in the process of developing standards and recommended practices (SARPs) for RPAS operations and the RPAS Manual (RPASM) was published in 2015 to provide guidance for contracting States on RPAS integration into non-segregated airspace (Bartsch 2015).
he opposite is apparent in the military RPAS sector where data is more publically accessible (Clothier and Walker 2015), therefore, studies of military occurrences have been more prominent. Enomoto et al. (2013) identiied in their study a number of publicly available sources that contained or had the potential to capture civil RPAS occurrences, however these existed only in the US, Australia, United Kingdom, and Canada.
Voluntary reporting systems, such as the United States FAA Near Mid-Air Collision System (NMACS), exist as a means to encourage aviators to submit reports. Whilst the importance of these reporting systems are recognised, it has been suggested that not having controls or regulations for RPAS occurrence reporting facilitates the distortion of data (Goglia 2014). his then suggests that the subjectiveness of suspected RPAS occurrences can in fact degrade the ability to draw on these databases as a source of truth in implementing safety actions/ recommendations. Instead of playing a role in the output of safety recommendations and regulations as is intended with these regulatory accident and incident databases, Goglia (2014) argues that they just allow for the collection of unsubstantiated claims of a “growing problem with small drones”.
Regardless of whether the systems available are mandatory or voluntary, a key issue is the lack of consistency across ICAO member states and within the respective databases. Having appropriate regulations in place to address the type and quantity of data to be collected will no doubt assist as a irst step. he approach taken by ICAO, the International Air Transport Association (IATA), and other organisations to harmonise their safety data reporting would also help in the comparison of safety data regarding accidents and incidents in RPAS.
METHODOLOGY
DESIGNhis study followed a mixed-method approach, speciically an exploratory design, in which the first phase saw the implementation of content analysis, a qualitative method. his was utilised in order to systematically select and examine information within relevant accident and incident case studies and then to identify common trends and themes (Leedy and Ormrod 2013). he cases were selected through convenience sampling. hat is, no random sub-sampling was conducted and all of the cases found were included. Following this, the categorised data was then quantiied and analysed to uncover common causal factors to determine if any statistical signiicance
existed. hat is, the second phase (the quantitative phase) of the mixed method was a causal-comparative study.
DATA COLLECTION
he 152 cases analysed and discussed in this paper were collected from a number of publically available accident investigation databases, safety reporting systems, and through a general website search. hese included, but were not limited to: • FAA Aviation Safety Information Analysis and Sharing
System.
• NASA Aviation Safety Reporting System. • Civil Aviation Authority.
he data collected focussed speciically on RPAS accidents and incidents whilst under civil operation only, between the years 2006 to 2015.
A number of reports were found (35 in total) through the data collection stage that identiied airspace incursions or separation incidents involving RPAS. hese reports were made to accident investigation bodies by numerous sources such as commercial airline pilots and air traic controllers. Unfortunately these cases did not have conclusive evidence of RPAS involvement and the RPAS operator was not able to be identiied. For this reason they have been excluded from the scope of this study. Instead, this research has only focused on the common “occurrence categories” and “contributing factors” that lead to RPAS incidents or accidents so that the frequency and type of these occurrences may be better understood and mitigated in future.
DATA CLASSIFICATION
order to simplify the collection. he System Component Failure/ Malfunction (SCF) categories under ICAO’s standards are separated into 2 subcategories — SCF non powerplant events and SCF powerplant events. his study has simply combined the 2 and considers all SCF events together. he Occurrence Categories (OC) used in the coding were:
• System Component Failure (SCF). • Loss of Control – Inlight (LOC-I). • Navigation Error (NAV).
• Abnormal Runway Contact (ARC).
• Collision with obstacle(s) during takeof and landing (CTOL).
• Air Traic Management/Communication Navigation Survellence (ATM).
• Midair/Near Midair Collision (MAC). • Controlled Flight Into Terrain (CFIT). • Loss of Control – Ground (LOC-G). • Turbulence (TURB).
• Unknown (UNK).
he second ield identiied was the Factors Contributing to Occurrence. he Contributing Factors (CF) were coded into speciic elements in order to ensure a consistent approach. hese elements were:
• Equipment Problems (EP). • Human Factors (HF). • Organisational Issues (OI). • Environmental Issues (EI). • Unknown (UNK).
hese elements were adopted through review of other similar studies such as Pagán et al. (2006) and Boyd (2015). Additionally, research by Johnson and Holloway (2007) was drawn on to classify the high level contributing factors.
he phase of light was also an important ield identiied. he Phases of Flight (PoF) used to code the cases investigated in this study included:
• Takeof and climb out. • Cruise or en-route.
• Descent, approach, and landing. • Unknown.
It should be noted that other typical phases of light exist, which have been omitted from this study. his is justiiable as there were no RPAS occurrences in these categories.
he inal 2 ields coded were time of occurrence (ToO) and the occurrence type (OT). he ToO was coded as either night or day. he OT was coded as either an accident or an incident.
ANALYSIS
Once all 152 cases had been collated and classiied, common trends were identiied and frequencies of occurrences were noted (Leedy and Ormrod 2013). he irst stage of this was to visually inspect data in charts to assist in the uncovering of signiicant information such as the primary CF and OC as well as the frequency of these cases. In order to determine statistical signiicance of this categorical data, Pearson’s χ2 test of independence was performed (Berman and Wang 2011). he test was employed when comparing data such as OC by type of occurrence and importantly when looking at the signiicance of OCs and contributing factors under diferent conditions such as PoF and ToO conditions (Boyd 2015; Pagán et al. 2006).
he quantitative data analysis involved Pearson’s χ2 tests for independence. he statistical hypotheses are given as:
where: subscripts i and j represent the 2 ields being compared (in this paper these are 2 of OC, CF, PoF, ToO, or OT); p is in reference to the proportions of the n-th category (there are 4 for OC, 4 for CF, 3 for PoF, 2 for ToO, and 2 for OT). H0 is the null hypothesis and can therefore be expressed as: “the proportions of ield i cases are equal for the proportions for ield j cases”. HA is the alternative hypothesis, and, in contrast to this, “the proportions are not equal”. he χ2 is given by Berman and Wang (2011):
H
A:
p
i,n≠
p
j,n (1)(2)
H
0:
p
i,n=
p
j,nwhere: there are n classiications for ield i, and m classiications for ield j.
he number of degrees of freedom, df, is given as (n – 1) (m – 1) for each test. he critical value was then determined from the degrees of freedom using the χ2 table, with a 95% conidence level. Finally, if χ2 was less than the critical value H0 was accepted, otherwise, H0 was rejected.
RESULTS
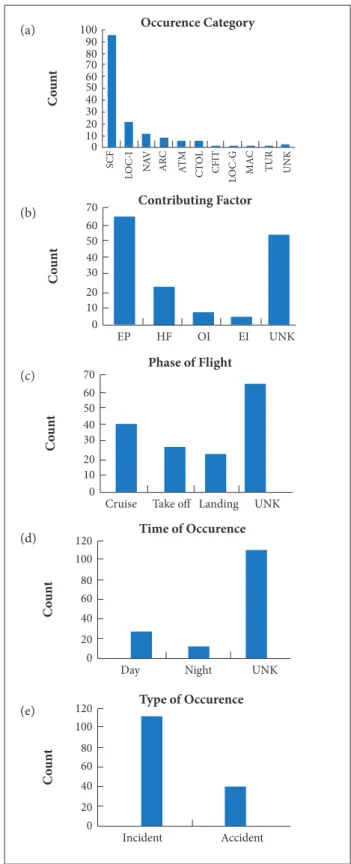
CLASSIFICATIONSin Fig. 1a. Across the cases, the most common OCs were found to be SCFs at 63% and LOC-I at 14%.
Figure 1b shows the breakdown of cases coded by the CF. EPs have the highest percentage, at 41%, while HFs are the second most common at 15%. hese numbers, however, are skewed by the large number of UNK events (35%). Hence, if these are excluded there are 64% EPs, and 23% HFs.
he breakdown of cases coded by PoF is shown in Fig. 1c. Once again a relatively large number of reported cases did not include information about which PoF the occurrence happened. Excluding these UNK cases it is noted that 45% of cases occurred in cruise, 30% of cases occurred at takeof, and 25% of cases occurred during landing.
Figure 1d shows the breakdown of cases coded by ToO. Note the majority of case reports did not indicate the time when the occurrence happened. he percentage of cases that occurred during the day was 70% while the percentage of cases that occurred at night was 30%, excluding the UNK cases.
Finally, the OT was quantified. As every occurrence could be classified as either an incident or an accident there were no UNK cases. The breakdown is shown in Fig. 1e. The incidents account for 74% of all cases while accidents account for 26%.
COMPARISON
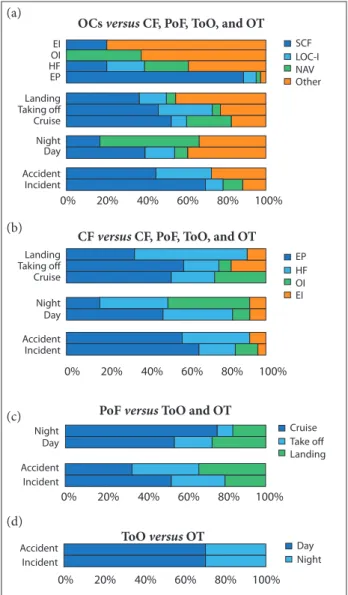
Following the initial quantiication of the coded data, the various ields were compared and contrasted in terms of their percentage distribution. Figure 2a shows the OCs percentage proportions for each of the other ields. Figure 1a shows that a large number of categories contain a relatively small number of cases; as such, these categories were grouped into an “other” category. his would not inluence the nature of the proportional distribution. Visually the proportions for the OCs appear to be diferent for every ield. Of note is that the majority of EPs correspond to SCFs. Next, the OIs are split between NAV and “other”. Finally, for EIs there are a large number of “other” cases which includes environmental related occurrences such as TURB, WILD etc. For PoF relative to OT shows a large number of “other” for landing, which includes ARC, CTOL, etc. For ToO, there is a large number of NAV cases at night. For the OT, the inference is that a larger proportion of incidents involve SCFs, and a larger proportion of accidents involve NAV.
Next the CF was compared and contrasted to the remaining ields. For PoF, it can be seen in Fig. 2b that HFs are more
common for landing, while EPs are more common for takeof, and cruise cases show the most OIs, with no EIs.
Figure 1. Pareto plot showing number of cases (2006-2015).
Type of Occurence
C ou nt Accident Incident 0 20 40 60 80 100 120
Time of Occurence
C
ou
nt
Day Night UNK
0 20 40 60 80 100 120
Phase of Flight
C
ou
nt
Cruise Take off Landing UNK
0 10 20 30 40 50 60 70 Contributing Factor C ou nt
EP HF OI EI UNK
0 10 20 30 40 50 60 70 Occurence Category C ou nt SCF L O C-I N AV A RC AT M C T OL CFIT L O
C-G MAC TUR UNK
EI OI HF EP
Landing Taking off Cruise
Night Day
Accident Incident
Night Day
Night Day Accident Incident
Accident Incident
0% 20%
SCF LOC-I NAV Other
40%
OCs versus CF, PoF, ToO, and OT
CF versus CF, PoF, ToO, and OT
PoF versus ToO and OT
ToO versus OT
60% 80% 100%
0% 20% 40% 60% 80% 100%
0% 20% 40% 60% 80% 100%
0% 20% 40% 60% 80% 100%
EP HF OI EI
Cruise Take off Landing
Day Night Accident
Incident Landing Taking off Cruise
Figure 2. Percentage breakdown of cases, across the 10-year period (2006 – 2015). Note: UNK cases have been excluded.
ANALYSIS
To conirm the visual comparison from Fig. 2a to Fig. 2d,
the Pearson χ2 test for independence between each of the ields
was undertaken. In total, there are 10 ways the 5 ields can be
paired. hese are all summarised in Table 1, in the top 2 rows.
he table also shows the corresponding χ2 test statistics, the degrees of freedom, the critical value, the p-value (the probability for the given test statistic with the stated degrees of freedom), and the conclusion. OCs and CF are discussed in detail below. At this point it is noted that the proportions of PoF between ToO is not statistically signiicant (χ2 = 1.59, a = 0.05, df = 2). hat is, PoF cases are not more or less likely to occur because of the ToO. In fact, it may have been plausible to hypothesise that night operations would result in more occurrences during takeof and landing, which is not supported by the indings. Similarly, the proportions for PoF between OT is not statistically signiicant (χ2 = 4.44, a = 0.05, df = 2). hat is, PoF does not result in a greater or lesser proportion of accidents relative to incidents. here does appear to be a larger proportion of accidents during takeof and landing, but the limited sample size means this conclusion is not statistically signiicant. Finally, of ToO and OT showed no statistical signiicance (χ2 = 0.00, a = 0.05, df = 1), as highlighted in the “Comparison” section.
Occurrence Category
A statistical signiicance was found between the OCs and the CFs (χ2 = 75.7, a = 0.05, df = 9), that is, at the 95% conidence level the null hypothesis is rejected and it is concluded that there is a diference in the distribution between CFs for diferent OCs. More directly, it is fair to state that CFs influence specific OCs in diferent ways. It can then be concluded that:
• EPs contribute the most to SCF.
• HFs are more signiicant for LOC-I cases. • OIs are associated with “other” and NAV cases. • EIs are more common for “other” (TURB and WILD
etc.) cases.
A statistical signiicance was also found between the OC and PoF (χ2 = 15.1, a = 0.05, df = 6). So, at the 95% conidence level, the null hypothesis is rejected and it is concluded that there is a diference in the distribution between PoF for diferent OCs. hat is, OC occur at diferent rates in the diferent PoF. Based on the proportions it can be concluded that:
• Cruise has a larger proportion of SCF. • Takeof has the largest portion of LOC-I cases. • Landing has the most “other” (ARC, CTOL etc.) cases. (a)
(b)
(c)
(d)
Figure 2c compares and contrasts PoF to ToO and OT. These show relatively similar proportions. This is important to consider as the data suggests that night time occurrences happen in cruise and not during takeoff or landing as one may hypothesise. When looking at the OT cases that are accidents they occur more frequently during takeoff and landing.
A statistical significance was also found between the
OCs and ToO (χ2 = 10.8, a = 0.05, df = 3). So, at the 95%
confidence level, the null hypothesis is rejected and it is concluded that there is a difference in the distribution of the ToO between the types of OC. That is, OCs have different rates during the day and night. Based on the proportions it can be concluded that:
• Day-time cases have a larger proportion of SCF.
• Night-time cases have a signiicantly larger proportion
of NAV cases.
A statistical signiicance was also found between the OC and
OT (χ2 = 18.8, a = 0.05, df = 3). So, at the 95% conidence level,
the null hypothesis is rejected and it is concluded that there is a diference in the distribution between OT for the diferent OCs. hat is, the end result (an incident or an accident) varies based on the OCs. It can then be concluded that:
• A larger proportion of incidents are associated with SCFs.
• A relatively larger proportion of accidents result from LOC-I.
Contributing Factor
A statistical signiicance was found between the CF and PoF (χ2 = 19.0, a = 0.05, df = 6). So, at the 95% conidence level, the null hypothesis is rejected and it is concluded that there is a diference in the distribution between PoF across the CFs. hat is, CFs are involved at diferent rates in the diferent PoF. Based on the proportions it can be concluded that:
• Cruise has the largest proportion of OIs and no recorded EIs.
• Takeoff has the largest proportion of EPs and the smallest portion HFs.
• Landing has the largest proportion of HFs contributions and no OIs.
A breakdown of CFs across OT showed no statistical significance (χ2 = 5.50, a = 0.05, df = 3). Hence, it can be assumed that the CFs are similar for cases if they are coded as accidents or incidents. Similarly the division of CFs by ToO showed no statistical significance (χ2 = 6.98, a = 0.05, df = 3). However, this results in a p-value of 0.07, which is more than 90% significant. The most likely type of error associated with a χ2 test is a Type II Error (accepting H
0 when it should be rejected). As such, the division of CFs by ToO should be considered borderline. Therefore it is worth noting the potential that OIs contribute to the majority of night-time cases.
DISCUSSION
FINDINGShe data collected revealed that 61% of all occurrences were attributed to SCFs, with a signiicant gap between the next closest OC factor, LOC-I. A report by the ATSB on the accidents and incidents in an Australian aviation context over the period 2003 to 2012 showed markedly diferent results than those found in the civil RPAS sector. he ATSB report revealed that for the Australian GA and Air Transport sectors, NAV and wildlife (WILD) occurrences dominated (ATSB 2013). Seemingly the RPAS sector most resembles that of the Recreational Aviation (RA) sector in terms of occurrence categories. One reason behind this similarity could be the less restrictive certiication standards required in these 2 sectors in terms of airworthiness and design (Brandon 2014; Johnson 2010).
Whilst it is recognised that a zero occurrence rate is not realistic and that there are no preferable OCs, the high frequency of SCF occurrences certainly highlights an area that deserves further detailed research. It is disconcerting to find that
Field 1 Category Factor PoF Time
Field 2 Factor PoF Time Type PoF Time Type Time Type Type
c2 75.7 15.1 10.8 18.8 19.02 6.98 5.5 1.59 4.44 0
α 0.05 0.05 0.05 0.05 0.05 0.05 0.05 0.05 0.05 0.05
df 9 6 3 3 6 3 3 2 2 1
Critical 16.92 12.59 7.81 7.81 12.59 7.81 7.81 5.99 5.99 3.84
p-value 1E-12 0.020 0.013 0.0003 0.004 0.07 0.139 0.45 0.11 1
when disregarding the UNK category, 93% of SCF cases were
contributed to by EPs. hese included loss of data link, sotware
malfunctions and light control issues to name a few. Examples of these issues identiied in cases collected include:
• Case Reference No 34a “Engine mount failure resulting in propeller damage on landing”.
• Case Reference No 34g “Iridium C2 modem failure. (One of 4 modems)”.
• Case Reference No 34u “Anomalous Embedded GPS/ Inertial Navigation System (EGI) GPS degradation”. he types of accidents and incidents that occur in RPAS operations have been inluenced by the greater reliance on and complexity of (Gupta et al. 2013; Hobbs and Herwitz 2006):
• Communication links. • Navigation hardware. • Sotware.
he same can also be said for the CFs identiied in these accidents and incidents. his study has revealed that although HFs have been widely attributed to over 2/3 of aviation accidents and incidents (BASI 1996; Clothier and Walker 2015; Skrzypietz 2012), the same cannot be said regarding the civil RPAS sector. Instead, equipment failures (41%) have appeared to be more of a primary instigator in occurrences. This is clearly in contrast to other sectors. Interestingly, despite clear diferences between the civil and military RPAS sectors, failure of aircrat components (66%) also had more of a signiicance over that of human error (34%) within the military as well (Williams 2004).
It appears suggestions by the AIA (date unknown) and also Skrzypietz (2012), that the removal of the on-board pilot in these systems should result in a reduced risk, maybe supported by the results in this study. It is unknown whether EPs based SCFs and LOC-I occurrences are due to design laws or if system maintenance is to blame, which could be HF and OI induced. Hobbs and Herwitz (2006) suggest that the level of knowledge and experience of RPAS maintenance personnel may not be at the level required due to the complexity and diversity of the systems and the infancy of the sector, potentially contributing to the problem.
Reviewing cases in more detail revealed a statistical signiicance between the PoF and CFs, with EPs more prevalent in cruise whilst the landing phase saw HFs dominate. Further research needs to be undertaken in order to determine the main types of EPs experienced in these cases; however, initial review indicates that just under a third involved “lost link” issues. he
prevalence of these types of failures may be rationalised by types of communication links utilised in diferent phases (Kaliardos and Lyall 2015). During critical phases such as takeof and landing, line of sight links resulting in less latency and reduced impact of degradation are used; whereas phases such as cruise that require less manoeuvrability oten rely on satellite based control links which are more susceptible to degradation given the increased latency (Kaliardos and Lyall 2015).
It was not surprising to discover that HFs played the primary role in cases during the landing phase. Cited as one of the most critical flight phases, both unmanned and manned aircraft share this unfortunate quality (Huh and Shim 2010). Evidence of this is can be seen in the military RPAS sector with Williams (2004) reporting pilot landing errors as the clear leader in HF issues. Similar findings are also apparent in the air transport sector, with Boeing (2013) reporting that 47% of fatal accidents occur in the final approach and landing phases. A report by Huh and Shim (2010) attributes HF occurrences in RPAS operations to the complexities in situational awareness brought about by the remoteness of the pilot. Without data on the pilot in commands flight experience and time on type, it is hard to determine whether workload or insufficient training contributed to these events.
LIMITATIONS
here are 2 limitations of the results presented, the number of cases, and the limited information about the cases. The number of cases, spread over a 10-year period, prohibits an analysis based on changes over time for diferent classiications. hat is, if we consider PoF (3 groups) and year of occurrence (10 groups), breaking the data down into both (30 groups) will result in some groups having “0” entries, which precludes the ability to conduct a χ2 test. With a larger sample size, such that no group had “0”, statistical analysis could be undertaken. he same is true if we consider any combination of classiications (PoF, ToF, OT, and OC).
RECOMMENDATIONS
Based on the aforementioned limitations, the first recommendation to be made is that reporting of occurrences, particularly those concerning accidents and serious incidents, should be enforced by legislation applicable to the RPAS sector. Even though most civil aviation authorities have been revising their regulatory framework to incorporate this need, there is still a legislative gap to be addressed which precludes the effective reporting of all categories of RPAS, particularly small UAVs which regardless of their limited dimensions might still pose a serious risk to the operation of other aircraft and people on the ground. Concurrently, regulators should also invest in safety promotion actions tailored to the RPAS sector as a mean to foster operators to pro-actively report safety occurrences involving unmanned aircraft via the existing voluntary reporting systems irrespective of their perceived severity.
As the current study was based on data sourced from publicly available databases fed by voluntary reporting systems, some of the data used herein was lacking details on the aircrat size and maximum takeof weight, which prevented analysing the results taking into consideration the operation categories typically used in similar studies for manned aircrat, such as (Evans 2015). As such, if governments and the RPAS sector implement and adopt reporting systems for accidents and incidents, a more in depth analysis of the RPAS sector will be
possible. his will help to improve safety in the RPAS industry,
by developing a greater understanding and awareness of the speciic nature of accidents and incidents in diferent RPAS operation categories, which is currently beyond the scope of available data.
CONCLUSION
With a growth of RPAS operation forecast, and the alleged incident involving a “drone” and a British Airways A320 at Heathrow Airport (Stevenson 2016), it is imperative to explore RPAS accidents and incidents. Furthermore, common factors were identified and studies such as this need to be continually undertaken in order to ensure the ongoing safety of the community and the sustainability of this thriving sector. Globally, there has been a great deal
of resources allocated by regulatory bodies to manage the exponential growth of the civil RPAS sector. However, in the area of accident and incident investigation and regulations in particular, it is possible to suggest that greater focus on data collection in the early stages of growth would have assisted greatly in developing a more targeted approach. Numerous studies have also been completed independently, identifying potential hazards and risks of these systems. In order to complement these proactive studies it is important that the reviews of past accidents and incidents are not forgotten as a vital source of data as they can provide an abundance of information used to validate these studies and identify lessons to be learnt.
This study aimed to identify common factors in RPAS accidents and incidents in civil aviation in order to assist in the process of mitigating these occurrences. his was done through posing the primary question “what are the common factors in RPAS accidents and incidents in civil aviation between 2006 and 2015?”.
The analysis uncovered that the majority of occurrences were found to have involved SCFs with EPs dominating as primary CF. This led to the recognition that civil operated RPAS have distinct differences between other sectors of the industry such as GA and air transport. The result of this is that lessons learnt through post-accident and incident analysis in other sectors are less able to be transferred to the RPAS sector. Instead it was found that similarities were seen between the military and civil RPAS sectors, and hence RPAS is unique in the aviation industry. Currently, the industry trend to license RPAS operators will, in effect, focus on HFs issues. Specifically, the recommendation from this research is that regulators need to focus primarily on airworthiness requirements, which are still yet to be formalised for civil RPAS (Clothier et al. 2015).
AUTHOR’S CONTRIBUTION
REFERENCES
AIA (date unknown) Unmanned aircraft systems: perceptions & potential. Aerospace Industries Association; [accessed 2015 Mar 22]. http://www.aia-aerospace.org/assets/AIA_UAS_Report_small.pdf
Allianz (2014) Global Aviation Safety Study; [accessed 2015 Mar 20]. http://www.allianz.com.au/aalaus/aalaus.nsf/docs/ F5E0B53FEC5B210DCA257CA10012C7EB/$FILE/Allianz%20 Global%20Corporate%20&%20Specialty%20Global%20Aviation%20 Safety%20Study.pdf
ATSB (2010) Improving the odds: trends in fatal and non-fatal accidents in private lying operations. Canberra: Australian Transport Safety Bureau, ACT.
ATBS (2013) Aviation occurence statistics: 2003 to 2012. Australian Transport Safety Bureau; [accessed 2015 Apr 12]. https://www. atsb.gov.au/media/4355945/ar-2013-067_inal.pdf
Bartsch (2015) Unmanned and uncontrolled: the commingling theory and the legality of unmanned aircraft system operations. J Aeronaut Aerospace Eng 4(1):1-27. doi: 10.4172/2168-9792.1000140
Berman E, Wang X (2011) Essential statistics for public managers and policy analysts. New York: SAGE Publications.
Boeing (2013) Statistical summary of commercial jet airplane accidents: worldwide operations — 1959 – 2013; [accessed 2015 Apr 16]. http://www.boeing.com/news/techissues/pdf/statsum.pdf
Boyd DD (2015) Causes and risk factors for fatal accidents in non-commercial twin engine piston general aviation aircraft. Accid Anal Prev 77:113-119. doi: 10.1016/j.aap.2015.01.021
Brandon J (2014) Overview of the legislative framework enabling sport and recreational aviation; [accessed 2015 Jun 13]. http://www. recreationallying.com/tutorials/regulations/regulations.html#certs
BASI (1996) Human factors in fatal aircraft accidents. Department of Transport and Regional Development [accessed 2015 Apr 12]. https://www.atsb.gov.au/media/28363/sir199604_001.pdf
Callam A (2015) Drone Wars: armed unmanned aerial vehicles; [accessed 2016 Sept 16]. http://www.iar-gwu.org/node/144
CASA (date unknown, a) A Preliminary analysis of fatal general aviation accidents in Australia: 1991 to 2000; [accessed 2015 Apr 16]. http://casa.gov.au/wcmswr/_assets/main/media/download/ accidentreport.pdf
CASA (date unknown, b) RPA background; [accessed 2015 Mar 20]. http:// www.casa.gov.au/scripts/nc.dll?WCMS:STANDARD::pc=PC_101984
Clarke R, Bennett Moses L (2014) The regulation of civilian drones’ impacts on public safety. Computer Law & Security Review 30(3):263-285. doi: 10.1016/j.clsr.2014.03.007
Clothier RA, Walker RA (2015) Safety risk management of unmanned aircraft systems. In: Valavanis KP, Vachtsevanos GJ, editors. Handbook of Unmanned Aerial Vehicles. Dordrecht: Springer Netherlands. p. 2229-2275.
Clothier RA, Williams BP, Coyne J, Wade M, Washington A (2015) Challenges to the development of an airworthiness regulatory framework for unmanned aircraft systems. Proceedings of the 16th Australian International Aerospace Congress; Melbourne, Australia.
Enomoto F, Bushnell D, Denney E, Pai G, Schumann J (2013)
Preliminary recommendations for the collection, storage, and analysis of UAS safety data; [accessed 2015 Mar 9]. http://ntrs.nasa.gov/ archive/nasa/casi.ntrs.nasa.gov/20140011531.pdf
European Commission (2014) Communication from the Commission to the European Parliament and the Council; [accessed 2015 Mar 20]. http://eur-lex.europa.eu/legal-content/EN/TXT/ PDF/?uri=CELEX:52014DC0207&from=EN
ERPASG (2013) Roadmap for the integration of civil Remotely-Piloted Aircraft Systems into the European Aviation System: Annex 1. European Commission; [accessed 2015 Mar 19]. http://ec.europa.eu/ enterprise/sectors/aerospace/iles/rpas-roadmap-annex-1_en.pdf
Evans JK (2015) Differences in characteristics of aviation accidents during 1993-2012 based on aircraft type. NASA/CR 2015-218999. Hampton: NASA Langley Research Center.
FAA (2013) Integration of Civil Unmanned Aircraft Systems (UAS) in the National Airspace System (NAS) Roadmap; [accessed 2015 May 30]. https://www.faa.gov/uas/media/UAS_Roadmap_2013.pdf
Goglia J (2014) FAA list of reported drone incidents indicates a problem. But it’s not what you think. Forbes; [accessed 2015 May 13]. http:// www.forbes.com/sites/johngoglia/2014/11/27/faa-list-of-reported-drone-incidents-indicates-a-problem-but-its-not-what-you-think/
Gupta SG, Ghonge MM, Jawandhiya PM (2013) Review of Unmanned Aircraft System (UAS). International Journal of Advanced Research in Computer Engineering & Technology 2(4):1646–1658; [accessed 2015 Mar 29]. http://www.uxvuniversity.com/wp-content/ uploads/2014/04/Review-of-Unmanned-Aircraft-System-UAS.pdf
Harrison GJ (2013) Unmanned Aircraft Systems (UAS): manufacturing trends. Congressional Research Service, Library of Congress; [accessed 2015 Mar 22]. http://www.fas.org/sgp/crs/natsec/ R42938.pdf
Hobbs A, Herwitz SR (2006) Human challenges in the maintenance of Unmanned Aircraft Systems. FAA and NASA Report; [accessed 2015 Jun 13]. http://human-factors.arc.nasa.gov/publications/ UAV_interimreport_Hobbs_Herwitz.pdf
Huh S, Shim D (2010) A vision-based automatic landing method for ixed-wing UAVs. J Intell Robotic Syst 57(1-4):217-231. doi: 10.1007/s10846-009-9382-2
ICAO (1989) ICAO Cir 216 — Human Factors Concepts; [accessed 2015 Mar 27]. http://www.icao.int/Meetings/UAS/Documents/ Circular%20328_en.pdf
ICAO (2007) Addressing Unmanned Aircraft System (UAS) accident investigation and prevention by ICAO Member States; [accessed 2015 Mar 9]. http://www.icao.int/Meetings/AMC/MA/Assembly%20 36th%20Session/wp217_en.pdf
ICAO (2011) ICAO Cir 328 — Unmanned Aircraft Systems (UAS); [accessed 2015 Mar 27]. http://www.icao.int/Meetings/UAS/ Documents/Circular%20328_en.pdf
ICAO (2013) Safety Management Manual (Doc 9859); [accessed 2015 Mar 19]. http://www.icao.int/safety/SafetyManagement/ Documents/Doc.9859.3rd%20Edition.alltext.en.pdf
JARUS WG-6 (2014) Working Group 6: UAS Systems Safety Analysis (1309). European Aviation Safety Agency; [2015 Mar 22]. https:// www.eurocockpit.be/sites/default/iles/amc-rpas_1309_scoping-paper_issue-1.pdf
Johnson C (2010) Computational concerns in the integration of unmanned airborne systems into controlled airspace. Computer Safety, Reliability, and Security 6351:142-154. doi: 10.1007/978-3-642-15651-9_11
Johnson C, Holloway C (2007) A longitudinal analysis of the causal factors in major aviation accidents in the USA from 1976 to 2006; [accessed 2015 May 20]. http://www.dcs.gla.ac.uk/~johnson/ papers/Johnson_Holloway_Longitudinal_Study.pdf
Kaliardos B, Lyall B (2015) Human factors of Unmanned Aircraft System Integration in the National Airspace System. In: Valavanis KP, Vachtsevanos GJ, editors. Handbook of Unmanned Aerial Vehicles. Dordrecht: Springer Netherlands. p. 2135-2158.
Leedy P, Ormrod JE (2013) Practical research: planning and design. 10th edition. Boston: Pearson Education.
MarketLine (2014) Unmanned Aerial Vehicles — the economic case for drones; [accessed 2015 Mar 26]. http://search.ebscohost. com/login.aspx?direct=true&db=bth&AN=97187491&site=ehost-live&scope=site
Odido D, Madara D (2013) Emerging technologies: use of Unmanned Aerial Systems in the realisation of Vision 2030 Goals in the Counties. Int J Appl Sci Tech 3(8):107-127.
Pagán BJ, de Voogt AJ, van Doorn RR (2006) Ultralight aviation accident factors and latent failures: a 66-case study. Aviation, Space, and Environmental Medicine 77(9):950-952.
Skrzypietz T (2012) Unmanned Aircraft Systems for Civilian Missions Brandenburg Institute for Society and Security; [accessed 2015 Jun 4]. http://www.bigs-potsdam.org/images/Policy%20Paper/ PolicyPaper-No.1_Civil-Use-of-UAS_Bildschirmversion%20interaktiv.pdf
Stevenson B (2016) A320 collision heightens UAV safety concerns. Flight Global; [accessed 2016 Apr 21]. https://www. lightglobal.com/news/articles/a320-collision-heightens-uav-safety-concerns-424419/
Tvaryanas AP, Thompson WT, Constable SH (2006) Human factors in remotely piloted aircraft operations: HFACS analysis of 221 mishaps over 10 years. Aviation, Space, and Environmental Medicine 77(7):724-732.
Valavanis KP, Vachtsevanos GJ, editors (2015) Handbook of Unmanned Aerial Vehicles. Dordrecht: Springer Netherlands; Chapter 6, Military and Civilian Unmanned Aircraft. p. 93-103.
Williams K (2004) A summary of Unmanned Aircraft accident/ incident data: human factors implications. DOT/FAA/AM-04/24. Washington: Federal Aviation Administration.