137 REM, Int. Eng. J., Ouro Preto, 70(2), 137-147, apr. jun. | 2017 Fábio Masini Rodrigues
Mestrando
Universidade Estadual de Campinas – UNICAMP Departamento de Engenharia Civil
Campinas - São Paulo – Brasil [email protected]
Armando Lopes Moreno Júnior
Professor
Universidade Estadual de Campinas – UNICAMP Departamento de Engenharia Civil
Campinas - São Paulo – Brasil [email protected]
Temperature field
of concrete-filled steel
tubular columns in fire
Abstract
The composite structures formed by the association of steel proiles with concrete have shown to be an advantageous alternative, improving the behavior of the steel structures concerning their load capacity, stiffness, and durability, under ire condi-tions. The concrete-illed tubular columns have become an attractive alternative for the civil construction area, offering constructive and esthetic advantages. The Euro-code 4 (EN 1994-1-2, 2002) and ABNT NBR 14323:2013 show simple methods for the design of the composite columns under ire situations. Nevertheless, these pres-ent limitations in their application. In addition, regarding the determination of the temperature ield in the cross section, the Eurocode 4 (EN 1994-1-2, 2002) describes a speciic procedure for columns with section proile covered with concrete, but it is neglectful about concrete-illed tubular columns. The goal of this paper is to present a simpliied procedure to determine the temperature registered in concrete-illed steel columns and apply the procedure to columns with square section tubes. The tempera-ture distribution was determined by simulations using the computer package ABAQUS (Dessault Systemes Simulia Corp. 2013). After the studies, it has been considered that the procedure described in this paper is an effective alternative for the determination of the ield’s temperature and for the application of the design of the concrete-illed columns under ire conditions.
Keywords: composite column, ire, temperature.
http://dx.doi.org/10.1590/0370-44672015700172
Civil Engineering
Engenharia Civil
1. Introduction
The composite columns formed by steel tubes illed with concrete have shown to be an attractive alternative, for both esthetics and execution. Regarding its structural behavior, the tube with concrete provides an increasing resistance and stiffness to the structural element, minimizing the problems of instability, durability and ire resistance.
The buildings are vulnerable to the occurrence of a firestorm and, under the action of ire, the structural elements have their physical and me-chanical properties changed with pos-sible loss of load capacity and rigidity, which can lead to collapse, risking the physical integrity of the users.
The national normative codes, for the specific case of designing composite steel and concrete columns under ire conditions, describe tabular and simplified analytical methods that mention, briely, advanced
meth-ods. Setting the temperature ield in structural elements is critical for the design under a fire condition, and regarding composite columns with steel tubes illed with concrete, there are no practical procedures, neither in the national normative codes nor in the Eurocode.
Lie (1994) developed an analyti-cal procedure to determine the tem-perature ield in composite columns with circular section steel tubes illed with concrete. Lie and Irwin (1995) extended this procedure for composite columns with rectangular steel tube illed with concrete, however, such procedures have proved dificult for practical application.
Capilla (2012) researched the slender columns’ resistance with cir-cular and elliptical section steel illed with concrete under the action of ire, through numerical simulations, and described a simpliied procedure
proposed by Leskela (2009), to set equivalent temperatures in concrete and steel in those columns.
The process described in Capilla deines equivalent temperatures for the concrete core, the steel tube and the rebars, so that, the cross-section has the same resistance compared to the resistance obtained by the temperature ield deined by advanced methods. Therefore, in this paper, considering the lack of practical procedures to set temperature ields in composite columns with steel tubes, we carried out an analysis of the procedure de-scribed in Capilla (2012), applying it to columns with square section steel tubes, filled with concrete and in ire situations.
138
List of the symbol
Ac : cross-sectional area of the concrete core
Ac,θ, i: cross-section area of the layer "i" of the concrete core Ec : elasticity modulus of concrete at the room temperature Ec,θ: elasticity modulus of concrete at the temperature θ
Ea : elasticity modulus of the structural steel at the room temperature Ea,θ: elasticity modulus of the structural steel at the temperature θ
Es: elasticity modulus of reinforcing steel at the room temperature Es,θ: elasticity modulus of reinforcing steel at the temperature θ Ec,sec : secant modulus of elasticity of concrete
Ec,sec, θ, i : secant modulus of elasticity of concrete at the temperature θ,
applied to the "i" layer
(EI)fi,c : flexural stiffness of concrete in the fire situation
fc : compressive strength of concrete
fc,θ: compressive strength of concrete at temperature θ
fc,θ, i: compressive strength of concrete at temperature θ, applied to the "i" layer
fya : yield strength of structural steel
fya,θ: yield strength of structural steel at temperature θ fys : yield strength of reinforcing steel
fys,θ : yield strength of reinforcing steel at temperature θ Ic : second moment of area of the concrete
Ic,θ,i : second moment of area of the concrete at temperature θ, applied to the "i" layer
kc,θ: reduction factor of the resistance of concrete at temperature θ
kc,θ,i : reduction factor of the concrete strength at temperature θ, applied to the "i" layer
kEc,θ, i : reduction factor of the modulus of elasticity of concrete at temperature θ, applied to the "i" layer
Nfi, Rd : plastic resistance in axial compression of the concrete core in fire situation
εcu : corresponding deformation of the concrete to the peak stress
εcu,θ : corresponding deformation of the concrete to the peak stress at tempera-ture θ
εcu,θ,i : corresponding deformation of the concrete to the peak stress at temperature
θ, applied to the "i" layer
θc,eq,num : equivalent temperature determined for the concrete from numeri-cal models
θa,eq,num : equivalent temperature determined for the steel tube from numerical models
2. Material and method
2.1 Equivalent temperature
To obtain the ield temperature in composite columns with square sections, numerical simulations about heat transfer were carried out for analyses by using the models from the computer package ABAQUS (Dessault Systemes Simulia Corp. 2013).
Regarding the properties of the
con-crete and steel under ire conditions, those indicated in EN 1994-1-2 (Eurocode 4) were considered, and when it came to conductance, the equation of the upper limit for the concrete was considered.
To set an equivalent temperature for the concrete core, the core was di-vided into layers, and the area of each
layer "i" was identiied by Ac,θ,i. This area is associated with a temperature θi,
where θi is the temperature presented in
each layer in the numerical models, tak-ing the given points from the vertex θi,a,
whose values at some points are higher than the points indicated from the edge
θi,b, as shown in Figure 1.
Figure 1
indication of temperature
monitoring points in the cross section.
Nevertheless the moment of inertia of each layer "i" is identiied by Ic,θi and the equivalent temperature is determined con-sidering the plastic strength and the one
direction lexural rigidity of the section. Considering the equation of the plastic resistance in axial compression of the concrete core under ire conditions,
Equation (1) was deined by the equiva-lent coeficient for reduction of section resistance:
Where the coeficient kc,θ(θc,eq1) was
deined by considering the subdivision of the concrete core in "n" layers with
their respective average temperatures. From this coeficient, we can deter-mine the equivalent temperature by
interpolating the values shown in Table 1.
139 REM, Int. Eng. J., Ouro Preto, 70(2), 137-147, apr. jun. | 2017
The Table 1 shows values of the strength reduction coeficient, Kc,θ, Ka,θ,
Ks,θ and the reduction factors of the longitudinal modulus of elasticity, KEc,θ,
KEa,θ, KEs,θ, with respect to the concrete, steel tube and reinforcing bars, all
fac-tors related with the temperature. All the coeficients shown in Table 1 were taken from Eurocode 4, except the KEc,θ, that was calculated consider-ing: KEc,θ= Kc,θ .εcu/εcu,θ, where εcu is the
speciic deformation in room
tempera-ture, corresponding to 20 ºC and εcu,θ,
is the speciic deformation at a given temperature, both listed in Eurocode 4 and corresponding to the compressive resistance of the concrete, as shown in Figure 2.
Figure 2 (a) ultimate specific deformation of the concrete in a temperature function; (b) stress-strain function of concrete at high temperatures.
θc ( oC) K
c,θ = fc,θ / fc KEc,θ = Ec,θ/Ec Ka,θ= fya,θ / fya KEa,θ = Ea,θ/Ea Ks,θ = fys,θ / fys KEs,θ = Es,θ/Es
20 1.00 1.000 1.000 1.000 1.000 1.000
100 1.00 0.625 1.000 1.000 1.000 1.000
200 0.95 0.432 1.000 0.900 1.000 0.870
300 0.85 0.304 1.000 0.800 1.000 0.720
400 0.75 0.188 1.000 0.700 0.940 0.560
500 0.60 0.100 0.780 0.600 0.670 0.400
600 0.45 0.045 0.470 0.310 0.400 0.240
700 0.30 0.030 0.230 0.130 0.120 0.080
800 0.15 0.015 0.110 0.090 0.110 0.060
900 0.08 0.008 0.060 0.0675 0.080 0.050
1000 0.04 0.004 0.040 0.0450 0.050 0.030
1100 0.01 0.001 0.020 0.0225 0.030 0.020
1200 0.00 0.000 0.000 0.000 0.000 0.000
Table 1 Reduction factors for the concrete with volumetrical normal mass and rolled steel and drawn steel.
The equivalent ratio of reduced cross section rigidity can be determined as follows:
(2)
The coeficient kEc,θ (θc,eq2) is deter- mined considering the "n" layers with their respective average temperatures.
140
From this coeficient, the equivalent temperature can be determined by interpolating the values shown in Table 1.
The temperature to be deined for the concrete core, conservatively, will be the higher of the two values:
θc,eq=max (θc,eq1 e θc,eq2).
The temperature for the steel tube is deined directly from the numerical model results by taking the average thickness of the tube and considering a small variation along the thickness. To set the temperature in the reinforced
bars, a procedure similar to that of the steel tube was performed, but only considering the temperature regarding the position of the bars in the corner of the cross section and disregarding temperature changes depending on the tube thickness.
2.2 Numerical model
To obtain the temperature field through the ABAQUS software, we ap-plied in the plane model:
a) Finite element formulation considering the basic equation of the energy balance together with Fourier law (DC2D4 – 4 nodes linear heat transfer quadrilateral);
b) Standard ire curve (ISO 834) to heat the element, as thermal load applied
at the four edges of the steel tube through radiation and convection mechanisms;
c) Radiation factor equal to 1, emissivity of the exposed face of the tube 0.7 and of the ire equal 1;
d) Convection coefficient for the exposure surface equal to 25 Wm2/oC
and Stefan-Boltzmann constant of 5.67x10⁻⁸ Wm-2K-4;
e) Density of steel and concrete
7850 kg/m3 and 2300 kg/m3, respectively,
and the presumed actual moisture of 3%, considered through the speciic heat equation.
The temperature ields determined in the numerical simulation were com-pared with the models listed in Sant'anna (2009) and as can be seen in the example of Figure 3, the values of the ield tem-peratures were similar, having differences of less than 5% at the established points.
Figure 3
Comparisons of temperature profiles for a column L=140 mm, tube thickness = 6.3 mm and t =45 min.
Renaud (2004) shows a tempera-ture spread study about square section columns under ire conditions, through experimental tests and simulations con-sidering the material properties indicated in Eurocode 4. The results of the model
(Figure 4b) were compared with the tem-perature proile set by ABAQUS (Figure 4a). The composite column consists of a steel tube illed with concrete with a length of L = 200 mm and thickness of 5 mm. The comparison was made for
the ire exposure time of 30 minutes, without considering the resistance in heat conduction between the steel tube and the concrete, showing a good ap-proximation regarding the temperatures at the points indicated.
(a) (b)
Figure 4
Temperature profiles obtained at 30 minutes of fire exposure.
The sections with the temperature ield were sectored considering uniform divisions in layers with maximum thickness of 20 mm, and the thickness of the steel tube was
not subdivided.
With the temperature ield obtained by a numerical model, and taking into con-sideration the average temperatures in each
sector, the coeficients and the equivalents temperatures were obtained θc,eqe θa,eq in order
to determine the mechanical properties and load capacity of the columns.
141 REM, Int. Eng. J., Ouro Preto, 70(2), 137-147, apr. jun. | 2017
2.3 Parametric study
Some of the material properties are presented in Eurocode 4 and others according to other standards with differ-ent values, for example, the coeficidiffer-ent of thermal expansion of the concrete, the concrete density and moisture content of the concrete. In order to verify the
dif-ferences in the temperature of the steel tube and the concrete core, we prepared three-dimensional models for a tube length of 500 mm. Thermal analysis was performed for two composite columns with square section, as shown in Table 2 and Table 3. The models were developed
considering the variation of concrete properties and the resistance on the ther-mal conduction between the steel tube and the concrete core. This resistance on the thermal conduction comes from a gap made from the differential expansion between the materials.
Variable properties of the concrete
Model
Thermal expansion coefficient of
the concrete
Agraggate type
Thermal expansion of the steel
Concrete moisture
Concrete density
1 according Eurocode 4 siliceous according
Eurocode 4 3%
according Eurocode 4
2 according Eurocode 4 siliceous according
Eurocode 4 10%
according Eurocode 4
3 according Eurocode 4 siliceous according
Eurocode 4 3% 2300 kg/m3
4 according Eurocode 4 siliceous according
Eurocode 4 3% 2400 kg/m
3
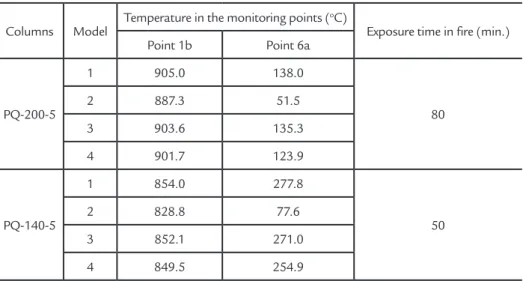
Table 3 presents the temperature in the middle of the concrete core and the
temperature of the steel tube; tempera-tures that were taken from the monitoring
points as shown in Figure 1: (point 6a) and (point 1b), respectively.
Table 2 Models for parametric study - properties of the concrete.
Temperatures according to parametric analysis
Columns Model Temperature in the monitoring points (
oC)
Exposure time in fire (min.)
Point 1b Point 6a
PQ-200-5
1 905.0 138.0
80
2 887.3 51.5
3 903.6 135.3
4 901.7 123.9
PQ-140-5
1 854.0 277.8
50
2 828.8 77.6
3 852.1 271.0
4 849.5 254.9
Table 3 Temperatures obtained in three-dimensional models.
According to Figure 5, differ-ences in temperature in the middle of the concrete core and the steel tube can be seen taking into account the
variations in the concrete proper-ties. A composite column with a tube having a side dimension of 200 mm and thickness of 5 mm was named
as PQ200-5. The composite column with a tube having a side dimension of 140 mm and thickness of 5 mm was named as PQ140-5.
Figure 5 Results of three-dimensional
142
2.4 Study of thermal resistance between the steel tube and concrete core
The steel and the concrete have ther-mal distinct properties and they expand
differently when submitted to high tem-peratures. The steel tube expands faster
than the concrete core, which leads to a gap between the materials (Fig. 6).
Figure 6
Gap between the steel tube and the concrete core in high temperature.
The gap affects the heating transfer by conduction between the steel tube and the concrete core, modifying the tem-perature ield along the cross section. This effect can be considered by the software Abaqus, which stops the heat transfer by conduction when the contact between the steel tube and concrete core disappears, maintaining the heat transfer by convec-tion and radiaconvec-tion.
What is possible to see in the avail-able researches is the option of a perfect contact, without considering the gap and
the thermal resistance between the tube and the concrete core or the adoption of a thermal dissipation coeficient or thermal resistance, which can be applied to the numerical models as a ilm at the interface between the two elements (tube and con-crete). This coeficient must be adjusted by numerical or experimental tests.
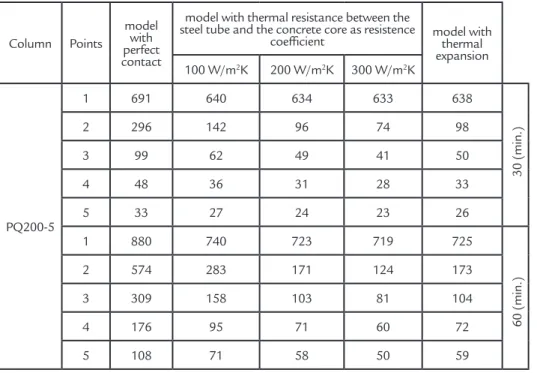
To evaluate the resistance effect to the thermal conductivity in the interface between the steel tube and the concrete core, a tridimensional model was elabo-rated for the square section column named
PQ200-5. The steel and the concrete properties were taken from Eurocode 4, and in this model the thermal contact conditions between the steel tube and the concrete core were altered. Three numeri-cal analyses were elaborated considering different coeficients of thermal resistance, besides another one considering the per-fect contact and a inal one considering the thermal expansion of the materials.
The characteristics and results of the study of the thermal resistance can be seen in Table 4.
Temperatures obtained in the cross section ( oC )
Column Points
model with perfect contact
model with thermal resistance between the steel tube and the concrete core as resistence
coefficient model with thermal expansion 100 W/m2K 200 W/m2K 300 W/m2K
PQ200-5
1 691 640 634 633 638
2 296 142 96 74 98
3 99 62 49 41 50
4 48 36 31 28 33
5 33 27 24 23 26
1 880 740 723 719 725
2 574 283 171 124 173
3 309 158 103 81 104
4 176 95 71 60 72
5 108 71 58 50 59
30 (min.)
60 (min.) Table 4
Temperatures obtained in cross section in the numerical
analyses from the tridimensional models.
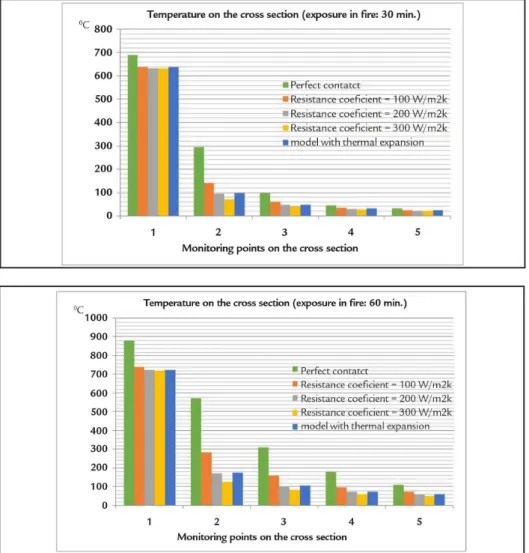
Figure 8 compares the values indicated in Table 4 regarding the temperature in the cross section for 30
minutes of ire exposure and Figure 9 for 60 minutes of ire exposure. The temperatures monitoring points in the
tridimensional models indicated in the second column of Table 4 are also indi-cated in Figure 7.
Figure 7
143 REM, Int. Eng. J., Ouro Preto, 70(2), 137-147, apr. jun. | 2017 Figure 8
Temperatures in the cross section obtained for 30 min in fire exposure.
Figure 9 Temperatures in the cross section obtained for 60 min in fire exposure.
2.5 Simplified equation for the temperature field
A parametric study was prepared for the purpose of obtaining data to conduct a review and deine the
equa-tions to set the equivalent temperature of the concrete core and steel tube and it was conducted considering the
variations in the characteristics of the columns, as shown in Table 5 with a total of 48 samples.
PARAMETRIC STUDY
Features Variables
Tube - external dimension "L" (mm): 100 140 200 260 300
Tube thickness "t" (mm):
5.2 5.2 6.4 6.4 9.5
6.4 6.4 9.5 9.4 12.7
9.5 9.5
Fire resistance "R" (min): 30 ; 60 ; 90 ; 120
Table 5 Values for the parametric
study and cross-section of composite columns analyzed
Based on the parametric study, the variables that signiicantly affect the tem-perature ield were identiied. By taking these variables into account, equations were deined for each ire resistance time.
These equations were transformed into a single equation for the concrete core, the steel tube and the reinforced bars.
The plane models used to determine the simpliied equations with the purpose
of deining equivalents temperatures for the concrete, the steel tube and the rein-forcing bars were elaborated considering what has been mentioned in item 2.2 and in the equations of 2.1.
3. Results
The equivalent temperatures ob-tained by numerical models, described
144
R30 R60 R90 R120
Column L/t u/A (mm-1) θc,eq,num
(oC)
θa,eq,num (oC)
θc,eq,num (oC)
θa,eq,num (oC)
θc,eq,num (oC)
θa,eq,num (oC)
θc,eq,num (oC)
θa,eq,num (oC)
100-5.2 19.2 0.040 550 710 825 920 945 995 1010 1040
100-6.4 15.6 0.040 560 705 830 920 950 995 1010 1040
100-9.5 10.5 0.040 560 705 805 915 940 995 1005 1040
140-5.2 26.9 0.029 450 700 710 910 860 985 935 1030
140-6.4 21.9 0.029 445 690 720 905 855 985 935 1030
140-9.5 14.7 0.029 465 690 730 905 865 985 955 1030
200-6.4 31.3 0.020 395 670 575 890 710 970 820 1020
200-9.5 21.1 0.020 385 660 560 890 740 970 825 1020
260-6.4 40.6 0.015 325 670 525 880 580 960 685 1010
260-9.5 27.4 0.015 330 660 525 880 615 960 740 1015
300-9.5 31.6 0.013 360 630 515 870 595 955 705 1000
300-12.7 23.6 0.013 345 620 520 860 595 950 750 1000
Table 6
Equivalents temperatures
The indicated code for the columns concerns the external dimension and the thickness of the tube.
It was observed that the pillars with
smaller "L" heat up more quickly, and that the temperature variation in the concrete is less affected with the change of the tube thickness (chart a - Figure 10), but they are
signiicantly affected when changing the massiveness factor, relationship between the perimeter, and the cross-sectional area (chart b - Figure 10).
Figure 10
Chart (a) temperature x thickness tube and chart (b) temperature x section factor “u/A”.
As observed in the chart in Figure 10 (chart b), the polynomial quadratic function is the best it to point cloud
referring to temperatures on concrete samples, providing a strong correlation coeficient of 0.98.
However, for steel tubes, linear functions give ine results, as shown in the Figure 11.
Figure 11
Chart of the temperature functions in the steel tube.
From the determined polynomial equations for each time of ire resistance,
a single equation was deined to obtain the equivalent temperature in the core
concrete as follows:
To determine the equivalent temperature in the steel tube, a simpliied equation (4) was set by regression:
(3)
145 REM, Int. Eng. J., Ouro Preto, 70(2), 137-147, apr. jun. | 2017
(4)
(5)
From temperatures in reinforced bars, a simpliied equation (5) was deined by regression.
Where: "R" (min.) is the ire resis-tance time; "u/A" (mm-1) is the section
factor of the cross section, "u" is the perim-eter and "A" the area of the cross section.
4. Discussion
In the numerical plane model, used to produce the simplified equa-tions, the resistance for heat conduction along the interface of the steel tube and the concrete core has been neglected, since it was considering the value of 200 W/m²K, recommended by Ding and Wang (2008). Signiicantly lower tempera-tures result, however the value indicated for the thermal resistance coeficient pro-vided satisfactory results.
The Eurocode 4 shows limits for tube dimensions, but this will not be discussed in this work and to apply the proposed method to it, the dimensions and characteristics of the cross section and ire resistance time range speciied in the table 5 should be followed; extrapolation is not valid.
Regarding the reinforced bars, it was observed that its inclusion in the
model, practically does not change the temperature distribution in the cross sec-tion. Therefore, the temperatures in the rebars were considered the same as the concrete core in which the rebar’s axis is encountered.
In composite columns with em-bedded reinforced bars, the equivalent temperature of the bars was deined tak-ing into account a cover thickness of 3.0 cm. In higher covers, the elements will be exposed to minor temperatures and will be safer.
The equivalent temperature deter-mined by equation (3) has a maximum error of 8.6% and average error of 1.3%. The simpliied equation to determine the equivalent temperature in the steel tube (4) has a maximum error of 4% and an average error of 0.4% and the equation for the reinforced bars has a maximum error
of 7% and an average error of 2.2% with reinforced bars at the corners.
The monitoring points of tempera-tures in numerical models plans, from the vertex of the cross section provided conservative values with the points set out from the middle of the edge, and there is less difference for longer periods of ire exposure. An intermediate value between the temperatures obtained in both points from the edge and from the vertex, could be adopted. However, in order to deine con-servative values, we chose to maintain the values for the temperature obtained by the path developed from the vertex (Figure 1).
Table 7 shows the equivalent tem-peratures for the concrete and the steel tube determined through the simpliied equations shown in this paper, considering the temperatures taken from the vertex and from the edges.
Equivalent temperatures for the concrete and the steel tube
Column Exposure time in fire (min.) u/a (mm-1)
Points i,a (from the vertex)
Points i,b
(from the edge) Diference
Concrete (oC)
Steel tube (oC)
Concrete (oC)
Steel tube (oC)
Concrete (oC)
Steel tube (oC)
PQ-200-6.4 30 0.020 395 670 285 620 27.8% 7.5%
PQ-140-5.2 30 0.029 450 700 390 655 13.3% 6.4%
PQ-200-6.4 60 0.020 575 890 570 870 0.9% 2.2%
PQ-140-5.2 60 0.029 710 910 645 890 9.2% 2.2%
Table 7 Equivalent temperatures
for the concrete core and for the steel tube.
To compare the answers obtained through the simpliied equations, the tables shown in Renaud (2004) were used. These tables provide temperatures at determined points in the concrete core, in the steel tube and in the reinforcing bars and they were
constructed according to the numerical mod-els elaborated in the TASEF and SISMEF software. In these models, adapted were: a moisture of 4% of the concrete mass; ther-mal resistance between the steel tube and the concrete core of 0.01 m2K/W; reinforcing
146
Equivalent temperatures for the concrete and the steel tube (oC)
Columns
Exposure time in fire (minutes)
Simplified equations Renaud Diferences
Concrete Steel tube Concrete Steel tube Concrete Steel tube
PQ-200-5 30 384 663 340 705 -12.94% 5.96%
PQ-140-5 30 452 684 400 715 -13.00% 4.34%
PQ-200-5 60 596 886 540 885 -10.37% -0.11%
PQ-140-5 60 705 902 570 895 -23.68% -0.78%
Table 8
Equivalent temperatures according to equations proposed and Renaud.
Temperatures in the reinforcing bars in the corners in columns of square sections
L (mm) R (min) u/a (mm-1) Simplified
equation (oC) Renaud (
oC) Diferences
140 30 0.029 300 302 0.74%
200 30 0.020 289 288 -0.27%
300 30 0.013 280 287 2.36%
140 60 0.029 596 575 -3.61%
200 60 0.020 562 530 -5.95%
300 60 0.013 535 518 -3.27%
Table 9
Temperatures in the reinforcing bars according
to equations proposed and Renaud.
The differences between equiva-lent temperatures determined by the simpliied equations proposed in this article, and determined in Renaud
(2004) are explained by the different parameters and properties adopted in the numerical models, and one should observe that the equations proposed
considered, conservatively, the tempera-ture set points in a path disposed from the vertex of the cross section.
5. Conclusion
The method and equations shown in this paper have provided satisfactory re-sults for deining equivalent temperatures for the composite columns of a square sec-tion. The results, however, have shown to be conservative; irst, because the thermal resistance between the steel tube and the concrete core was not taken into consider-ation, and second, because of the adopted parameters and the simpliications
inher-ent to the procedure. This procedure can be extended to other types of usual cross sections. Nonetheless, the practical appli-cation of the method requires an analysis with more samples, taking into account the thermal properties of concrete and steel and considering adjustments based on the research conducted. The simpliied equa-tion to obtain the temperatures of the re-inforced bars can have its results improved
by using a larger number of numerical simulations to deine an equation for the nonlinear regression, considering the other bars in addition to the ones in the corner of the cross section and with other cover rebars. The procedure shown in this paper is a complementary process to obtain tem-perature ields in composed columns and can be a starting point for discussions in future regulatory code review.
Acknowledgment
I would like to thank my supervisor, Dr. Armando Lopes Moreno Junior, for
the dedication and follow-up in this work, the Universidade Estadual de Campinas
and Universidade Católica de Santos, for the support I have received.
References
ABAQUS. Finite Element Analysis. Pawtucket: Hibbert, Karisson & Sorenson, 2006. DING, J., Wang, Y.C. Realistic modelling of thermal and structure behaviour of
mprotected concreto illed tubular columns in ire. Journal os Constructional Steel Research 64:1086-1102, n.64, p. 1086-1102, 2008.
CAPILLA, A. E. Numerical analysis of the ire resistance of circular and ellipti-cal slender concrete illed tubular columns. . Universitat Politècnica de València, Spain, 2012. (Doctoral Thesis).
147 REM, Int. Eng. J., Ouro Preto, 70(2), 137-147, apr. jun. | 2017
Received: 27 October 2015 - Accepted: 22 December 2016.
EUROPEAN COMMITTEE FOR STANDARDIZATION (CEN). EUROCODE 4: “Design of composite steel and concrete structures – Part 1.1: General Rules and rules for buildings” –pr EN 1994-1-1. Brussels, 2003.
EUROPEAN COMMITTEE FOR STANDARDIZATION (CEN). EUROCODE 4: “Design of composite steel and concrete structures – Part 1.2: General Rules – Structural ire design” –pr EN 1994-1-2. Brussels, 2002.
LESKELA, M. V. Inconsistencies in the ire design rules of composite columns to EN 1994-1-2. Steel Concrete Composite and Hybrid Structure. Leeds, England, 2009. p. 489-494
LIE, T. T. Fire Resistance of Circular Steel Columns Filled with Bar-Reforced Concre-te. Journal of Structural Engineering, n. 120, p. 1489-1509, 1994.
LIE, T. T. IRWIN, R. J. Fire Resistance of Rectangular Steel Columns Filled with Bar-Reinforced Concrete. Journal of Structural Engineering, n. 121, p. 797-805, 1995.
SANT´ANNA, M. S. 2009. Composite slender steel columns illed with concrete, square section in ire situation. Universidade Estadual de Campinas, Brazil, 2009. (Master Thesis).