149
REM:, Int. Eng. J., Ouro Preto, 70(2), 149-156, apr. jun. | 2017
Rovadávia Aline de Jesus Ribas
Professora Efetiva
Universidade Federal de Ouro Preto - UFOP Escola de Minas
Departamento de Engenharia Civil - DECIV Ouro Preto - Minas Gerais – Brasil [email protected]
Henor Artur Souza
Professor Titular
Universidade Federal de Ouro Preto - UFOP Escola de Minas
Departamento de Engenharia de Controle e Automação e Técnicas Fundamentais - DECAT Ouro Preto - Minas Gerais – Brasil
Acoustical and
thermal performance of
multilayer closing panels
used in steel-structured buildings
Abstract
This article provides an evaluation of the acoustical and thermal performance of some closing systems by referencing materials such as cement plates, plasterboard walls, precast concrete panels and expanded polystyrene. Reverberation time is cal-culated by applying an empirical formula, which uses temperature and relative air humidity values obtained from simulations that were conducted using the computa-tional simulation program ESP-r (Energy Simulation Program-research). The internal temperature presented by the ESP-r is an indicator of thermal performance. Using a simpliied graphic method, the acoustical performance is also evaluated by estimating the loss of sound transmission that occurs through the closing panels. Combinations of these panels, which form multilayer panels mediated by a layer of air and with or with-out insulating material between them, are applied. The results show that multilayered closing systems, when illed with insulating material, are an eficient solution than can provide adequate acoustical and thermal performance.
Keywords: building acoustics. steel-structured buildings. closing panels. acoustical and
thermal performance.
http://dx.doi.org/10.1590/0370-44672014700060
Civil Engineering
Engenharia Civil
1. Introduction
Steel structure construction has proven to be a comprehensive aspect in the development of civil construction, particularly in projects that can provide adequate global eficiency. However, the rapid assembly of metallic structures in construction systems requires the applica-tion of closure systems that follow philoso-phies similar to those of prefabrication and speedy construction. As such, the use of industrial closing systems is presented as a rational solution. In the Brazilian con-struction market, several pre-fabricated panels are available. A global analysis of thermal and acoustical performance prevents future interventions in the con-struction (SALES, 2001).
The use of multilayer closing systems, systems composed of two panels mediated by a layer of air and insulating material, can result in superior acoustical performance. High-quality performance is linked to an increase in noise transmission loss without requiring high cost or signiicant material accumulation. Thus, sound transmission loss through a wall, and reverberation time within an environment because of existing people, air and surfaces may be acoustical performance indicators of locks. However, these closing systems have low thermal inertia, which may compromise their thermal performance and require an integrated study of their thermal and acoustical performance (BIES; HANSEN,
2003; RIBAS; SOUZA, 2011).
The purpose of this paper is to conduct a thermal and acoustical evalu-ation of the performance of some multi-layer closing systems that are used in the construction of steel structures in Brazil. Examples of these systems include ce-ment plates, plasterboard walls, precast concrete panels and expanded polysty-rene. The study has been performed on composed panels (multilayer system) with and without insulating material. An esti-mation was conducted to determine the sound transmission loss (TL), which occurs
through the closings, and reverberation time (RT) and temperature (Ti), which
oc-cur in the environment.
2. Materials and methods
An estimation of TL is made
through a simpliied graphical method presented by Sharp (1973) and ana-lyzed by Bies and Hansen (2003) and Bistafa (2006). The RT is calculated
from an empirical formulation devised
by Citherlet (2001), which uses simu-lated values for temperature and rela-tive air humidity obtained through the computational program ESP-r (Energy
Simulation Program – research). The
RT is calculated by using the building
150
2.1. Sound transmission loss (
TL
)
The loss in sound transmission (TL),
which occurs when sound arrives at the other side of a wall with a lower intensity
than the original sound is a characteristic of sound insulation and the closure may indicate its acoustical performance (BIES;
HANSEN, 2003; BISTAFA, 2006). Gerges (2000) presents Eq. (1) for the calculation of the TL, called mass law:
TL
= 20log (
f
.
M
) - 47.4 (dB)
(1)where f is the frequency of the incident
wave (Hz) and M is the surface density of
the wall material (kg/m²).
In a single wall, the sound trans-mission loss is inluenced by the fre-quency of the incident sound (f)
exhib-iting different resonance and vibration
behavior, depending on the wall’s mass and stiffness. The TL of simple isotropic
panels (solid and homogeneous) can be obtained from experimentational or standard essays or can also be estimated as a function of critical frequency, fc, Eq.
(2), by applying the simpliied graphical
method to one idealized model composed of one panel with dimensions a, b and h, bending stiffness (Bs), Eq. (2), and
module of elasticity (E), as shown in the
Figs. 1 and 2. This method considers the simply supported panel, which limits its applicability (BISTAFA, 2006).
Figure 1
Idealized model of an
isotropic simply supported panel.
Figure 2
Estimation of the TL through simple
isotropic panels (BIES; HANSEN, 2003).
s c
B
M
c
=
f
2
2and
12
3
s
Eh
=
B
(N.m)
where c is the speed of sound wave in air
(m/s); M is the surface density of the material
panel (kg/m²); Bs is the panel’s bending
stiff-ness (N.m), given by Eq (2), E is the module
of elasticity of the material (N/m²) and h is
the thickness of the panel (m).
The points A and B in Fig. 3 have coordinates (0.5 fc; TLA) and (fc; TLB),
re-spectively, calculated by Eq. (3).
(2)
(3)
(4)
TL
A= 20log (
f
c.
M
) - 54 (dB) and
TL
B= 20log (
f
c.
M
) + 10logh - 45 (dB)
where h is internal damping factor of the panel (non-dimensional). After
the point B and fc, the TL is given by
Eq. (4), valid for f > fc, applied until the
frequency to which the TL is calculated
by the mass law, Eq. (1).
45
10log
20log
c
f
f
+
M)
(f
=
TL
(dB)
Closing systems with double walls may produce more sound insulation than those produced by systems with simple walls, provided the walls are of the same
thickness, Fig.3. Due to the complexity of the sound energy transmission between the panels, the acoustical insulation is not equivalent to the sum of the
151
REM:, Int. Eng. J., Ouro Preto, 70(2), 149-156, apr. jun. | 2017
method, which is based on Sharp’s analy-sis (1973), considers that panel ixation is determinant on the eficiency of their sound transmission (GERGES, 2000; HASSAN, 2009).
The panels can be ixed to the same scantling or metallic profile through resilient bars in an effort to reduce the mechanical vibrations. There are two common approaches to ixing the panels that result in four possible combinations. When the panel is ixed directly to the
scantling or metallic proile, one line of contact is created between these two ele-ments to create the ixation in line. The
spacing among the scantlings or proiles (b), Eq. (8), should be uniform. The four
possible combinations of ixation are line-line, line-punctual, punctual-line-line, and punctual-punctual. In the case of ixation in line or punctual ixation, the simpliied graphical method is applied when the panels are ixed to the same scantling or metallic proile. Through formulation,
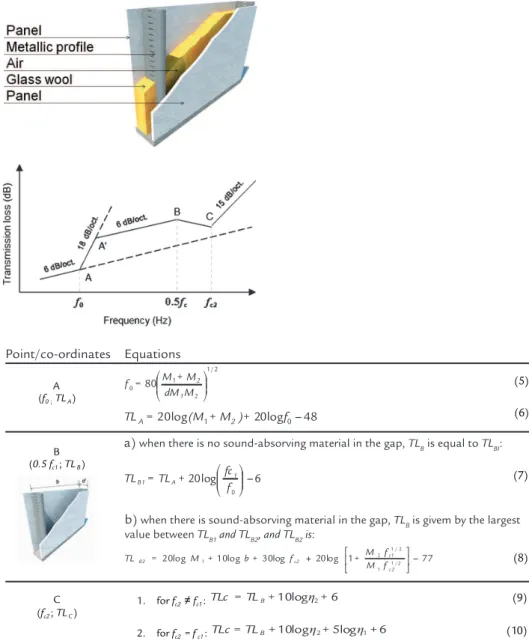
the coordinates of the points A, B and C are determined through estimation of the coordinates from point A’ (Fig. 4). The formulation applied through the simpliied graphical method to determine the TL curve, based on line-line ixation,
is shown in Table 1, Eq. (5) to (10). In the formulation, number 1 is associated with the panel that generates the smallest
fc, and number 2 is associated with the
remaining panel (BIES; HANSEN, 2003; BISTAFA, 2006).
Figure 3 Diagram of the closing systems: with absorber material.
Figure 4
Estimation of TL through double walls
(BIES; HANSEN, 2003; BISTAFA, 2006).
Table 1 Coordinates of the points A, B and C to line-line fixation.
where f0 is the lowest frequency of
resonance from the set mass-air-mass (Hz); TLi is the transmission loss at the
point i (dB); d is the spacing among the
panels or deepening of the cavity (m);
Mi is the surface density of the panel i (kg/m2); f
ci is the critical frequency
of the panel i (Hz), seen in Eq. (2);
b is the spacing among scantlings in
the ixation in line (m); and hi is the internal damping factor of the panel material i.
A (f0 ;TLA)
(5) (6)
B (0.5 fc1; TLB)
(7)
(8)
C (fc2; TLC)
1. for fc2 fc1:
2. for fc2 = fc1:
(9) (10)
2 / 1 2 1 0 80 dM M
M + M = f
1 2
6 20log
0
f fc + TL =
TL 1
A B1
77 1
20log 30log
10log
20log 1/2
1 2 / 1 2
1 +
c1 c2
B2
f M
f M + f
+ b + M = TL
6 10log 2+
+ TL = B
6 5log
10log 2+ 1+
+ TL = B
Point/co-ordinates Equations
a) when there is no sound-absorving material in the gap, TLB is equal to TLBI:
b) when there is sound-absorving material in the gap, TLBis givem by the largest value between TLB1 and TLB2, and TLB2 is:
2.2 Reverberation time (
RT
)
The RT can indicate the acoustical
performance of a closing and it depends on the frequency of emission, the capacity of the surrounding material to absorb this frequency, the volume of the present air
and the spectrum of the sound frequencies. It is characterized by the absorption due to the closing (wrapper), the furniture, the persons and the existing air in the room (BIES; HANSEN, 2003; HASSAN, 2009;
152
building, which absorbs the internal noise, is required. Sabine deined the RT by the
Eq. (11), in 1896 (CITHERLET, 2001; BISTAFA, 2006).
t f
A
V
=
RT
0
.
161
(s)
(11)(12)
where V is the volume of the room (m³); f is the considered frequency (Hz); and At
f is the total area equivalent to the
room to the frequency f (m²). The total
area equivalent (At
f ) is deined by the
sum shown in Eq. (12) (CITHERLET,
2001; HASSAN, 2009; KNUDSEN; HARRIS, 1978).
(
S)
(N A )+ (P A mVA + A + A = A
obj
j
pes
k
pess f k, k obj
f j, j fech
i
Sab f i i ar
f pes + obj f fech f t
f = . , + )+4 (m )
where Affech is the area of equivalent
absorption of the closing in the interior of the room (m² Sabine); Afobj+pes is the
absorption equivalent of the objects and persons in the interior of the room (m²);
Afar is the equivalent absorption due to
the air in the interior of the room (m²)
should be considered at frequencies equal or above 1000 Hz ; Siis the area of the
internal surface i of the room (m²); ai,fSab
is the Sabine´s coeficient of absorption of surface i in the frequency f; Nj is the
number of occurrences of the object like j, Aj,fobj is the equivalent area of
ab-sorption of the object j in the frequency
f (m²); Pk is the number of occurrences of
the person k; and Ak,fpes is the equivalent area of absorption of the person k in the
frequency f (m²); m is the coeficient of the
sound absorption of the air (m-1); V is the volume of the room (m³).
2.3 Acoustical and thermal performance
Quantify acoustical performance is an essential step to improve the isolation of an environment. So standards are designed to establish reference values that aim to pro-vide sound insulation to the environment ideal for the activity there developed (BIES; HANSEN, 2003; DUARTE; MOOR-HOUSE; VIVEIROS, 2012).
The reverberation time should be based on the use of the room, as inadequate values may disrupt the intelligibility or quality of speech. The higher the volume in the room and the greater number of low-absorbing materials used, the higher will be the duration of the reverberation. If the reverberation continues in the
envi-ronment for a signiicant length of time, it may overcompensate the position of syl-labi and/or musical notes; if it disappears altogether, some sound sources may not be perceived at all (MAEKAWA; RINDEL; LORD, 2011).
Because spaces where speech and verbal communication is anticipated (class-rooms, conference spaces and theatres) require smaller reverberation times, ideally, the relected sound decreases rapidly to prevent interference with direct sound and does not reduce its intelligibility. For a small room, a reverberation time of 0.5 s is ad-equate. However, a longer time is necessary for concert halls because the reverberation
until a certain point is required to ensure that acoustical quality in orchestral music is not compromised (MEHTA; JOHNSON; ROCAFORT, 1999; BISTAFA, 2006).
According to the Brazilian Stan-dard NBR 15575 (ABNT, 2013), a clos-ing system must have appropriate acous-tical insulation to aerial external noises, by impacts and among environments. The minimum thermal performance in summer in Brazil is veriied when
Ti,max≤ Te,max, where Ti,max, is the maximum
value of the air temperature registered in the ediice (°C) and Te,max, is the
maxi-mum value of the external air tempera-ture registered.
3. Results
3.1 Estimate of the
TL
An estimation of the TL is made for
multilayer closing systems, which consist of combinations of cement plates (PLC),
plasterboard walls (GEA), precast concrete panels (PMC) and expanded polystyrene (EPS), with or without sound absorber
mate-rial in the panel air cavity. Glass wool (LVI) is preferred. The acoustical features of the panel materials are shown in the Table 2.
Material E (N/m2) ρ (kg/m3) h B
s (N.m) fc (Hz)
PLC (10) 1.2x10⁸ 1330 0.005 83 21158
GEA (12.5) 2.0x10⁹ 750 0.006 339 3113
PMC (75) 2.3x10¹⁰ 2400 0.020 842285 274
EPS (100) 2.5x10⁶ 960 0.005 210 12670 Table 2
Acoustic features of the panel materials.
The dimension b is assumed equal to
0.60 m and the ixation is line-line. One of the closing systems is ictitious, for example,
the use of the plasterboard as an external closing. However, it is applied to the simula-tions for comparison with other situasimula-tions.
The EPS panel is formed with mortar that
is 22.5 mm thick and EPS that is 55 mm
thick and mortar that is 22.5 mm thick.
3.2 The thermal simulation and the calculation of the
RT
nu-153
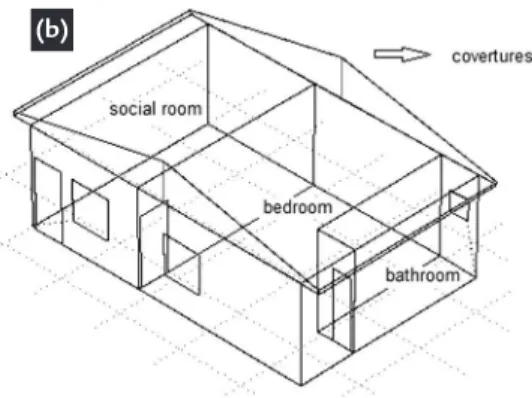
REM:, Int. Eng. J., Ouro Preto, 70(2), 149-156, apr. jun. | 2017 Figure 5
Basic plant (a) and perspective (b) of the building, generated by ESP-r.
(a) (b)
For the coniguration of each space, the internal and external closings are var-ied during the simulations, the materials in Table 3 are applied and the compositions of the other closing materials and the thickness are: the ground: ceramic mate-rial (10), mortar (20) and concrete base (80); the cement slab: cellular autoclaved (CCA) (140), composed by one concrete layer (20), CCA (100) and total internal redressing in mortar (20); covertures: ceramic tile (10); windows: common trans-parent glass (4); external door: wood with medium speciic mass (25); internal door: compensated wood (25); closing of bath: wall (105) composed by
PLC(10)-air(75)-PLC(10) and ceramics (10).
The presence of persons, lamps turned on and equipment gaining casual heat (sensible and latent) was not consid-ered. For air low, a rate of renewal equal to 3 ren/h is adopted (ABNT, 2013). For the characterization of the weather condi-tions, the weather zoning presented by the Brazilian Standard NBR 15220 (ABNT, 2005) was adopted. Data for one typical summer day from zone three were used (13/01/2000) with the city of Belo Hori-zonte used as a reference (latitude – 19.85 and longitude – 43.9). Other data utilized in the simulations (medium values) are the following: variation of sun radiation
incident for a horizontal plan (RS) equal
97.71 W/m2, dry bulb temperature (TBS) equal 24.47 °C, sun radiation incident for a normal direction (RSTotal) equal 299.08 W/
m2, predominant wind speed and direc-tion equal 1.68 m/s e 77.5° (time sense from North), and relative air humidity (hr)
equal 63.13 %.
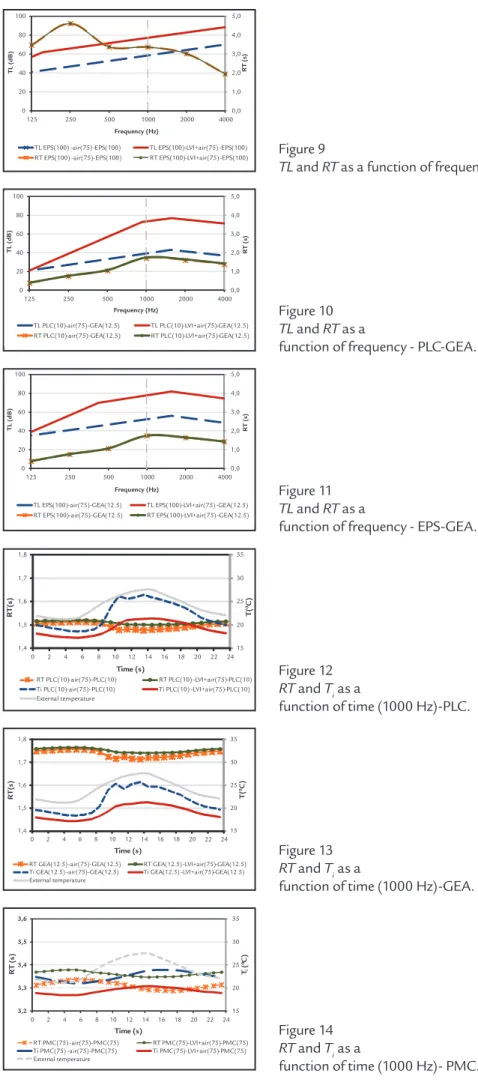
The variation of the TL and of the RT,
as a function of frequency and at 14:30 when the temperature reaches 27.5 °C, for the social room, is illustrated by curves in Fig. 6 to 11. The variation of the Ti and
of the RT, as a function of time and at a
frequency of 1000 Hz, is shown in the curves in Fig. 12 to 17.
merical simulation. The building, with an area of 54 m2, is divided into four
thermal zones (social room, bedroom, bathroom and covertures), ceiling
height of 3.00 m and total height of 4.20 m, Fig. 5.
Figure 6
TL and RT as a function of frequency - PLC.
0,0 1,0 2,0 3,0 4,0 5,0
0 20 40 60 80 100
125 250 500 1000 2000 4000
RT
(s
)
T
L
(d
B)
Frequency (Hz)
TL PLC(10) - air(75)- TL PLC(10) -LVI+air(75) -PLC(10) RT PLC(10) - RT PLC(10) -LVI+air(75)- PLC(10)
Figure 7
TL and RT as a function of frequency - GEA.
0,0 1,0 2,0 3,0 4,0 5,0
0 20 40 60 80 100
125 250 500 1000 2000 4000
R
T
(
s)
T
L
(d
B)
Frequency (Hz)
TL GEA(12.5) - air(75)-GEA(12.5) TL GEA(12.5)-LVI+air(75)-GEA(12.5) RT GEA(12.5)-air(75)-GEA(12.5) RT GEA(12.5)-LVI+air(75)-GEA(12.5)
Figure 8
TL and RT as a function of frequency - PMC.
0,0 1,0 2,0 3,0 4,0 5,0
0 20 40 60 80 100
125 250 500 1000 2000 4000
RT
(s
)
T
L
(d
B)
Frequency (Hz)
154
15 20 25 30 35
1,4 1,5 1,6 1,7 1,8
0 2 4 6 8 10 12 14 16 18 20 22 24
RT(s) T(
0C)
Time (s)
RT PLC(10)-air(75)-PLC(10) RT PLC(10) -LVI+air(75)-PLC(10) Ti PLC(10)-air(75)-PLC(10) Ti PLC(10) -LVI+air(75)-PLC(10) External temperature
Figure 9
TL and RT as a function of frequency - EPS.
0,0 1,0 2,0 3,0 4,0 5,0
0 20 40 60 80 100
125 250 500 1000 2000 4000
RT
(s
)
T
L
(d
B
)
Frequency (Hz)
TL EPS(100) -air(75)-EPS(100) TL EPS(100)-LVI+air(75) -EPS(100) RT EPS(100) -air(75)-EPS(100) RT EPS(100)-LVI+air(75) -EPS(100)
Figure 10
TL and RT as a
function of frequency - PLC-GEA.
0,0 1,0 2,0 3,0 4,0 5,0
0 20 40 60 80 100
125 250 500 1000 2000 4000
RT
(s
)
T
L
(d
B)
Frequency (Hz)
TL PLC(10)-air(75)-GEA(12.5) TL PLC(10)-LVI+air(75)-GEA(12.5) RT PLC(10)-air(75)-GEA(12.5) RT PLC(10)-LVI+air(75)-GEA(12.5)
Figure 11
TL and RT as a
function of frequency - EPS-GEA.
0,0 1,0 2,0 3,0 4,0 5,0
0 20 40 60 80 100
125 250 500 1000 2000 4000
RT
(s
)
T
L
(d
B)
Frequency (Hz)
TL EPS(100)-air(75)-GEA(12.5) TL EPS(100)-LVI+air(75) -GEA(12.5) RT EPS(100)-air(75)-GEA(12.5) RT EPS(100)-LVI+air(75) -GEA(12.5)
Figure 12
RT and Ti as a
function of time (1000 Hz)-PLC.
Figure 13
RT and Ti as a
function of time (1000 Hz)-GEA.
15 20 25 30 35
1,4 1,5 1,6 1,7 1,8
0 2 4 6 8 10 12 14 16 18 20 22 24 Time (s)
RT GEA(12.5) -air(75)-GEA(12.5) RT GEA(12.5) -LVI+air(75)-GEA(12.5) Ti GEA(12.5) -air(75)-GEA(12.5) Ti GEA(12.5) -LVI+air(75)-GEA(12.5) External temperature
RT(s) T(
0C)
Figure 14
RT and Ti as a
function of time (1000 Hz)- PMC.
15 20 25 30 35
3,2 3,3 3,4 3,5 3,6
0 2 4 6 8 10 12 14 16 18 20 22 24
Ti
(°
C)
R
T
(
s)
Time (s)
155
REM:, Int. Eng. J., Ouro Preto, 70(2), 149-156, apr. jun. | 2017 Figure 15
RT and Ti as a
function of time (1000 Hz)-EPS.
15 20 25 30 35
3,2 3,3 3,4 3,5 3,6
0 2 4 6 8 10 12 14 16 18 20 22 24 Time (s)
RT EPS(100)-air(75)-EPS(100) RT EPS(100)-LVI+air(75)-EPS(100) Ti EPS(100)-air(75)-EPS(100) Ti EPS(100)-LVI+air(75)-EPS(100) External temperature
RT(s) T(
0C)
Figure 16
RT and Ti as a
function of time (1000 Hz)- PLC-GEA.
15 20 25 30 35
1,4 1,5 1,6 1,7 1,8
0 2 4 6 8 10 12 14 16 18 20 22 24
Time (s)
RT PLC(10)-air(75)- GEA(12.5) RT PLC(10)-LVI+air(75) -GEA(12.5) Ti PLC(10)-air(75)- GEA(12.5) Ti PLC(10)-LVI+air(75) -GEA(12.5) External temperature
RT(s) T(
0C)
Figure17
RT and Ti as a
function of time - (1000 Hz)-EPS-GEA
15 20 25 30 35
1,4 1,5 1,6 1,7 1,8
0 2 4 6 8 10 12 14 16 18 20 22 24
Ti
(°
C)
R
T
(
s)
Time (s)
RT EPS(100)-air(75)-GEA(12,5) RT EPS(100)-LVI+air(75)-GEA(12,5) Ti EPS(100)-air(75)-GEA(12,5) Ti EPS(100)-LVI+air(75)-GEA(12,5) External temperature
4. Analysis and conclusion
The use of an insulating material in a closing system has the potential to cause an increase in the TL and a
de-crease in the Ti; however, results indicate
that it does not exert a substantial inlu-ence on the RT. In the frequency range
considered here, the TL is higher for the
PLC(10)-LVI+air(75)-GEA(12.5) when considering the closings in PLC and GEA and for the EPS(100)-LVI+air(75)-EPS(100) in the other closings. The closings in PLC and EPS exhibit the
mass law behavior for a wide range of
frequency. The other closings exhibit behaviors in the regions controlled by resonance and coincidence.
When considering the 1000 Hz in the social room wall, each of the analyzed closings conform to the criterion recom-mended by the Brazilian Standard NBR 15575 (ABNT, 2013) of a TL greater
than 35 dB. The fulilled closings with LVI resulted in better performance, and the lowest values of TL were observed at GEA(12.5)-LVI+air(75)-GEA(12.5), Fig. 6 to 11.
In the reference building model, with an equivalent frequency (1000 Hz), the PLC presents the higher coeficient of sound absorption. To this frequency, the closings resulted in values of RT greater
than the recommended value of 0.5 s for a small room designated for speech (Fig. 6 to 11). Note that the presence of persons and furniture are not being considered as housing; this omission cre-ates the tendency to reduce the area of sound absorption inside the space, which increases the RT value. When
compar-ing the performance of the closcompar-ings in reference to the RT, it is observed that
the closings constituted by PLC, GEA,
PLC-GEA and EPS-GEA show a smaller RT than others.
With respect to thermal perfor-mance, all the analyzed closings meet the criterion recommended by Brazilian Standard NBR 15575 (ABNT, 2013) of
Ti,max ≤ Te,max. The Ti is smaller for the
closings formed by EPS and EPS-GEA, but the RT is higher. Considering the RT
and Ti, the PMC(75)-LVI+air(75)-PMC
demonstrates superior performance (Fig. 12 to 17).
From the depicted results, the double closing system PLC(10)-LVI+air(75)-PLC(10) displays great acoustical and thermal performance. This study has illustrated that when choosing the most appropriate closing system for a building, it is neces-sary to perform a comparison between the results of the analyses in the frequency range of interest.
Acknowledgments
The authors gratefully acknowledge the UFOP, FAPEMIG and the CNPq, Brazil.
References
Desempe-156
Received: 8 April 2014 - Accepted: 22 December 2016.
nho térmico de ediicações, Rio de Janeiro, 2005, 92 p. (in Portuguese)
ASSOCIAÇÃO BRASILEIRA DE NORMAS TÉCNICAS. NBR 15575: Edifícios ha-bitacionais – Desempenho, Rio de Janeiro, 2013, 312 p. (in Portuguese)
BIES, D.A., HANSEN, C.H. Engineering noise control: theory and practice. 3th ed.
London and New York: Spon Press, 2003. 719 p.
BISTAFA, S.R. Acústica aplicada ao controle de ruído. São Paulo: Edgard Blücher,
2006. 368 p. (in Portuguese)
CITHERLET, S. Towards the holistic assessment of building performance based on an integrated simulation approach. Swiss Federal Institute of Technology (EPFL),
Lausanne, 2001. 164p. (Doctor ès Sciences - Thesis).
DUARTE, E.A.C., MOORHOUSE, A., VIVEIROS, E.B. Indirect measurement of acoustic power into a small room at low frequencies. Applied Acoustics, v. 73, p.
248-255, 2012
GERGES, S.N.Y. Ruído, fundamentos e controle. 2ª ed. Florianópolis: UFSC, 2000. 696 p. (in Portuguese)
HASSAN, O.A.B. Building acoustics and vibrations: theory and practice. Singapore:
World Scientiic, 2009. 972p.
KNUDSEN V.O., HARRIS C.M. Acoustical designing in architecture. New York:
The Acoustical Society of America, 1978. 408p.
MAECKAWA, Z., RINDEL, J.H, LORD, P. Environmental and architectural acoustics. 2nd ed. New York: CRC Press, 2011. 376p.
MEHTA, M., JOHNSON, J., ROCAFORT, J. Architectural acoustics: principles and design. New Jersey, Prentice Hall, 1999. 446p.
RIBAS, R.A.J., SOUZA, H.A. Acoustic performance of closing panels used in steel structure buildings. In: INTERNATIONAL CONGRESS ON SOUND & VI-BRATION, 18, 2011. Rio de Janeiro. Proceedings….p.1-8. In: E.M., Ricardo, C.
F., Raphael, B.M., Roberto (Ed.).
SALES, U.C. Mapeamento dos problemas gerados na associação entre sistemas de vedação e estrutura metálica e caracterização acústica e vibratória de painéis de vedação. Ouro Preto: Escola de Minas da Universidade Federal de Ouro Preto,
2001. 249 p. (Dissertação de Mestrado em Engenharia Civil). (in Portuguese) SHARP, B.H. A study of techniques to increase the sound installation of building