1
A Work Project, presented as part of the requirements for the Award of a Masters
Degree in Economics from the NOVA – School of Business and Economics
Spinoffs and other entrants: Evidence from Portugal
João Bento de Araújo, student number 638
A Project carried out under the supervision of Professor José Mata
2
Spinoffs and other entrants: Evidence from Portugal
Abstract
3
1. Introduction
Entry plays a significant role in economic activity, with new firms being responsible for exploring business opportunities and providing an incentive for incumbent firms to innovate to stay in the market. This thesis focuses on one particular kind of entrant, one that is created by a group of employees moving from a previous existing firm. We study the prevalence and performance of spinoffs for Portugal from 1987 to 2008, while providing evidence that other firm restructuring activities such as mergers, acquisitions and changes in firm identifiers have increased in the same time span, both in magnitude and in relative terms. This suggests that the study of this kind of firm to firm relationship is a topic that deserves growing attention, and this characterization can contribute to that purpose.
We use a probit model to estimate the probability of exit, to ascertain whether spinoffs have different exit patterns than comparable entrants, and how do they vary with the type of spinoff, while trying to understand what may cause that gap: the transference of industry specific knowledge, experience and shared routines as a team, and the opportunity cost faced by workers when creating the new venture are all factors that must be taken into consideration.
We identify these operations using matched employer-employee data, where flows of groups of workers between firms are used to establish links between them, an approach that has been gaining popularity in the past decade, opening new possibilities and research applications.
4
firms. Section 3 provides details on the worker flow methodology and describes the prevalence and characteristics of spinoffs, mergers and acquisitions, changes in legal identifier and other operations involving significant flows of workers in Portugal. In section 4 a model of firm exit is used to compare the performance of spinoffs to those of other entrants, and assess whether they can be explained by other observed differences. In Section 5 we provide a discussion of our results in light of other studies of spinoff firms, while Section 6 concludes.
2. Literature and Hypothesis
2.1 –Review of the worker flow approach and applications
5
where do its workers go? One likely answer, in which this approach is based, is that the majority of them will move to the acquiring firm. Conversely, if we can observe that the founders of a new firm worked together at a previous existing one, we can classify it as a spinoff from that parent. As long as we know where someone is employed in a given year and to where he moves in the following, we can use this to identify links at the firm level. This kind of reasoning will be used in the next sections to identify and characterize firm transitions in the data, and to study in more detail spinoff entrants. For the identification of links between firms, the work we will most closely follow is that of Benedetto et al. (2007). They apply their approach to US data and focus particularly on the study of outsourcing activities. The motivation to study this industry is that, when a firm outsources a particular activity to other, the latter may have incentives to hire employees who previously worked in the former, and who have accumulated experience there. Other studies can be found for Belgium, where Gerts et al. (2009) compare entry and exit measures with and without correcting the data with worker data, and provide evidence of the impact that ignoring this can have on computing establishment entry and exit statistics. Similar results are found for Germany (Hethey and Schmieder (2013)). For Austria, Fink et al. (2010) compare information obtained under this approach with other sources of business statistics, concluding that the results are reliable. While the previous studies contribute for validating the use of this approach, the ones closest to the purpose of this thesis use this information to study entry of spinoffs and the characteristics affecting its performance, which will be discussed below.
2.2 – The determinants and performance of spinoffs
6
can have beneficial effects on the performance of the entrant or, rather, constitute a liability, as well as the reasons that can explain possible differences to other entrants, is not certain. We provide below a synthesis of the main hypothesis present in the literature, with a particular focus on the ones we will try to test in our sample.
One key distinction that is common in the literature is that between a “pushed” and a
7
for this factor. Klepper (2007) reviews several stylized facts related to the performance of spinoffs, where the evidence points to a better performance of spinoffs from better performing firms. In particular, studies on the population of Brazilian (Muendler et al. (2012)), Danish (Eriksson and Kuhn (2007) and Dahl and Reichstein (2007)) and Swedish firms (Andersson and Klepper (2013)) suggest that, from the three groups, pulled spinoffs survive longer. With the exception of Dahl and Reicshtein (2007),pushed spinoffs also tend to perform better than other start-ups. Given both the theoretical arguments and the empirical evidence, we expect that pulled spinoffs have the lowest exit risks across all entrant types. Regarding pushed spinoffs, the predictions are not so clear. To the extent that spinoff performance is correlated with the performance of the mother firm, as hypothesized above, we expect pushed spinoffs to perform worse than the pulled spinoffs. However, we do not have a clear prediction on how they compare with other entrants. In fact, it is possible that factors such as the experience of its founders, both in an industry and as a group, prevail over the fact that they came from a dying firm.
8
and this lower propensity to spinoff may be negatively correlated with their skills, in which case group experience could have a negative effect on the success of spinoff entrants. Given this, we do not have a clear prediction for the effect of this on performance. In the particular case of pushed spinoffs this has an additional interpretation: a positive effect of experience on performance could mean that the benefits of mutual trust and coordination overweight eventual bad routines that could have led the mother firm to failure.
3. Methodology
3.1 – The Database “Quadros de Pessoal”
The data used in this work is from Quadros de Pessoal, consisting on three interconnected sets of files: for each year, we have information available for every worker, for the establishment where he works, and for the firm the establishment belongs. For this analysis, we only considered information at the worker and firm levels. This avoids that transitions of workers across establishments in the same firm are interpreted as firm to firm relationships.The period used in the analysis ranges from 1986 to 2009. There is no worker file for the years of 1990 and 2001, so we cannot identify transitions in those years and the ones immediately after. For those years, we are only using firm level information, which will still be useful in the analysis of firm performance.
3.2 – Identification of links across companies
9
of labor across firms, it may be possible to derive meaningful interpretations regarding links between those firms.
To simplify the analysis, we keep only one observation for each worker per year, corresponding to the company where he worked the most hours. For each worker and year, we identify the company where he worked in the previous year and the company where he worked in the following year. For each firm and year, we group all the workers who came from the same firm in the previous year and do the same for those who went to the same firm in the following year, excluding those who did not move across companies. From here, we create two separate panels, one for potential predecessors – firms of origin of a cluster of workers – and another for potential successors – firms that received a cluster of workers – acknowledging that these two categories may overlap, whenever there are workers entering and exiting the firm in the same year. Each observation in these panels is unique in terms of year, cluster in analysis and the identifier of the successor or predecessor, respectively. Merging these two panels means that each observation will now correspond to a potential link between two firm identifiers. The next step is to discuss how to classify those links.
3.3 – Interpreting the links between firm identifiers
10
addition, we exclude transitions observed from 2008 to 20091. This leaves us with 46639 observations. To interpret those links, we need further assumptions regarding the relative size of the cluster, when compared to the number of workers in each company. When a merger or acquisition happens between two firms, we would expect one of two situations: Either the identifiers of the two firms disappear and a new one is created, or one of them disappears and the other represents the joint firm, with most of the workers of both firms in it. Conversely, for a spinoff, we expect that a relatively small share of the workers who were at the predecessor move to the new firm in the subsequent year, where they represent a large share of the work force. Given this, we follow once again Benedetto et al. (2007) criteria and establish two workforce conditions, regarding the relative size of the cluster of workers to each firm:
Predecessor workforce condition: The cluster represents at least 80% of employment at the predecessor in the year before the transition;
Successor workforce condition: The cluster represents at least 80% of employment at the successor in the year after the transition.
Given this, there are four possible combinations, which are summarized inTable 1 along with their most plausible interpretations.
1 Although we are able to identify transitions for this period, the econometric model used in section 4
11
Table 1 – Classification according to workforce conditions
At least 80% of the workforce comes from the predecessor
Less than 80% of the workforce comes from the predecessor
At least 80% of the workforce moves to the successor
Rename 3776 (8.10%)
Merger or Acquisition 4790 (10.27%) Less than 80% of the workforce
moves to the successor
Spinoff 4102 (8.80%)
Reason Unclear 33971 (72.84%)
12
Additionally, these categories can be refined according to conditions at the firm level, which tell us whether the predecessor leaves after the transition and whether the successor is an entrant. This means that, for each cell in Table 1, there are four possible subdivisions. To acknowledge for the fact that a firm may leave a small set of workers to deal with administrative tasks before exiting and, similarly, an entrant may hire a small set of workers to for those reasons (Benedetto et al. (2007); Pivetz et al. (2001)), the following conditions are used to identify whether the predecessor exits and the successor is an entrant, respectively:
Predecessor exiting condition: number of workers after the transition corresponds to less than 10% of the workforce in the year before and is composed by less than five workers, or identifier is no longer in the database in that year;
Successor entering condition: number of workers before the transition corresponds to less than 10% of the workforce in the year of the transition and is composed by less than five workers, or the identifier was not in the database in that year.
13
that classification. Although this can translate a partial acquisition, the fact that the threshold of 80% is chosen to translate the majority of a firm suggests that this should not be verified. Table 2 summarizes the results with the additional firm categories.
Table 2 – Classification including firm conditions
Successor is an Entrant Successor was in existence Total
80% comes from predecessor Less than 80% from predecessor
80 % comes from predecessor Less than 80% comes from predecessor Predecessor Exits 80% moves to successor Rename 3501 7.51% Merger or Acquisition 2570 5.51% Rename 96 0.21% Merger or Acquisition 1986 4.26% 8153 17.48% Less than 80% moves to successor Pushed Spinoff 1993 4.27% Reason Unclear 6153 13.19% Pushed Spinoff 69 0.15% Reason Unclear 4811 10.32% 13026 27.93% Predecessor Lives on 80% moves to successor Rename 159 0.34% Merger or Acquisition 92 0.20% Rename 20 0.04% Merger or Acquisition 142 0.30% 413 0.89% Less than 80% moves to successor Pulled Spinoff 1914 4.10% Reason Unclear 5527 11.85% Pulled Spinoff 126 0.27% Reason Unclear 17480 37.48% 25047 53.70%
Total 7567
16.22% 14342 30.75% 311 0.67% 24419 52.36% 46639 100%
14
conglomerates. We find that approximately 60% of the mergers or acquisitions we identified are horizontal operations, and this share is constant across the period in analysis. For spinoffs, this will be used to test some of the ideas presented in the previous section.
3.4 – Overview of Mergers and Spinoffs in Portugal
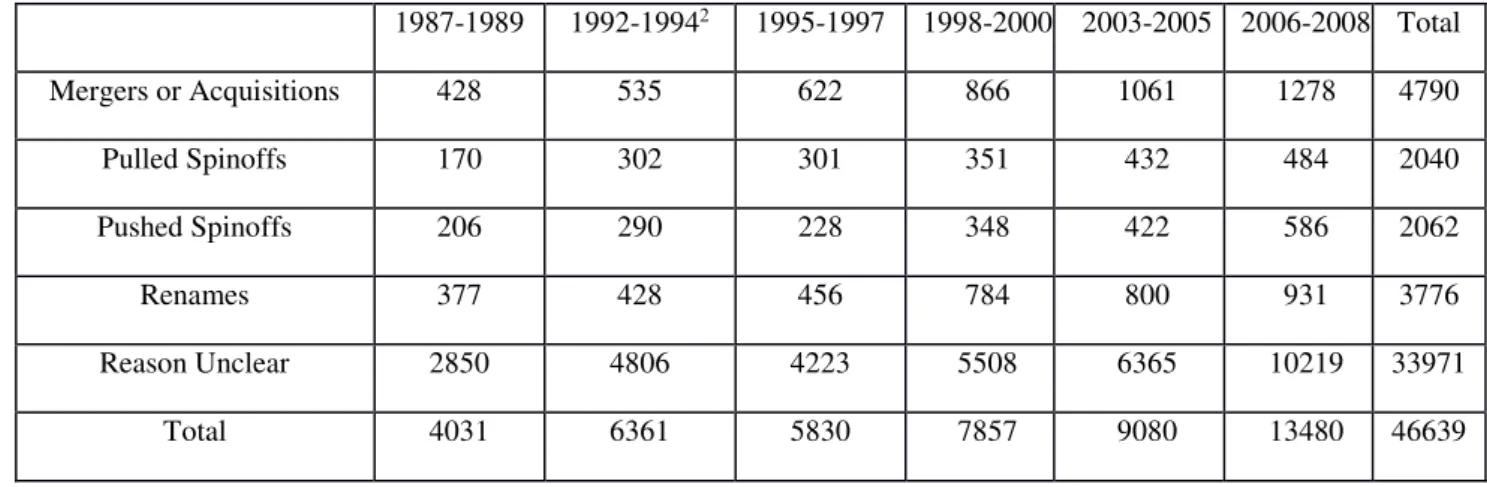
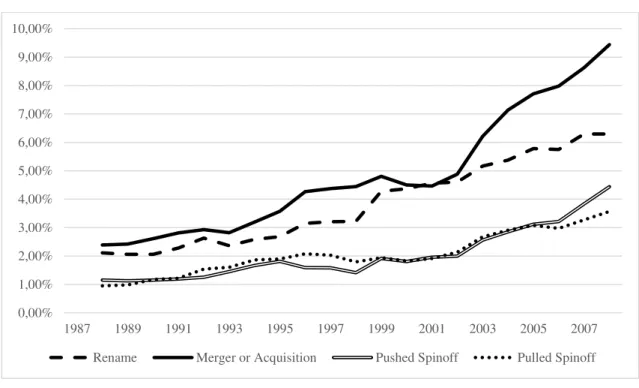
It is important to have an idea of the evolution of these operations across the years. Table 3 shows that there has been a growth in the number of such operations across time. Since the total number of firms has also increased in the period in analysis, this alone could be explaining the growth pattern. Figure 1 shows that this does not seem to be the case, since the proportion to all new entrants with over five employees also increased over the same period. The fact that there is an increasing trend in both the spinoffs and mergers or acquisitions series suggests that these kind of restructuring activity has been gaining more relevance over time, even in relative terms.
Table 3 – Evolution of Cluster Transitions over time
1987-1989 1992-19942 1995-1997 1998-2000 2003-2005 2006-2008 Total
Mergers or Acquisitions 428 535 622 866 1061 1278 4790
Pulled Spinoffs 170 302 301 351 432 484 2040
Pushed Spinoffs 206 290 228 348 422 586 2062
Renames 377 428 456 784 800 931 3776
Reason Unclear 2850 4806 4223 5508 6365 10219 33971
Total 4031 6361 5830 7857 9080 13480 46639
2 Until 1993 the survey was collected in March. From 1994 on it was collected in October. Given this, this
15
Figure 1 – Transitions as share of total entry3
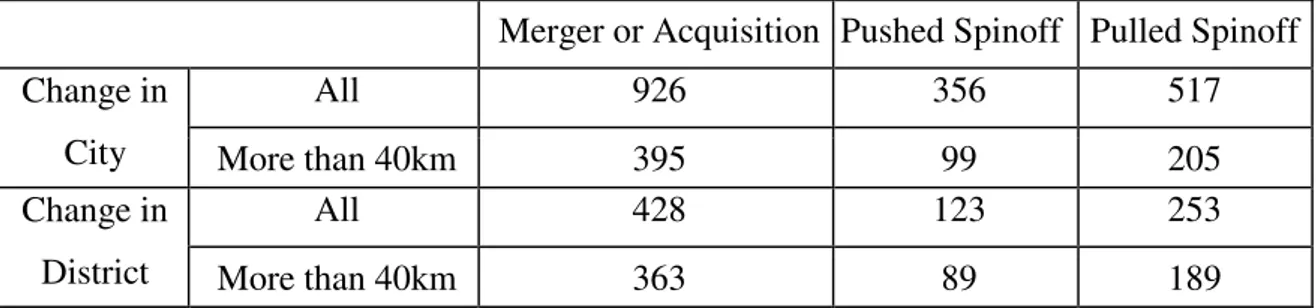
Additionally, the size distribution of predecessor and successor firms is in Tables A.1 and A.2, showing that this approach can be used to study firms of different class sizes. Another factor of interest regards the geographical patterns of these transitions. Table A.3, in Appendix, gives information on how many transitions in each category involve changes in region, both at the municipality and district levels. Additionally, to account for situations in which the municipalities are too close, so that the interpretations mentioned above are most likely irrelevant, we also report numbers where only transitions involving firms whose respective council centers are more than 40 km apart, measured in straight line, are accounted as changing council or district. Less than 10% of the transitions of either pulled and push spinoffs, mergers and acquisitions involve changes over this threshold. It is unlikely that those changes in location, particularly the ones
3 The values are measured as 3 year moving averages of the respective categories, divided by total entry in
a given year. Linear interpolations were used for the years in which we cannot identify transitions.
0,00% 1,00% 2,00% 3,00% 4,00% 5,00% 6,00% 7,00% 8,00% 9,00% 10,00%
1987 1989 1991 1993 1995 1997 1999 2001 2003 2005 2007
16
involving longer distances, translate situations in which the workers actually moved to the other region, since we are considering a minimum of five workers for our analysis. In fact, for mergers and acquisitions, they are more likely to represent situations in which firms use inorganic growth to expand to other geographical markets, instead of consolidating their presence on their own region. For pulled spinoffs, this can mean that part of the employees from firms that operate in different places may decide that they have more knowledge about their specific geographical market and are better off from separating from the mother firm to retain the benefits of that knowledge. It can also translate situations in which a firm decides to exit a market and their employees from that specific market decide to occupy the place left by the parent by creating their own venture. The numbers suggest that, while consolidation in the same market seems to me more relevant for determining the decision of firms to engage on such operations, these changes in location are a motivation that should not be disregarded.
4. The Survival of Spinoffs
17
control is to exclude every firm that exited as a merger or acquisition, rename or reason unclear since, for the reasons discussed in the previous sections, if the firm exited in one of those ways, exiting may translate reasons other than failure, which is what we want to capture in our model.
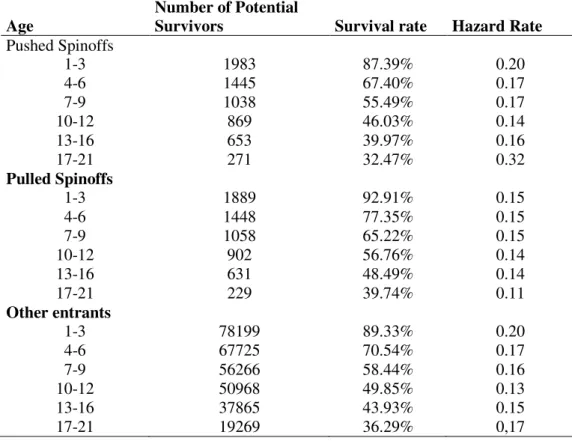
Table 4 presents the unconditional survival patterns of the firms in each group. The survival rate is defined as the share of firms that survived until a given age, here defined as an interval, from those which we would be able to observe until that age. The hazard rate is defined as the probability that a firm exits at a given interval, knowing it survived until that interval.
Table 4 – Unconditional Survival and Hazard Rates
Age
Number of Potential
Survivors Survival rate Hazard Rate
Pushed Spinoffs
1-3 1983 87.39% 0.20
4-6 1445 67.40% 0.17
7-9 1038 55.49% 0.17
10-12 869 46.03% 0.14
13-16 653 39.97% 0.16
17-21 271 32.47% 0.32
Pulled Spinoffs
1-3 1889 92.91% 0.15
4-6 1448 77.35% 0.15
7-9 1058 65.22% 0.15
10-12 902 56.76% 0.14
13-16 631 48.49% 0.14
17-21 229 39.74% 0.11
Other entrants
1-3 78199 89.33% 0.20
4-6 67725 70.54% 0.17
7-9 56266 58.44% 0.16
10-12 50968 49.85% 0.13
13-16 37865 43.93% 0.15
17-21 19269 36.29% 0,17
18
However, here pushed spinoffs have the lowest survival rates, which in Sweden is verified for the “Other entrants” category. Additionally, the convergence in hazard rates verified in the other countries may be verified in our sample until the 13-16. In fact, the hazard rate for pulled spinoffs starts at a value of 0.15 and remains relatively constant, while for the other groups it starts at a higher value and decreases to a similar magnitude. While there is a sharp decline in the hazard rate of pulled spinoffs in the last period (and rise in that of pushed spinoffs), this can result from the smaller sample in analysis.
Our main question is on whether the differences between groups persist for firms similar in other observed characteristics, or can be attributed to the type of entry on itself. For this, we estimate a probit model where the dependent variable is a dummy equal to 1 in the year of exit. Table 5 summarizes our control variables, showing that some differ significantly across groups. In particular, pulled spinoffs have, on average, a larger size at entry and a more educated workforce.
Table 5 - Average values of independent variables at entry
Pushed Spinoffs Pulled Spinoffs Other entrants
Same industry as parent 0.59 0.39 0 (by definition)
Median tenure in parent firm 6.36 7.35 0 (by definition)
Percentile 75 of tenure in parent firm 9.27 10.65 0 (by definition)
Average age of employees 37.04 37.61 33.59
Average education level (in years of schooling) 6.56 7.54 6.73
Employment 19.09 28.69 9.51
19
The effect of entry type is captured by dummy variables for whether the firm entered as a pulled or pushed spinoff, with the base category being all other entrants with five or more employees.
To test whether the performance of a spinoff depends on the industry specific knowledge acquired at the previous firm or, on the other hand, spinoffs can be justified by a perceived opportunity that deviates from the parent’s core area of activity, we use a dummy variable for each type of spinoff, that is equal to 1 if the firm is in the same industry than the predecessor.
As a proxy for the experience that the workers have as a team and may transmit to the spinoff firm, we use the median tenure at the mother firm, for the workers that moved to the spinoff entrant. The choice of this variable assures that at least half of the team has been working in the same firm for a given amount of time. In our setting, this tests whether this coordination is limited to the scope of a firm, or transferrable as the team moves to create its own firm. To consider the hypothesis that the rank of the workers involved in a spinoff may also be relevant (Phillips (2002)) we also use the 75th in model (2).
20
As a measure of entry size, we use the logarithm of employment in the firm in the year of entry.
All the variables discussed above are specified as being time invariant, i.e., we are measuring the characteristics of the firm in the year of entry. To see how the probability of exit evolves over time, we include the age of the firm and squared term, and interactions with both types of spinoff. Output from the estimation is presented below
Table 6 – The determinants of firm exit
Due to the non-linear nature on the model, we cannot directly interpret the coefficients as marginal effects. However, we can infer on the sign of the effect of each variable. Dependent Variable: Exit (1) (2)
Pushed Spinoff 0.059 (1.39) 0.054 (1.24)
Pulled Spinoff -0.232 (-5.32)*** -0.237 (-5.26)***
Same Industry×Pushed Spinoff 0.035 (0.95) 0.035 (0.96) Same Industry×Pulled Spinoff 0.227 (0.60) 0.023 (0.61) Median Tenure
Median Tenure×Pushed Spinoff -0.007 (-2.15)**
Median Tenure×Pulled Spinoff -0.001 (0.33)
Percentile 75×Pushed Spinoff -0.004 (-1.75)*
Percentile 75×Pulled Spinoff -0.001 (0.49)
Age -0.483 (-29.49)*** -0.048 (-29.47)***
Age2 1.438 (14.41)*** 1.438 (-14.41)***
Age × Pushed Spinoff -0.167 (-1.53) -0.167 (-1.53)
Age2× Pushed Spinoff 1.210 (1.69)* 1.223 (1.71)*
Age×Pulled Spinoff 0.430 (3.54)*** 0.430 (3.53)***
Age2× Pulled Spinoff -1.788 (-2.19)** -1.783 (-2.18)**
Log-Likelihood -140120.74 -141750.79
Number of Observations 544279 544279
21
The results above are consistent with the hypothesis that pulled spinoffs perform better than other firms. Within pulled spinoffs, however, there is apparently no effect on whether the spinoff diverts or not from the parent’s industry: the existence of industry specific
knowledge does not seem a key explanation for their survival pattern.
Regarding the pushed spinoffs, they do not differ significantly from the comparison group. Within pushed spinoffs, there is no evidence that those in the same industry as the parent have different exit risks than the others. While the other country level studies only control for whether the spinoff is in the same industry, not distinguishing between pushed and pulled operations for this purpose, their results show that being in the same industry has a positive effect on performance (although it dissipates over the years for Denmark (Eriksson and Kuhn (2006)). Our results do not support this hypothesis.
Regarding the median tenure of the cluster of workers in the parent firm, we only find an effect for the pushed spinoffs, for which this variable has a negative and significant sign. The results on this regard are qualitatively similar for several choices of the percentile in analysis, besides the ones reported in (1) and (2). The results are robust to several other specifications non-reported here, including interactions of entrant type the size of the firm, with measuring firm size according to different classes and using dummies for the age of each entrant instead of a quadratic firm. Given this, we find no evidence that the team experience effects mentioned earlier are relevant for determining performance, at least when we control for other characteristics of the workforce like education and human capital.
22
non-linear. The effects on the interaction terms with each type of spinoff should be interpreted with care. The fact that the coefficients for the pushed spinoffs are barely significant, and smaller in magnitude than those for pulled spinoffs, means that there is no significant additional effect of age on pushed spinoffs, when compared to other entrants, which is consistent with the unconditional hazards described in table 5, where age reduces exit risks for both pushed spinoffs and the base group. Conversely, for pulled spinoffs the coefficients are significant and have a comparable magnitude but a different sign than the effect of age without interactions. This suggests that the overall effect for this type of entrant will be close to zero, which is consistent with the relatively constant hazard rates observed in the descriptive statistics.
5. Discussion
23
The results obtained are in line with theories that suggest a better performance of spinoffs of better performing firms, both compared to other spinoffs and other startups. However, they do not allow us to strongly infer on whether that stems from industry specific knowledge or on pursuing ideas outside the core area of activity of the predecessor. In fact, if the forces that drive each of the hypothesis are present in our sample, none of them outweighs the other, so that there is no distinctive effect on whether a spinoff is or not in the same industry as its parent.
The persistence of initial differences in exit risks seems to be smaller, if any, in our case than for Denmark (Eriksson and Kuhn (2006) and Sweden (Andersson and Klepper (2009)). In fact, the authors find that, contrary to the unconditional estimates where there seems to be a convergence in exit risks, pulled spinoffs actually increase the gap to other entrants, while the opposite happens in our case.
Finally, one important hypothesis that we introduce in this context of country level studies is the possibility that, even after controlling for other determinants of experience and worker characteristics, the experience that the workers have together at the older firm may be relevant for performance. However, we only find weak evidence that, in the case of pushed spinoffs, this may have an effect on survival, suggesting that these kind of intangibles is not determinant for the performance of the spinoff.
Conclusions
24
the period of 1987 to 2008 and provide evidence that they are used by a small, but non-negligible, fraction of companies in our country. This assessment discusses the diverse events that the approach allow us to capture and shows that, within each of them, there is considerable heterogeneity regarding the scope of the operations. Firms may join forces for horizontal consolidation, acquire others in the same vertical chain or exploit the benefits or conglomerates. Similarly, when workers leave and found spinoffs those can be or not in the same industry. Finally, geographical information shows that roughly 10% of operations involve changes to a distant city which, added to the above motivations, shows that there are different drivers for these operations, each being a source of further study on itself.
25
References
Andersson, Martin and Klepper, Steven. 2013. “Characteristics and performance of new firms and spinoffs in Sweden.” Industrial and Corporate Change, 22:1, 245-280
Benedetto, Gary; Haltiwanger, John; Lane, Julia and McKinney, Kevin. 2007. “Using Worker Flows to Measure Firm Dynamics.” Journal of Business and Economics Statistics, 25:3, 299-313
Cassiman, Bruno and Ueda, Masako. 2006.“Optimal Project Rejection and New Firm Start-Ups.” Management Science, 52 (2), 262-275
Dahl, Michael S. and Reichstein, Toke. 2007. “Are you experienced? Prior Experience and the Survival of New Organizations.” Industry and Innovation, 14:5, 497-511
Eriksson, Tor and Kuhn, Johan M. 2006. “Firm spin-offs in Denmark 1981-2000 – patterns of entry and exit.” International Journal of Industrial Organization, 24, 1021-1040
Fink, Martina; Esther, Kalkbrenner; Weber, Andrea and Zulehner, Christine.
2010. “Extracting Firm Information from Administrative Records: the ASSD Firm Panel.” NRN: The Austrian Center for Labor Economics and the Analysis of the Welfare State, Working Paper 1004
Klepper, Steven. 2009. “Spinoffs: A review and synthesis” European Management Review, 6, 159-171
Muendler, Marc-Andreas; Rauch, James E. and Tocoian, Uana. 2012. “Employee spinoffs and other entrants: Stylized facts from Brazil.” International Journal of Industrial Organization, 30, 447-458
Okhuysen, Gerard A. and Becky, Beth A. 2009. “Coordination in Organizations: an
integrative perspective.” The Academy of Management Annals, 3:1, 463-502
Philips, D. J. 2002. “A genealogical approach to organizational life changes: the parent- progeny transfer among Silicon Valley law firms.” Administrative Science Quarterly, 47, 474-506
Pivetz, T., Searson, M., and Spletzer, J. 2001. “Measuring Job and Establishment Flows With BLS LongitudinalMicrodata,” Monthly Labor Review, 124, 13–20.
26
Appendix
Table A.1 – Size of Predecessor firms, by category
Rename
Merger or Acquisition
Pushed Spinoff
Reason Unclear
Pulled Spinoff
5-9 Employees 2244 2583 588 2184 140
10-49 Employees 1329 1843 1205 12007 975
50-249 Employees 171 304 209 8372 576
250 or more Employees 32 60 60 11408 349
Table A.2 – Size of Sucessor firms, by category
Rename
Merger or Acquisition
Pushed Spinoff
Reason Unclear
Pulled Spinoff
5-9 Employees 2218 1082 1134 2233 1011
10-49 Employees 1356 2456 802 12452 802
50-249 Employees 172 867 103 8467 187
250 or more Employees 30 385 23 10819 40
Table A.3 – Operations involving changes in City or District
Merger or Acquisition Pushed Spinoff Pulled Spinoff Change in
City
All 926 356 517
More than 40km 395 99 205
Change in District
All 428 123 253