A Work Project, presented as part of the requirements for the Award of a
Master
'
s Degree in Economics from the NOVA School of Business and
Economics
Poverty and Precarity in Portugal: A
Multidimensional Approach
Izaura Solipa Figueira Pires de Carvalho
701
A project carried on the Master's in Economics Program under the supervision of:
Professor Susana Peralta
Poverty and Precarity in Portugal: A
Multidimensional Approach
∗
Izaura Solipa Figueira Pires de Carvalho
†Abstract
This research assesses poverty levels in Portugal within a multidimensional ap-proach, over a period from 2008 to 2014. Further, it aims at inferring a causal relationship between precarious jobs and the estimated multidimensional poverty level. This research adds to the existing literature by applying a discrete choice experiment in the construction of the poverty index, as well as by finding causal-ity between poverty and precarcausal-ity. Empirical results suggest that, while multidi-mensional poverty levels are higher than the European Union poverty statistics, computed with relative income, precarity has a negative impact on the individual's wellbeing.
Keywords: multidimensional poverty, discrete choice experiment, precarity, propensity score matching.
”All human beings, irrespective of race, creed or sex, have the right to pursue both their material wellbeing and their spiritual development in conditions of freedom and dignity, of economic security and equal opportunity”
Declaration of Philadelphia, May 1994
∗My sincerest gratitude to Professor Susana Peralta, without whose guidance this work would never
have been possible. To my closest family and friends for all the support, contributions and caring. A special thanks to Fernanda Silva, Jorge Figueira, Gon¸calo Pessa and Inˆes Gon¸calves.
Contents
1 Introduction 1
2 Literature Review 2
2.1 Multidimensional poverty . . . 2
2.2 Precarity . . . 5
3 Data 7 4 Multidimensional Poverty Index 9 4.1 Indicators . . . 10
4.2 Discrete Choice Experiment . . . 11
4.3 Results . . . 13
4.3.1 Weights . . . 13
4.3.2 Multidimensional Poverty Index . . . 15
5 Determinants of poverty and the impact of precarity 17 5.1 Does precarity increase one’s multidimensional poverty level? . . . 19
5.1.1 Generalized Linear Model . . . 19
5.1.2 Propensity Score Matching . . . 20
5.1.3 Robustness . . . 21
6 Conclusion, Limitations and Further Resarch 22
List of Figures
1 AF Methodology: the matrix evolution process . . . 102 Orthogonal main effects plan for binary choices, using the foldover technique 12 3 What individual should receive more government support? . . . 12
4 Changes in M0 over time . . . 16
5 M0 by poverty cut-off . . . 16
6 AME of precarity on multidimensional poverty level . . . 19
7 ATT of precarity on multidimensional poverty level . . . 21
8 ATT of precarity on multidimensional poverty level . . . 22
List of Tables
1 Descriptive statistics - Indicators of Poverty . . . 82 Descriptive statistics - Poverty Determinants . . . 8
3 Index indicators, dimensions and vector weighting schemes . . . 14
4 Aggregate Results . . . 15
5 Multidimensional Vs Income Poor . . . 17
1
Introduction
Poverty is broadly measured according to a threshold below which an individual is poor if lacking sufficient resources to obtain an adequate standard of living (Lang, 2006). Falling into the wrong side of this dichotomy makes it harder for the individual to fully participate in the social, economic, cultural and political life of the community where she is inserted (Alves, 2009). The straightforwardness and lack of deniability of this concept do not make it easier to define, leaving many aspects that need to be outlined: Which resources should we consider? What best defines an individual's wellbeing?
The most common poverty measures are constructed upon income, which is easily im-plementable from an analytical and policy-making point of view, but nonetheless limited to the extent in which it identifies the poor. The old income paradigm as a sole indicator of wellbeing falls short on the observable: identifying the poor on the basis of their rela-tive current income approximates the capacity of the household to consume through the market but does not capture the degree of exclusion that they may suffer. Among other forms, exclusion can be felt through the limited access to public institutions, in particular to adequate schooling. It persists for a lifecourse and may be transmitted across gener-ations (Hulme and Shepherd, 2003), enhancing the necessity of overcoming the income paradigm.
This paper focuses on the dynamics of multidimensional poverty and precarious labour market conditions in Portugal, from 2008 to 2014, using the EU-SILC database. We implement a discrete choice experiment that allows us to elicit the relative importance of each factor used in the construction of the multidimensional poverty index. To the best of our knowledge, this is the first attempt to measure poverty in a multidimensional way in Portugal with such an approach. We shall pay special attention to the relationship between poverty and the labour market and address a possible causal relation between multidimensional poverty and precarity in labour
One of the main factors driving transitions in and out of poverty is employment (Bar-done and Guio, 2005). And if one is not born with considerable wealth, as is the case of the majority of individuals (Piketty, 2014), the only tool for guaranteeing an ade-quate standard of living becomes one's workforce. The existence of an inclusive labour market, with “adequate income support” and “access to quality services”, represents an essential condition for employment to be a sustainable and effective way of not falling in the poverty side (COM, 2008). When failing to exist, it is not surprising that work-ers are hit by poverty. The severe transformation of the labour market, with increasing lower tail wage inequality and fading of median class workers towards lower classes (Goos and Manning 2007), trap people in poorly paid jobs and hinders workers from escaping poverty.
The European Union (EU), in an attempt to address these issues, is promoting mea-surable goals to be attained by 2020, steered into national targets.1 The flagship initiative
for eradicating poverty, aiming at having at least 20 million fewer people at risk of poverty by the end of the period, was created so people experiencing poverty and social exclusion could be enabled to live in dignity and take active part in society (COM 2010). Regard-ing employment, the goal was set so that 75% of the workRegard-ing age population2 should
1
Europe2020: a 10-year job and growth strategy created by the European Commission. It includes targets for poverty, employment, education, R&D and climate and energy sustainability.
2
be employed, with a further agenda for new skills and jobs. The EU further addresses the importance of improving quality at work, reducing labour market segmentation and in-work poverty3(COM 2008). Nonetheless, despite all the recommendations, there have
been little focus, since its publication, on in-work poverty and labour market segmentation policies. The debate is dominated by how to enlarge chances of finding employment, over how to improve already existent employment quality. Proper job offers became scarce and more flexible forms of employment spread, in pair with a decrease of the individual's social protection (Soeiro, S´a Ferreira and Mineiro 2012). In other words, precarity, which we will later define as being related to these unprotected and flexible jobs, increased.
Portugal is no exception. If anything, it stands out as one of the Member States with higher levels of in-work poverty: according to Eurostat, this rate in 2008 reached 12%4 , approximately more 2.6 p.p. than the average for the 28 countries. Not only can
we observe high wage inequality among the population5, but also widespread low wages
combined with extensive low quality and insecure employment (Frazer and Marlier 2010), with evident prevalence on certain sectors of the economy. The risk of in-work poverty can be also greatly increased by factors such as education (Frazer and Marlier 2010), in which Portugal is particularly deprived. Data from 20146 reveals that 57% of the population
had less than upper secondary education, while the OECD countries averaged only 24%. The remainder of this paper is organised as follows. Section 2 briefly situates mul-tidimensional poverty and precarity in the literature. Section 3 introduces the analysis, divided in two subtopics: In the first topic, the methodology for multidimensional poverty measurement is described, and poverty levels for the discrete choice experiment estima-tion, as well as for additional robustness indexes, are analysed. The second topic entails the methodology for estimating the causal relation between multidimensional poverty and precarity, as well as the respective results. The latter subsection includes three different econometric approaches: a Generalized Linear Model, Propensity Score Matching and Coarsened Exact Matching. Section 4 concludes and section 5 presents the limitations and further research.
2
Literature Review
2.1
Multidimensional poverty
The accurate measurement of poverty is not a recent discussion, and contributions to this debate span the last decades. The standard unidimensional measures define poverty as falling below a certain income level – the poverty line –, below which an individual becomes incapable of achieving an adequate standard of living. According to the absolute poverty line7, poverty consists of not having enough resources to afford a basic
consump-3
Measured as the rate of income poverty risk among individuals who are employed for more than half the reference period. EU-SILC database.
4
In-work poverty rate for individuals with high work intensity. Data available in the web-site of the Eurostat http://ec.europa.eu/eurostat/web/products-datasets/-/ilc iw03
5
The remunerations earned by the 10% workers with highest wages is about 16,8 times the earned by the workers of the first decile of the distribution. Source: INE, ICOR 2010. Rodrigues et al. 2012.
6
Source: Education at a glance, OCDE 2015. Table A1.1a. Educational attainment – adult population (2014). Data available in OECD website
7
tion bundle.8 Relative poverty lines enrich this definition by adapting it to the national
standard of living – for instance, the EU poverty line for official statistics is set at 60% of the national equivalised median disposable income9 . Relative measures are able to
capture the degree of exclusion faced by individuals, by comparing them to their peers in the society. Yet, it is widely agreed that monetary resources do not accurately measure real poverty. Poverty is accepted as a multifaceted phenomenon, encompassing several needs that go far beyond income. Townsend (1979) exposes the nature of these needs, stating that not only are human beings physical, but also social, requiring a range of social expectations and responsibilities. The EU has explicitly taken this viewpoint into account, by extending the definition of poverty beyond relative income. It does so by combining relative income poverty (i.e. when the equivalised disposable income is below 60% of the national median), material deprivation (related to a severe state of economic strain, defined as the enforced inability to afford assets perceived as necessary or desired to an adequate life) and the low level of work-intensity of the household (obtained with the quotient between the total of months that a working age household worked over the total of months they could have work).
Multidimensional poverty conceptualization gained strength with Amartya Sen's al-ternative approach to welfare metrics, with poverty being thought of as a deprivation in the capability of having an adequate life. The capability approach10 (Sen 1985) focuses
on subjective wellbeing, defining it as the individual’s ability of achieving and having the freedom to choose the type of life she has reason to value, in terms of “beings and doings”11 , i.e., good health, loving relationships, education, healthy living environment,
etc. In principle, whenever an individual owns an endowment of capabilities that is large enough, she can escape poverty by choosing specific functionings.
Sen himself (1976) set the starting point to the empirical work, by postulating two core axioms to ensure the quality of the measurement: i)“a reduction in income of a per-son below the poverty line must increase the poverty measure” and i)) “a pure transfer of income from a person below the poverty line to anyone who is richer must increase the poverty measure”.12 Foster, Greer and Thorbecke (1984) built upon these axioms to
construct the FGT indexes, that respect Sen's assumption within certain parametriza-tions. The indexes include the headcount ratio (H), i.e., the fraction of population under the poverty line, the poverty-gap index (G), i.e. the aggregate distance to the poverty line of all the poor people in the population, and the squared poverty gap index (G2).13
They may be applicable to several dimensions of poverty, with each dimension having its own poverty line. Poverty in a multidimensional approach, whether measured byH,Gor
G2, is a weighted average of deprivations in each included dimensions, where the weight
8
Such as food, water, clothing, housing, sanitation, etc.
9
Total income of a household, after tax and other deductions, that is available for spending or saving, divided by the number of household members converted into equalised adults; household members are equalised or made equivalent by weighting each according to their age, using the modified OECD equiv-alence scale (value of 1 to the household head, of 0.5 to each additional adult member and of 0.3 to each child),Eurostat Statistics Explained.
10
The capability approach can be traced back to other authors such as Aristotle, Adam Smith and Karl Marx, despite having been popularized and underpinned by Sen. (Robeyns 2011).
11
Also referred to as functionings in Sen's seminal work.
12
Monotonicity axiom and transfer axiom.
13
Only the outputG2
represents the relative importance given to each dimension, in the overall measurement. Ever since, a fierce application of multidimensional theories that draw upon FGT indexes gained momentum. Bourguignon and Chakravarty (2003) studied poverty in Brazil by framing it as a “shortfall from a threshold on each dimension of an individual's wellbeing”, and assumed two dimensions: income and educational attainment. They observed that poverty tends to increase when more importance is given to education, i.e., when the weight of this attribute in the overall index increases. Other axiomatic analysis was performed by D'Ambrosio et al. (2009) within five European countries14 ,
extending the dimensions across which poverty is measured, beyond income, to ownership of financial and durable assets, quality of accommodation, health, social relations and satisfaction at work. Each dimension was given the same importance.15
But perhaps the main watershed for poverty measurement occurred with the inclu-sion of the Multidimeninclu-sional Poverty Index (MPI) in the set of official measures of the United Nations Development Program (UNDP), complementing the already existing Hu-man Development Index (HDI).16 MPI is a composite index based on the experimental
Alkire Foster (AF) methodology, which is defined as a counting measure constructed upon a dual cut-off identification method of poor individuals (Alkire and Foster, 2011). This index is, once more, a multidimensional generalization of the FGT indexes, equally weighting each dimension: education, health, and living standards. Worldwide develop-ing countries are covered by this analysis, showdevelop-ing that about 29% of the population is multidimensionally poor.17
While the latter indexes give the same relative importance to every included dimension, other studies consider a number of different techniques to set weights for multidimensional measures. These techniques include expert-based approaches, statistical methods such as factor analysis, or even, survey-based methods to elicit directly people's preferences. For instance, D'Ambrosio et al. (2009) further adopted a fuzzy set approach, in which each indicator receives a weight that is inversely proportional to its level of deprivation in the sample, later comparing these results to the equally weighted index.18 Watson et al.
(2008) illustrate the use of survey methods to derive weights given to each dimension in the UK's Index of Multiple Deprivation (IMD), by using a discrete choice experiment (DCE). Respondents within the UK were asked to make choices between two deprivation states, by stating the person who needs the most additional government support. The authors show that more weight is placed on housing and health, and less weight on employment, than the already implemented IMD. The use of DCEs has an extensive background in the field of health economics , however not very commonly used, to the extent of our knowledge, when measuring poverty.19
These multidimensional poverty indexes can be, similarly to income poverty measures, subject to a regression analysis that examines poverty determinants and infers possible causality relations. Alkire et al. (2015) suggest the use of a generalized linear model
14
Belgium, France, Germany, Italy and Spain
15
Verified in the axiomatic approach. The authors performed two other analysis – Information Theory and Fuzzy Set approach – in which the weights are not equal. These do not draw upon the FGT index.
16
Statistic summary of average achievement in key dimensions of human development: life expectancy, education, standard of living. Used to rank countries according to four tiers of human development
17
Data presented in the Human Development Report 2015: Work for Human Development,UNDP.
18
Results suggest that on average, 80% of the households defined as poor by two approaches are identical.
19
(GLM), given that it is able to account for the nature of the FGT indexes, while mod-elling their determinants. Likewise, D'Ambrosio et al. (2009) propose a logit estimation regression to better understand the determinants of poverty, computing the exact marginal impact of each explanatory variable through the Shapley decomposition procedure.20
At a national level, multidimensional poverty indexes are still not abundant21 .
Exist-ing measures include Alkire et al. (2016) and Rodrigues and Andrade(2010). Alkire et al. (2016) uses the AF methodology in the period of 2006 until 2012 to assess poverty levels. The analysis incorporated D'Ambrosio et al. (2009) indicators, except from the dimen-sions of social relationships and satisfaction at work. Portugal, paired with Greece and Bulgaria, is one of the poorest countries in the dataset and its levels of poverty increased steadily during the entire period. Rodrigues and Andrade (2010) also developed a mea-sure of multidimensional poverty for Portugal, in which monetary poverty coexists with material deprivation.22 The authors concluded that incorporating the concept of material
deprivation leads to a deeper understanding of what is poverty and which groups it affects the most: unemployed individuals, single parent households and extended households with children. Additionally, 10% of households above the poverty line are considered multi-dimensionally poor. To the best of our knowledge, no other multidimensional poverty measures for Portugal are available.
2.2
Precarity
As suggested by Paugam (2000), the contemporaneous forms of poverty are closely tied to the degradation of employment conditions in the labour market. Paugam's “new poverty” paradigm, defined within a multidimensional setting23 , is not only related with
unemployment, but also remits to the multiplication of highly precarious jobs and the emaciation of social ties. This degradation of the labour market submits the individuals to job insecurity, lack of career progression, insufficient payments, poor health and wellbeing, as well as social isolation (Ellis-Peterson, 2016). Poverty amongst the working class becomes, without surprise, a growing problem.
The attention towards labour market degradation has been rising amongst the academia and policy makers in the recent past. For instance, Goos and Manning (2007) study the increasing lower-tail wage inequality experienced by the UK in the 1980s and conclude that there is a growing number of workers with non-routine tasks, concentrated in both tails of the wage distribution. At the top of wage distribution we find mainly financial managers and engineers, while at the lower end, non-routine tasks are related to hardly substitutable services such as cleaners or hairdressers. This is in contrast with routine middling jobs, such as crossing keepers or labourers in foundries, which are declining with technological improvement, forcing some educationally overqualified workers to take the lousier jobs. The authors predict an “increasing polarization of the workforce into lousy
20
Let F(a, b, c) be any function depending on variables a, b, and c. The idea behind the procedure is to consider all the possible sequences allowing the elimination of variables a,b, and c, such that the marginal contribution of the excluded variable to the function is adequately estimated.
21
The literature regarding poverty measurement with income variables is much more extensive. See, e.g., Rodrigues(2007), Alves (2009), Arnold and Rodrigues (2015)
22
Referred to as consistent poverty
23
and lovely jobs”, fostering low remuneration24.
The same polarization is noted by O'Connell and Russell (2008), when monitoring job quality in Ireland between the early 1990s and 2004. There is little evidence, however, of the general deterioration of job quality: the incidence of involuntary part-time work is decreasing, as well as the volume of fixed term-contracts, unlike in the rest of the EU (Daly, 2010). As for Portugal, where the deterioration is more prominent, Baptista (2010) points out that “low salaries, low-qualified jobs, insecure labour relationships and the high proportion of atypical jobs” are immediate causes of in-work poverty, defined as having a job but yet belonging to a poor household. Additional reports on in-work poverty and labour market segmentation are available for other EU countries. Given the high correlation found between these two factors, national experts' reiterate the importance of ensuring good employment quality and proper remuneration in order to allow a decent living.
While economists have dealt with the lousy quality of jobs and the degradation of the labour market, they do not often refer explicitly to the notion of precarity. For the purposes of this work project, we shall borrow this definition from other social sciences. Precarity can hence be referred to working situations with unstable ties, peripheral jobs of the informal sector, illegal or undeclared. In other words, all the remunerated pro-fessional activities exerted outside legal and social protection (Soeiro 2015). Individuals face this atypical labour situation given its involuntary condition (Kov´acs, 2005), nor-mally attached to low income and increasing labouring hours (Santana e Centeno, 2000). Rosa et al. (2003) extend this definition by allowing for three different juridical forms of precarious work: i) fixed-term contracts, ii) temporary contracts and iii) false self-employment.25 While in i) the worker has a precarious contractual relationship directly
with her employer, and may be dismissed without any kind of indemnity, inii)the individ-ual, although working for a given employer, has a contractual relation with a temporary work agency (TWA), which intermediates the sale of her workforce and appropriates a share of her salary, and iniii) there is not even a contractual relation, since the individual, although being a common employee, is, in legal terms, a self-employed worker. The grow-ing relevance of these forms of precarious employment lays not only with this worrisome atypical26 and unprotected forms of employment, but with the pushing of middle class
workers into this phenomenon (Diogo, 2012), as also suggested by Goos and Manning (2007).
To mitigate these forms of precarious labour and the poverty associated, the EU advocates for the promotion of higher remunerations – including benefits – with increasing stability and social protection, namely for those on fixed-term contracts or self-employed (COM, 2008). Soeiro (2015) further suggests a tighter labour regulation, as well as a proper legal monitoring of the labour law's compliance, ensuring, on the one side, the effectiveness of already existing workers' rights within the employment contract, and on the other, the extinction of fraudulent precarious modalities, as is the case of false
24
The job-quality debate was also heated in the U.S., by economists such as Harrison and Bluestone (1988), arguing in line with the previously mentioned growth pattern in low-waged jobs. Other authors also focused on the job-quality and job polarization thematic, including Katz and Autor (1999) and Autor, Levy and Murnane (2003), studying the impact of technology on the labour market. Goos and Manning (2007) built up on this hypothesis.
25
In Portugal these forms became known as “false green receipts”.
26
self-employment. On a different line of thought, some authors, as Alesina and Giavazzi (2006), suggest that loosening labour market regulation, with e.g. the adoption of fixed-term contracts in all sectors of the economy would limit the segmentation of the market between unprotected and protected jobs. Relatedly, Centeno and Novo (2012), suggest that the existence of a protected group of permanent workers, as opposed to unprotected workers, reduces the general access to labour market and induces wrong incentives to workers and enterprises. The solution for segmentation would be the creation of a unique contract, envisioning a more flexible labour market.
Our work contributes to this already significant literature by i) analysing poverty within a multidimensional approach in Portugal, where the income analysis is still more predominant, ii) using a discrete choice experiment to assess the relative importance of each poverty dimension, as perceived by respondents,iii) establishing a causal relationship between the multidimensional poverty level and precarious labour conditions, enriching the already empirical work of in-work poverty and iv) contributing with an empirical result to the precarity debate among social sciences.
3
Data
The present research is divided into two parts. In the first, multidimensional poverty indexes are computed and compared to income poverty. We use a discrete choice ex-periment to assess the importance of each poverty component. The second part entails the analysis of the determinants of poverty, attempting to address the causal effect of precarity on multidimensional poverty. Precarious labour conditions are proxied by the existence of temporary or fixed-term work contracts, as well as employment on the more common sectors related with precarious work.
We use the European Union Statistics on Living and Income Conditions (EU-SILC), an annual EU-wide survey with individual and household level data on income, poverty, social exclusion and other living conditions. Pursuing the political and social agenda of the European Union, the survey was developed “precisely to compare deprivation and social exclusion across European Countries” (Alkire et al. 2016), becoming the reference source of key socio-economic comparative statistics of income distribution and social exclusion (Atkinson and Marlier, 2010). The cross-sectional samples for Portugal between 2008 and 2014 are used.
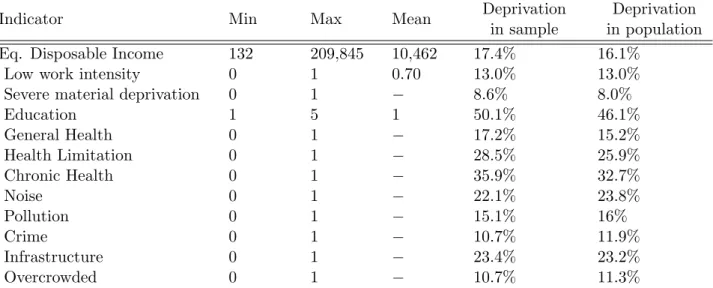
Table 1: Descriptive statistics - Indicators of Poverty
Indicator Min Max Mean Deprivation
in sample
Deprivation in population
Eq. Disposable Income 132 209,845 10,462 17.4% 16.1%
Low work intensity 0 1 0.70 13.0% 13.0%
Severe material deprivation 0 1 − 8.6% 8.0%
Education 1 5 1 50.1% 46.1%
General Health 0 1 − 17.2% 15.2%
Health Limitation 0 1 − 28.5% 25.9%
Chronic Health 0 1 − 35.9% 32.7%
Noise 0 1 − 22.1% 23.8%
Pollution 0 1 − 15.1% 16%
Crime 0 1 − 10.7% 11.9%
Infrastructure 0 1 − 23.4% 23.2%
Overcrowded 0 1 − 10.7% 11.3%
Note: Statistics computed from 2008 until 2014, using 78383 observations. Equivalised disposable income is presented in Euros. The correspondent relative poverty (income) line is 60% the mean. In Education, 1 refers to primary education and 5 to first stage of tertiary education and second stage of tertiary education. The mean of binary variables correspond to the deprivation in sample. All non binary indicators are later transformed into dummies. Deprivation measured in population accounts for the individualfls probability weight in the overall population (See footnote 38). The deprivation threshold for each indicator can be found in Table 3
Table 2: Descriptive statistics - Poverty Determinants
Variable Min Max Mean Total number of
ob-servations
Age 16 80 48 77,375
Male 0 1 0.485 77,383
Single adult 0 1 0.102 77,383
Immigrant 0 1 0.018 77,383
Urbanisation 1 3 2 77,383
Owner of dwelling 0 1 0.775 77,383
Household size 1 13 3 77,383
Temp./F.Term Contract 0 1 0.190 52,748
Occupation 0 1 0.449 68,537
Contract*Occupation 0 1 0.303 52,748
Note: Statistics computed from 2008 until 2014. Urbanisation is increasing with degree of remoteness, 1 being densely populated area, 2 intermediate area and 3 thinly populated area. Single adult refers to households with only one adult. More on the construction of the variables can be found in section 5.
individuals (Alkire et al. 2016)27.
4
Multidimensional Poverty Index
In this section we present our MPI. We have implemented a discrete choice experiment in order to construct the index, applying the AF methodology. The index evaluates a set of indicators, related to poverty dimensions, in order to assess the level of deprivation suffered by the individual. Each indicator has a poverty threshold and being deprived in such indicator is defined as falling below the respective threshold. Whenever total deprivation is higher than an overall poverty cut-off, the individual is identified as being multidimensionally poor. There are a number of important decisions that the researcher must take when computing a multidimensional poverty measure: unit of analysis i, in-dicators of wellbeing j and respective thresholds zj, that determine whether deprivation exists or not, weightswj reflecting the importance of each indicator relative to others, and the overall poverty cut-offk, indicating if the deprivations of the individual are sufficiently high for her to be considered poor. The resulting number of poor is given by q.
The method consists in building a sequence of matrices. The entire dataset is collected into an ntimesd achievement matrix, where each row i represents the unit of analysis, individual or household28, and each column represents a given indicator j. This matrixg
shows the achievements of each individual in the chosen indicators. We then use matrix
g to build matrix g0 by replacing its value as follows. If the individual's achievement in
indicator j falls short of the respective threshold zj, the observed value is replaced by the
user-defined weight, with
d
X
j=1
wj = 129 – in our case, survey-methods are used through
the implementation of our discrete choice experiment. When at the threshold or above, no deprivation is observed and the value is replaced by zero. The deprivation counts are obtained by an additional ci vector, that sums the deprivations experienced by i. This additional column allows us to identify the poor as the individuals with total deprivations above k, with 0 < k <1. The cut-off is defined exogenously, accordingly to the UNDP official measure, corresponding to k = 0.3330.
The third and final matrix, the censored deprivation matrix g0(k), builds up on this
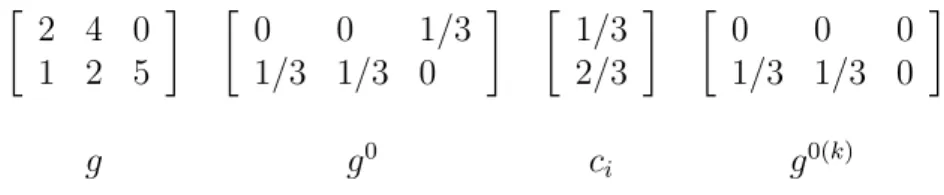
column vector ci and replaces each row of the deprivation matrix with zeroes if ci < k, indicating that the individual is not multidimensional poor. Whenever ci ≥ k, the row reflecting deprivation information is kept unchanged. An illustrative example, with two individuals and three indicators, is given in Figure 1, with thresholdszj ={2,3,1}, cut-off
k = 0.40 and w1 =w2 =w3 = 13 .
One of the main outcomes of this method is the Adjusted Headcount Ratio (M0)31 ,
27
Following Alkire et al. (2016), self-assessed indicators are included despite its limitations, given the extensive literature corroborating the use of EU-SILC.
28
The chosen unit of analysis for the present research is adult individuals, ranging from ages 16 upwards. From this point onwards, we will refer to unit of analysis as individuals.
29
Techniques to set weights include the previously mentioned expert-based approaches, survey-based methods and statistical methods
30
An individual is considered poor when she is deprived in one third of the indicators, i.e., if the items in which she is deprived, for example, material assets and education, represent more than one third of the several items chosen to measure poverty
31
Figure 1: AF Methodology: the matrix evolution process
2 4 0 1 2 5
0 0 1/3 1/3 1/3 0
1/3 2/3
0 0 0 1/3 1/3 0
g g0 ci g0(k)
which reflects both the incidence and intensity of poverty, while “explicitly capturing the joint distribution of deprivations” (Alkire et al. 2015). It can be expressed as H×A, the product between the headcount ratio H, i.e., the proportion of individual that are considered poor, and the average deprivation amongst the poor, A 32, where H = q/n,
and A=
n
X
i=1
ci
q. Their interpretation is straightforward: H indicates the percentage of
individuals in the population that is identified as being multidimensionally poor, due to being deprived in a given combination of indicators. Aindicates, on average, the amount of deprivation that poor people experience in the weighted indicators. The overall poverty measure, M0, adjusts the share of population that is multidimensionally poor by the
intensity of deprivation that they suffer. If all poor individuals were to be deprived in all indicators, there would not exist the need for such adjustment. Fortunately, this is rarely the case. The adjusted measure hence reflects the proportion of weighted deprivations that multidimensionally poor people experience in the overall population, out of all the total potential deprivations that it could experience (Santos et. al 2011).
4.1
Indicators
Our multidimensional poverty index borrows from the United Nation's MPI that combines a set of 10 indicators within three dimensions: Health (Nutrition and Child Mortality), Education (Years of Schooling and School attendance) and Living Standards (Cooking Fuel, Sanitation, Water, Electricity, Floor and Assets). Given that the MPI was developed to assess poverty in developing countries, indicators such as Child Mortality or Flooring
33 do not reveal adequate for Portugal. We thus have adjusted MPI in a number of
dimensions.
The first adjustment, following Alkire et. al (2016), takes into account the Euro2020 goals, incorporating income poverty, material deprivation and the low level of work-intensity that a working age household experience. 34
The second adjustment refers to the health and quality of accommodation dimension and follows closely D'Ambrosio et al. (2009). We use general health of the individual as well as her constraints in daily activities by any physical or mental health problem, illness or disability. Concerning quality of accommodation we include the following questions
and severity of poverty not captured by M0. These measures are significant when data is ratio-scaled,
however falling out of the scope of this index given the predominance of binary variables.
32
Also referred to as the intensity of poverty
33
Indicates deprivation if the “household has a dirt, sand or dung floor”, Multidimensional Poverty Index
34
from the EU-SILC data: Does the dwelling have a shortage of space?35 Does the
accom-modation have damp walls, floors, foundations? This dimension is extended by including neighbourhood amenities – violence, pollution and noise – following Alkire et al (2016). Finally, the threshold of education was augmented in order to assess if individuals have completed more than the primary education.
4.2
Discrete Choice Experiment
Our measures of multidimensional poverty in Portugal use a discrete choice experiment (DCE) to elicit the weights attached to each dimension, derived from the respondents'
preferences. 272 individuals were surveyed through an online survey, constructed following Watson et al. (2008) methodology.
The relative importance of the dimensions is assessed by requiring the respondents to make trade-offs between them. Dimensions comprise monetary income and ability to purchase material assets, education, health conditions, employment and quality of accom-modation.36 More specifically, respondents are asked to choose, between two individuals,
the one who should receive more government support, based on their attributes.
For binary attributes to be presented in choice sets of size two – individual A and individual B – we choose an orthogonal main effects plan that makes the profiles in the first option, and interchange the 0s and 1s to make the profiles for the second option. This interchange process is constructed by using the foldover of the first choice. The resulting pairs are optimal (Burgess, Street and Louviere, 2005). This design follows Burgess and Street (2005), satisfying the properties of an effective experimental design. Weights are afterwards computed from the marginal effects of a probit regression, where the dependent variable is a binary indicator of the chosen individual – 1 when A is chosen and 0 when B is chosen37. The independent variables correspond to the characteristics of the chosen
individual throughout all dimensions.
Figure 2 presents the orthogonal main effects plan that originated in the survey, and figure 3 shows an example presented to the respondents, based on the first choice set.
35
The shortage of space is defined following the EU-SILC variable “Overcrowded household”.
36
Instructions were given to the respondents so that the choice was clear a. E.g. The respondents were given following information, for qualify of accomodation: An individual with adequate accommodation lives in a house with piped water , access to public sewers , properly ventilated , without moisture problems or uncomfortable temperatures in winter and summer, without roofs leaking or rotted window frames. In addition, the surrounding area will reveal not persistent problems of crime, violence or excessive pollution.The presented information also allows for a more precise estimation of the dimensions’ weights.
37
Figure 2: Orthogonal main effects plan for binary choices, using the foldover technique
Note: A1 to A5 correspond to the characteristics of the individual along each chosen dimension
Figure 3: What individual should receive more government support?
In W4, all EU2020 indicators become an individual dimension, in a total of six. Lastly, W5 follows Cerioli and Zani fuzzy set approach (1990), proposing weights defined as
wj = logPn n
i=1 nixij
, with ni representing the weight attached to each individual in the
overall sample 38 and Pn
i=1 ni = n. xij = 1 iff the ith individual is deprived in the jth
indicator,xij = 0 iff not. Weights become an inverse function of the degree of deprivation of attribute j by the population of the sample. The described weighting schemes and respective indicators and dimensions are shown in the section below 39.
4.3
Results
4.3.1 Weights
Table 3 sets out the estimated weighting schemes, with respective indicators and dimen-sions from the EU-SILC database. We propose the estimation of a weighting scheme derived from personal preferences in DCE, whilst the remaining vectors of weights follow previous literature computations, as described in section 4.2.
The socioeconomic characteristics of the individuals in the collected sample of our DCE do not accurately represent the Portuguese population. In an attempt to correct for the lack of representativeness, data on population per age group and gender, from Census 2011, is used to calibrate each response. The most underrepresented group refers to male individuals over 65 years old, while on the other extreme, individuals between 18 and 25 years old, both male and female, are the most overrepresented of the sample. The calibration effect is small, slightly changing the importance given to each indicator.
When comparing our DCE estimates with the estimates of W4 weighting scheme 40,
monetary and material deprivation, reflecting the main concern of the respondents, have the highest similarity. The relatively higher weights of DCE on quality of accommoda-tion and housing may result from emotiveness on the subject, while the lower weight on employment is likely to reflect the importance given on disposable income from subsi-dies or rents. Education comprises the most noteworthy difference, with its extremely low marginal effect, proved to be not statistically significant. Once poverty is taken into account, the negative impact of not being educated is not a significant problem for the respondents of the survey. Given the extremely low educational levels of the Portuguese population, the previous result is not surprising. Different perceptions of the education importance towards poverty reduction can be found in Watson et al. (2008), where it receives a weight of 12%, highlighting that people's perceptions are highly influenced by the surroundings. While in Portugal, 46,1% of the population only has the primary edu-cation, UK presents 47,6% of its population having an educational level corresponding to secondary education or higher 41.
38
Equivalent to n times the relative frequency of each individual in the total population. Constructed by using each individual's cross-sectional weight, probability weights where observations have a different probability of being sampled. Each observation will be weighted by the inverse of its probability of being sampled (Dupraz, 2013).
39
Table 2
40
Chosen given the similarity of the number of dimensions.
41
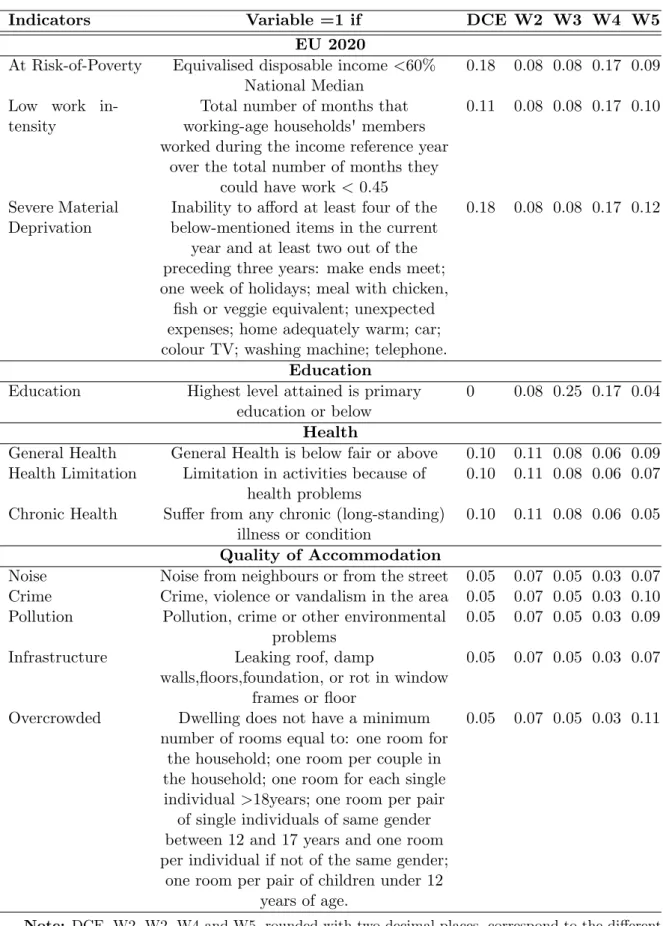
Table 3: Index indicators, dimensions and vector weighting schemes
Indicators Variable =1 if DCE W2 W3 W4 W5
EU 2020
At Risk-of-Poverty Equivalised disposable income <60% National Median
0.18 0.08 0.08 0.17 0.09
Low work in-tensity
Total number of months that working-age households'members worked during the income reference year
over the total number of months they could have work <0.45
0.11 0.08 0.08 0.17 0.10
Severe Material Deprivation
Inability to afford at least four of the below-mentioned items in the current
year and at least two out of the preceding three years: make ends meet; one week of holidays; meal with chicken,
fish or veggie equivalent; unexpected expenses; home adequately warm; car; colour TV; washing machine; telephone.
0.18 0.08 0.08 0.17 0.12
Education Education Highest level attained is primary
education or below
0 0.08 0.25 0.17 0.04
Health
General Health General Health is below fair or above 0.10 0.11 0.08 0.06 0.09 Health Limitation Limitation in activities because of
health problems
0.10 0.11 0.08 0.06 0.07
Chronic Health Suffer from any chronic (long-standing) illness or condition
0.10 0.11 0.08 0.06 0.05
Quality of Accommodation
Noise Noise from neighbours or from the street 0.05 0.07 0.05 0.03 0.07 Crime Crime, violence or vandalism in the area 0.05 0.07 0.05 0.03 0.10 Pollution Pollution, crime or other environmental
problems
0.05 0.07 0.05 0.03 0.09
Infrastructure Leaking roof, damp
walls,floors,foundation, or rot in window frames or floor
0.05 0.07 0.05 0.03 0.07
Overcrowded Dwelling does not have a minimum number of rooms equal to: one room for
the household; one room per couple in the household; one room for each single individual >18years; one room per pair
of single individuals of same gender between 12 and 17 years and one room per individual if not of the same gender;
one room per pair of children under 12 years of age.
0.05 0.07 0.05 0.03 0.11
4.3.2 Multidimensional Poverty Index
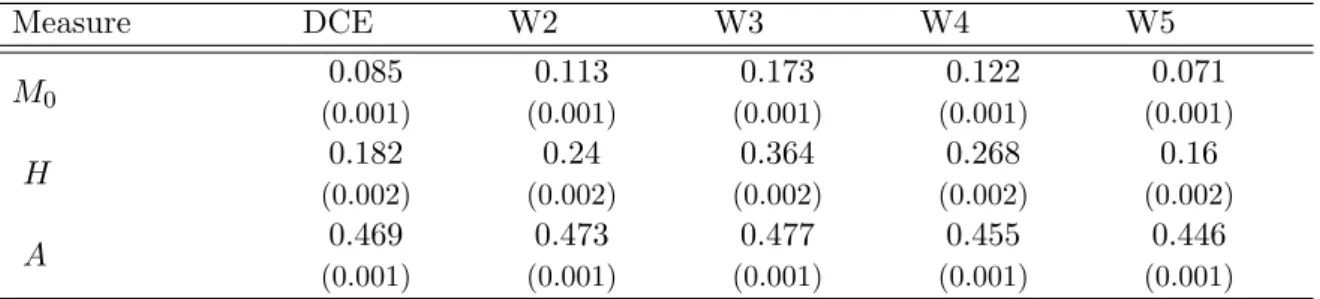
The overall poverty measures for the five weighting schemes are described in table 4. According to our DCE estimates, roughly 18% of the Portuguese population 42 between
2008 and 2014 is multidimensionally poor, representing an increase of around 12% in the number of poor individuals for the same period, when compared with income poverty. On average, these poor individuals are deprived in 47% of the weighted indicators, and overall population is deprived in 8.5% of the potential deprivations it could experience. The most important individual factor driving the results is income poverty, while the most important group of indicators is health, which accounts for almost half of the overall contribution. Quality of accommodation accounts for the lowest share of contributions .
Table 4: Aggregate Results
Measure DCE W2 W3 W4 W5
M0 0.085
(0.001) 0.113 (0.001) 0.173 (0.001) 0.122 (0.001) 0.071 (0.001) H 0.182 (0.002) 0.24 (0.002) 0.364 (0.002) 0.268 (0.002) 0.16 (0.002) A 0.469 (0.001) 0.473 (0.001) 0.477 (0.001) 0.455 (0.001) 0.446 (0.001)
Note: Standard errors are in parenthesis, all significant at a 5% confidence level. Aggregate results between 2008 and 2014 comprise H, A and M0. H refers to the headcount ratio of the
poor, A to the average deprivation suffered by the poor, andM0 the adjusted headcount ratio
=AH DCE, W2, W2, W4 and W5 correspond to the different vector weighting schemes applied in the construction of the index, defined in section 4.2.
Comparing our main results to those of W4, the percentage of multidimensionally poor individuals increases almost 9 p.p., to a figure of 26.8%. On average, these poor are deprived in 46% of the weighted indicators, and overall population is deprived in 12% of the potential deprivations it could experience. This increase is expected, given the incorporation of education as a statistical significant indicator, which becomes the principal contributor to the poverty measure, with 31% of overall contribution. 43 Further,
the level of poverty is lower in W5 and considerably higher in W3. While W5 attributes the lowest weights to those indicators with the higher level of deprivation, W3 encompasses the highest weight given to education, 25%, by lowering the importance given to the EU2020 indicators. 44 W2 and W4 have very similar results, although the latter exhibits
relatively higher poverty levels. This can also be observed in Figure 4, decomposing M0
across the years under analysis. According to the remaining weighting schemes, there is a significant increase between 2008 and 2014, with W2 revealing the highest increase, in the order of 18%. A similar pattern between our DCE index and both W2 and W4 is observed, with a slight increase until 2010, followed by decreases in the two subsequent
42
We refer to overall population instead of overall sample given that the indexes incorporate the pro-portional weight function. See footnote 38
43
Comparing with DCE, contribution of the AROP indicator in W4 remained similar, while the con-tribution for “Health” dimension reduced more than half. W2, on the other hand, has a very low contribution of income poverty, while health contributes almost 52%. The magnitude of contributions reflects both the importance given to each indicator and its deprivation level.
44
Figure 4: Changes inM0 over time
years. The highest value is transversely achieved in 2014. These dynamics are mainly influenced by changes in the number of poor individuals, while poverty intensity remains relatively stable. For the indexes that include education, the relative contribution of this indicator declines pairwise to the increases in multidimensional poverty levels, remitting to the importance of addressing poverty within multi deprivations (Alkire et al. 2016).
Figure 5 further analyses the differences in these poverty levels when submitted to stricter definitions, by changing the cut-off parameter with 10% increments. As expected, when k becomes near the integer - reflecting the most extreme form of deprivations in this model – poverty is reduced to 0. When applying more loose measures than the official, the adjusted headcount ratio can go up to 20% 45. W4 reveals the slower reduction,
possibly reflecting the higher weight in education, as opposed to DCE, which lacks this indicator. However, there is once more a similar pattern between the DCE index and those of previous literature, W2 and W4.
Figure 5: M0 by poverty cut-off
Finally, the three indexes are consistent with the argument of standard income mea-sures underestimating poverty. Additional to the 12% increase in the number of multidi-mensionally poor using DCE estimates, W2 and W4 result in 22808 and 20228, respec-tively, of multidimensionally poor individuals throughout the years - also higher than the
45
13494 income poor46. Despite the fact that the different magnitude of increases is related
to the choice of indicators and respective weights, there is an intensification of poverty throughout all indexes, in line with the importance that non-income measures have on the individual's wellbeing.
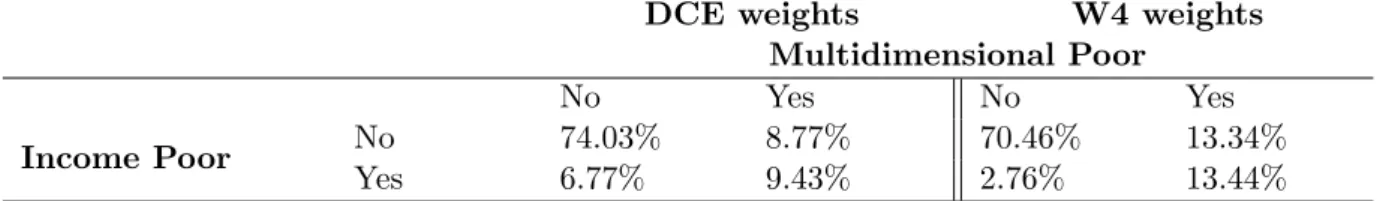
Table 5 compares, for both DCE and W4 weighting estimates, the proportion of in-dividuals that are both income and multidimensionally poor, those who fall only into one category, and those who are neither. We can observe that, for DCE, 6.77% of the overall population is only income poor, while having a more adequate standard of living, whereas about 8.77% is considered to be deprived in other dimensions of wellbeing than the monetary.
Table 5: Multidimensional Vs Income Poor
DCE weights W4 weights Multidimensional Poor
No Yes No Yes
Income Poor No 74.03% 8.77% 70.46% 13.34%
Yes 6.77% 9.43% 2.76% 13.44%
Note: Statistics computed with probability weights of sample
The analysis that follows is performed using W4 weighting scheme, given that encom-passes nested weights, while attaching higher weights to EU2020 goals and education than W2. Despite the focus of the present section being given to the index constructed upon the DCE estimated weights, the choice of W4 was drawn upon Atkinson et al. (2002), in which policy interpretation is said to be greatly eased when indicators are roughly equal in weights, as well as in Foster et al. (2012), whose results conclude in favour of the robustness of Human Development Index in its traditional version as an equally weighted composite index. The low work intensity indicator was dropped from the construction of multidimensional poverty, in order to include work-related variables on the right side of the regressions.47
5
Determinants of poverty and the impact of
precar-ity
The present part of the research focuses on analysing precarity labour conditions, while modelling poverty determinants, by using the GLM fractional logit. The analysis is suit-able when the dependent varisuit-able varies between 0 and 1, offering a much more plausible estimate of the partial effects for the logit model than linear models. 48 (Papke and
Wooldridge, 1996) Estimations are performed using the binomial family. In order to
as-sess possible transmission mechanisms between poverty and policy measures, we perform a GLM regression analysis where the dependent variable is the deprivation score assigned
46
At a sample level. Measured by the equivalised disposable income, whenever below the poverty line.
47
The indexes with and without low work intensity are, however, very similar, resulting in a residual change in the number of multidimensionally poor (only a 2 p.p. increase relative to the overall sample).
48
to each individual. The covariates can be regional-level characteristics, such as the re-moteness of urbanization, demographic characteristics of the household, such as size or age structure, as well as socioeconomic characteristics of the individual (World Bank In-stitute, 2005). Education and Health related variables are transversely used as exogenous variables when modelling income poverty, however they create an endogeneity problem if we apply them in the context of multidimensional poverty. Given that these variables are directly used in the construction of the dependent variable, one possible approach for fixing this issue is to restrain the explanatory variables to measurement variables not part of the indicator vector used as the dependent variable, as well as adding further socioeconomic characteristics of the individual (Alkire et al., 2015). Following Haughton and Khandker (2009) and FAO Vietnam (2002), the included explanatory variables are as follows: Age, Age2 49 , gender, degree of urbanization 50 , tenure status 51 , the
indi-viduals household size and type. 52 A dummy indicating whether or not the individual
is immigrant was also included, given the increasing relation of low-income status with immigrant groups (Blume et al., 2005). The variables that proxy precarity are included separately.
In the first regression, a dummy that accounts for the existence of temporary or fixed-term contracts, following Soeiro(2015) and Rosa et al.'s (2003) definition is included.53
In the second, a dummy54 was created and incorporated, reflecting the occupation of
the working individual that is empirically tied to precarious conditions. To define such occupations, we follow Goos and Manning (2007), Carvalho (2008), Diogo (2012) and An-tunes (2008). Goos and Manning (2007) describe the lousy job condition mainly as service occupations. According to the authors, the lousiest jobs are occupations such as bar staff, shelf fillers, sales assistants, retail cash desk, checkout operators, waiters, waitresses and beauticians. Additional low-paid jobs are related to care, education and medical assis-tance. According to Carvalho (2008), precarious occupations also include the agricultural, fishery and civil construction activities, cleaning and domestic services. Highlights are given for bricklayers, construction workers, garbage removals workers, cleaning or domes-tic housekeeping, fisherman, agriculture and drivers (Diogo, 2012). Further occupations relate to where the new precarious modalities of work arise, such as the call-centre and
49
Age2
is introduced given that this relationship may not be linear; Youngsters and elders tend to be more affected by poverty.
50
Describes the density of population in the individuals area. A variable that takes the value 1 if the individual lives in a densely populated area, the value 2 for an intermediate area, and the value 3 for a thinly populated area.
51
Describes whether the individual lives in an accommodation where the owner is a member of the household
52
According to the Eurostat statistics, poverty is more severe for single adult households. A dummy variable was computed, indicating if there is only one adult in the household. Includes one-person household and single parent household: incidence of multidimensional poverty tends to affect more the one adult households.
53
The false green receipts (Rosa et al., 2003) will not be included, given the increasing difficulty in discovering and accounting for. Statistics on EU-SILC do not capture this dimension.
54
telemarketing workers, motoboys, workers of the fast food industry and supermarkets. (Antunes, 2008).
Finally, the third regression includes another dummy variable, which is an interaction between the two dummies previously mentioned. Yearly fixed effects are included, as well as robust standard errors for the fractional logit, particularly useful if the distribution family is misspecified.55
5.1
Does precarity increase one’s multidimensional poverty level?
5.1.1 Generalized Linear Model
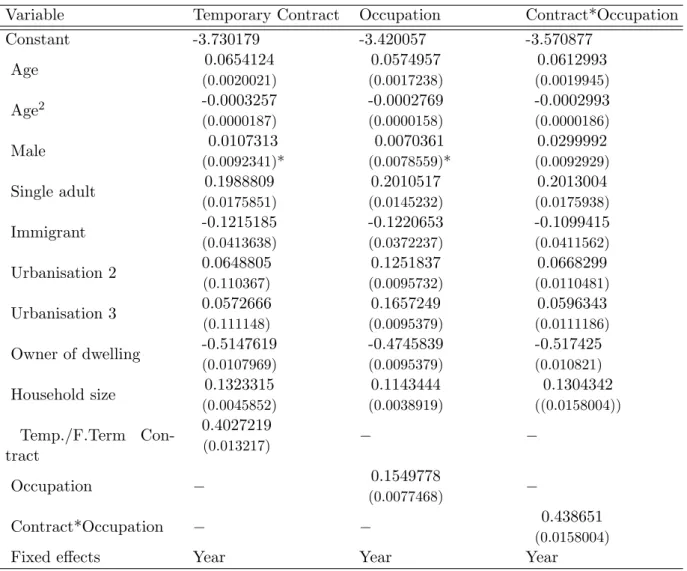
The results for the fractional logit estimation are shown in Table 7. The signs for the regional level and socio-economic covariates are consistent with the literature. For in-stance, owning a house, even if paying mortgages, is found to reduce the probability of an individual being multidimensionally poor. Immigration, however, has a positive impact on poverty, different to Blume et al. (2005) hypothesis. Looking into the variables of interest, which take into account the type of contract and the individuals' occupational sector, one can see that, in all three regressions, these precarity variables are found to increase the probability of falling into multidimensional poverty.
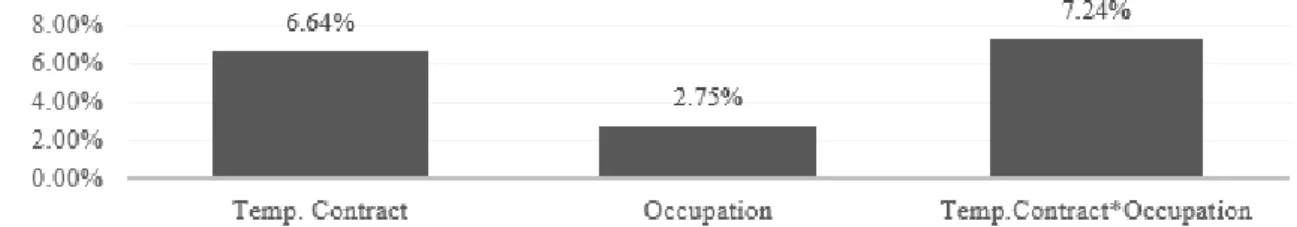
Average marginal effects (AME) for these three dummies variables are presented in figure 6, showing how the probability of having higher deprivation scores, i.e. to be multidimensionally poor, increases as these change from 0 to 1. Despite all variables having positive AME, individuals who work in the most precarious sectors while having a temporary or fixed-term contract show the highest probability.
Figure 6: AME of precarity on multidimensional poverty level
55
Table 6: GLM regression estimates on deprivation scores
Variable Temporary Contract Occupation Contract*Occupation
Constant -3.730179 -3.420057 -3.570877
Age 0.0654124 (0.0020021) 0.0574957 (0.0017238) 0.0612993 (0.0019945)
Age2 -0.0003257
(0.0000187) -0.0002769 (0.0000158) -0.0002993 (0.0000186) Male 0.0107313 (0.0092341)* 0.0070361 (0.0078559)* 0.0299992 (0.0092929)
Single adult 0.1988809
(0.0175851) 0.2010517 (0.0145232) 0.2013004 (0.0175938) Immigrant -0.1215185 (0.0413638) -0.1220653 (0.0372237) -0.1099415 (0.0411562)
Urbanisation 2 0.0648805
(0.110367)
0.1251837
(0.0095732)
0.0668299
(0.0110481)
Urbanisation 3 0.0572666
(0.111148)
0.1657249
(0.0095379)
0.0596343
(0.0111186)
Owner of dwelling -0.5147619
(0.0107969)
-0.4745839
(0.0095379)
-0.517425
(0.010821)
Household size 0.1323315
(0.0045852) 0.1143444 (0.0038919) 0.1304342 ((0.0158004)) Temp./F.Term Con-tract 0.4027219
(0.013217) − −
Occupation − 0.1549778
(0.0077468) −
Contract*Occupation − − 0.438651
(0.0158004)
Fixed effects Year Year Year
Note: Robust standard errors are in parenthesis. ∗ means not statistically significant at 10%. Ur-banisation dummies are increasing with degree of remoteness, 2 being intermediate area and 3 thinly populated area.
5.1.2 Propensity Score Matching
Given the possible loop causality between multidimensional poverty and precarity, as precarious labour conditions may result from a set skills and preferences that lead the individual into poverty, endogeneity may arise, hindering us to draw correct inferences. One method used in policy evaluation literature that allows causality assessment, while tackling endogeneity, is the Propensity Score Matching (PSM). Authors such as Barbieri and Bozzon (2016) apply this method to the EU-SILC database, in order to assess families'
risk of entering poverty as a consequence of childbirth in four EU welfare clusters. Fessler et al. (2013) exploit this alternative, studying the effect of interview modes56on estimates
of economic inequality, based in the Austrian EU-SILC panel. Although no literature was found that analyses the specific multidimensional poverty paradigm with such approach,
56
we believe there is common ground in previous studies that corroborates the validity of our choice.
This statistical experiment creates two comparison groups, participants and non-participants, based on the probability of participating in the “program”. Participants refer to the pool of individuals that are considered precarious, whereas non-participants refer to those that have a proper job. Each individual from one group is compared to the other, based on the closest propensity for being precarious. The intuition behind the experiment is that, given similar propensity scores, the precarity status of the treated in-dividual is due to randomness, and one can attribute differences in the poverty level of the individuals to the fact that one is precarious and the other is not. The application of this analysis requires that the balancing assumption is verified: treatment observations must have comparison observations close to the propensity score distribution. Observations with weak overlap should be dropped (Heckman et al., 1997), given that causal inferences can only be made in the region of common support.57
The propensity scores are estimated at a 5% confidence level and matching between participants and non-participants is made through the nearest-neighbour with replace-ment.58 This methodology follows Becker and Ichino (2002) application, allowing for
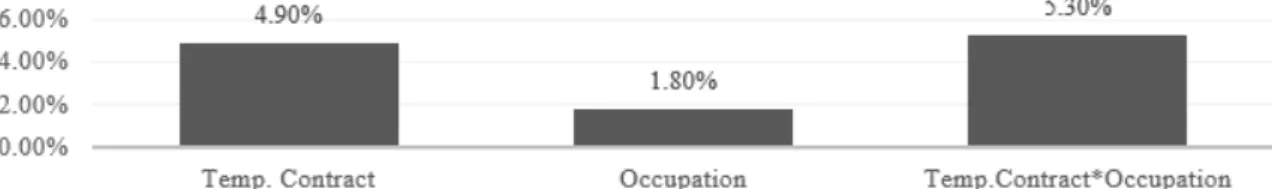
the estimation of the average treatment effect (ATT), i.e., the mean difference of the two groups' outcomes. Figure 7 presents the ATT for all regressions, in line with the fractional logit, confirming that individuals with precarious jobs are more likely to have higher deprivation scores than those who have a lovelier job. Individuals that have a temporary or fixed-term contract in one of the sectors of the economy more intimately related to precarity also reveal the higher effect, being, in this case, 5.3% more likely to be multidimensionally poor.
Figure 7: ATT of precarity on multidimensional poverty level
5.1.3 Robustness
As suggested by King et al. (2011), other matching techniques59should be used for
robust-ness of the PSM, whenever this method is chosen to fit theoretical requirements. While PSM fixes the matched sample size when attributing the propensity scores, attempting to reduce the imbalance afterwards, the proposed method – Coarsened Exact Matching (CEM) - fixes the imbalance previously, while attempting to lose as few observations as possible ex-post. The latter method eliminates the need of restricting data to a common
57
The covariate urbanisation was dropped from the common support area. The procedure dropped observations when fixing the matched sample size ex ante. Near 20 000 observations remained.
58
Each treatment unit is matched to the comparison unit with the closest propensity score (Khandker et al. 2010). The same non-participant can be used several times for matching different participants.
59
empirical support, increasing the number of observations used. Errors in the estimation of the average treatment effect are bounded and the amount of model dependence is reduced (Iacus, King and Porro 2008).
CEM fixes the imbalance by temporarily coarsening each of the chosen variables.60
Units with the same coarsened values for all the variables are placed in the same stratum. Control units are posteriorly weighted61 to match the number of treated units within each
created stratum.62 The estimator for the causal effect is given by a simple “difference in
means” between the outcome in the treated and in the control group. This is obtained by using a regression model63with the uncoarsened data from matched observations, however
applying the respective weights computed from the matching technique (Blackwell et al. 2010).
Figure 8 presents the ATT of being precarious in the individual's multidimensional poverty level, confirming all the previous results. The results show, once more, that if an individual has a temporary or fixed-term contract, her probability of being multidi-mensionally poor increases. The effects of precarity increase in the specific sectors of the economy more related to the lousiest conditions and reduced social protection.
Figure 8: ATT of precarity on multidimensional poverty level
6
Conclusion, Limitations and Further Resarch
This research analyses poverty in Portugal from 2008 to 2014, within a multidimensional perspective, not only to assess poverty levels, but to understand the impact of some of its determinants. More specifically, it aims at inferring how precarious labour conditions influence the probability of being poor.
On poverty analysis, we add to the existing literature by setting a multidimensional poverty framework whose dimensions’ importance are assessed through an experiment based on a discrete choice survey. This study is the first we are aware of which addresses the causal relation of precarity with multidimensional poverty.
60
Indistinguishable values are grouped and assigned the same numerical value (Iacus, King and Porro 2011). For example: age into groups, instead of exact birthdays; educational level into grade school, high school, etc.
61
Treatment units receive a weight of 1, unmatched units receive a weight of 0. The weights for the control units are equal to the normalized quotient between the number of treated and control units within each stratum.
62
The strata must observe at least one unit of control and one unit of treated, in order to be included in the data set.
63
In line with the results of other multidimensional approaches, income poverty was found to underestimate real poverty. The higher levels observed by the multidimensional poverty indexes reaffirm the necessity of shifting poverty measurements beyond mone-tary analysis, by incorporating additional concepts of wellbeing. Our research extends this unidimensional analysis by focusing on education, health, quality of accommodation, material deprivation and employment. A discrete choice experiment (DCE) assessing the respondents'preferences is used to estimate the relative importance given to each dimen-sion, while further weighting schemes are included for comparability. For most indicators, there was a degree of similarity between nested weights, used in the construction of the official poverty index for developing countries – MPI – and the ones obtained from the DCE. While presenting inferior poverty levels than the remaining indexes included in the analysis, the DCE based index is still in line with the findings of the literature.
The determinants that impact multidimensional poverty were also hypothesized as in the previous literature. Being older, belonging to a household with just one adult, whether unipersonal or with children, belonging to a bigger household, getting away from the urban centre, being male64 and not owning a house, all seem to increase the
probabil-ity of being multidimensionally poor. Precarious labour conditions further increase this probability and a causal relationship is found. If not only related with lower salaries and thus higher income poverty, lousy job conditions are shown to increase the individual's probability of being multidimensionally poor, whether through having fixed-term or tem-porary contracts, working on specific sectors of the economy usually scarcely protected, or, more importantly, through the combination of both. We conclude that multidimensional poverty amongst workers increases whenever working conditions are precarious.
These are very relevant results and propound that policy makers should draw attention towards the improvement of the general quality of employment as an effective channel to reduce poverty. Such improvement, the results suggest, could be prosecuted with policies that extend social protection to some of the most precarious jobs of the economy65 while
decreasing the flexibility of the labour market, through reducing temporary and fixed-term contracts to the minimum necessary. By revealing that precarious workers tend to share a set of lower living standards conditions, these results provide a further analytical contribution to the debate among social sciences over precarity and its implications.
Although an attempt of a seminal contribution to the study of multidimensional poverty and its relation with precarity is sketched, some limitations on the methodol-ogy applied ought to be remarked.
An important limitation resides in the undesired subjectivity of data which its nature implies. As mentioned, some variables are self-reported, prone to measurement error and possibly leading to overstated poverty levels. Data retrieved from the DCE also encompasses some caveats, given that it was not possible to correct for all socioeconomic characteristics of the respondents. Furthermore, the lack of available data on issues such as individual's autonomy may lead to an underestimation of real poverty, even when using multidimensional measures. The indicators used in the construction of the index may not fully reflect all capabilities, as framed by Sen (1976).
64
Contrasting with previous literature, where being a female generally increases the probability of being poor.
65
An additional limitation relates to the choice of PSM. As in almost every not in-vitro experiment, unobservable characteristics may influence the propensity for receiving treatment, in our case being precarious, thus leading to biased results. Further problems are associated, such as the Propensity Score Paradox, in which imbalance increases as more observations are dropped (King et al. 2011). Despite the recognition of PSM application problems, we believe that the use of CEM deeply strengthens our analysis, by mitigating the referred situations and hence allowing a robust causality inference.
Further developments of the research on these issues ought to overcome, if possible, the limitations mentioned above. Extended studies could combine our statistical and econo-metric analysis with the subjective living of multidimensional poverty, in order to assess how, in the speeches and individual representations, poverty is thought of and managed in the poor's everyday life. Furthermore, the extension of the available data so as to cover further and more thorough deprivation indicators, following Banco de Desarrollo de America Latina and Oxford Poverty & Human Development Initative (OPHI) missing variables work (2015), would be important to increase the measurement accuracy. These variables include control and autonomy over own life, value of relations and social connec-tions, as well as psychological wellbeing – happiness and a meaningful life. OPHI already designed questionnaire modules to be integrated in national household surveys, so that these missing dimensions can be fully incorporated in multidimensional poverty analysis.
References
[1] Alesina, A., Giavazzi, F. 2006. “The Future of Europe: Reform or Decline” MIT Press
[2] Alkire, S., Foster, J. 2011. “Understandings and Misunderstandings of Multidimensional poverty measurement” OPHI Working paper no. 43
[3] Alkire, S., Apablaza, 2016. “Multidimensional poverty measurement in Europe: 2006-2012: Illus-trating a Methodology” OPHI working paper no.74
[4] Alkire, S. Foster, J.E., Seth, S., Santos, M.E., Roche, J.M., Ballon, P. 2015. “Multidimensional Poverty Measurement and Analysis” Oxford University Press Alves, N. 2009. “Novos factos sobre a pobreza em Portugal” Boletim Econ´omico Primavera 2009, Banco de Portugal
[5] Antunes, R. 2008. “Desenhando a nova morfologia do trabalho: as m´ultiplas formas de degrada¸c˜ao do trabalho”. Revista Cr´ıtica de Ciˆencias Sociais no. 83
[6] Arnold, J., Rodrigues, C.F. 2015. “Reducing Inequality and Poverty in Portugal” OECD Economics Department Working papers no. 1258
[7] Atkinson, A., Marlier, E. 2010. “Income and living conditions in Europe” Eurostat Statistical books
[8] Banco de Desarrollo de America Latina and Oxford Poverty & Human Development Initative. 2015. “Las dimensiones faltantes en la medici´on de la pobreza” Corporaci´on Andina de Fomento
[9] Baptista, I. 2010. “Portugal: In-work poverty and labour market segmentation. A study of national policies” European Commision
[10] Barbieri, P., Bozzon, R. 2016.“Welfare, labour market deregulation and households poverty risks: An analysis of the risk of entering poverty at childbirth in different European welfare clusters”, Journal of European Social Policy, vol. 26 no. 2