Atmos. Chem. Phys., 14, 2015–2038, 2014 www.atmos-chem-phys.net/14/2015/2014/ doi:10.5194/acp-14-2015-2014
© Author(s) 2014. CC Attribution 3.0 License.
Atmospheric
Chemistry
and Physics
Open Access
Comparison of MODIS 3 km and 10 km resolution aerosol optical
depth retrievals over land with airborne sunphotometer
measurements during ARCTAS summer 2008
J. M. Livingston1, J. Redemann2, Y. Shinozuka3,4, R. Johnson2, P. B. Russell2, Q. Zhang3,4, S. Mattoo5,6, L. Remer7, R. Levy5, L. Munchak5,6, and S. Ramachandran8
1SRI International, Menlo Park, California, USA
2NASA Ames Research Center, Moffett Field, California, USA 3NASA ARC-CREST, Moffett Field, California, USA
4Bay Area Environmental Research Institute, Sonoma, California, USA
5Earth Science Division, NASA Goddard Space Flight Center, Greenbelt, Maryland, USA 6Science Systems and Applications, Inc., Lanham, Maryland, USA
7Joint Center for Earth Systems Technology, University of Maryland, Baltimore County (JCET/UMBC), Baltimore, Maryland, USA
8Physical Research Laboratory, Ahmedabad, India
Correspondence to:J. M. Livingston (john.livingston@sri.com)
Received: 10 April 2013 – Published in Atmos. Chem. Phys. Discuss.: 7 June 2013 Revised: 29 October 2013 – Accepted: 21 January 2014 – Published: 21 February 2014
Abstract. Airborne sunphotometer measurements acquired
by the NASA Ames Airborne Tracking Sunphotometer (AATS-14) aboard the NASA P-3 research aircraft are used to evaluate dark-target over-land retrievals of extinction aerosol optical depth (AOD) from spatially and temporally near-coincident measurements by the Moderate Resolution Imaging Spectroradiometer (MODIS) during the summer 2008 Arctic Research of the Composition of the Troposphere from Aircraft and Satellites (ARCTAS) field campaign. The new MODIS Collection 6 aerosol data set includes retrievals of AOD at both 10 km×10 km and 3 km×3 km (at nadir)
resolution. In this paper we compare MODIS and AATS AOD at 553 nm in 58 10 km and 134 3 km retrieval grid cells. These AOD values were derived from data collected over Canada on four days during short time segments of five (four Aqua and one Terra) satellite overpasses of the P-3 dur-ing low-altitude P-3 flight tracks. Three of the five MODIS– AATS coincidence events were dominated by smoke: one included a P-3 transect of a well-defined smoke plume in clear sky, but two were confounded by the presence of scat-tered clouds above smoke. The clouds limited the number of MODIS retrievals available for comparison, and led to
MODIS AOD retrievals that underestimated the correspond-ing AATS values. This happened because the MODIS aerosol cloud mask selectively removed 0.5 km pixels containing smoke and clouds before the aerosol retrieval. The other two coincidences (one Terra and one Aqua) occurred during one P-3 flight on the same day and in the same general area, in an atmosphere characterized by a relatively low AOD (< 0.3), spatially homogeneous regional haze from smoke outflow with no distinguishable plume. For the ensemble data set for MODIS AOD retrievals with the highest-quality flag, MODIS AOD agrees with AATS AOD within the expected MODIS over-land AOD uncertainty in 60 % of the retrieval grid cells at 10 km resolution and 69 % at 3 km resolution. These values improve to 65 % and 74 %, respectively, when the cloud-affected case with the strongest plume is excluded. We find that the standard MODIS dark-target over-land re-trieval algorithm fails to retrieve AOD for thick smoke, not only in cloud-contaminated regions but also in clear sky. We attribute this to deselection, by the cloud and/or bright sur-face masks, of 0.5 km resolution pixels that contain smoke.
1 Introduction
The 14-channel Ames Airborne Tracking Sunphotometer (AATS-14 or AATS) was operated on a NASA P-3 air-craft based in Cold Lake, Alberta, Canada, during the sum-mer phase of the 2008 Arctic Research of the Composition of the Troposphere from Aircraft and Satellites (ARCTAS) field campaign (Jacob et al., 2010). AATS measurements were analyzed to calculate aerosol optical depth (AOD) at 13 wavelengths (354–2139 nm) as well as columnar water vapor (CWV) in nine flights that sampled smoke from bo-real forest fires, Asian outflow, and emissions from min-ing sites. In this paper, we use only a limited subset of the ARCTAS summer AATS AOD data set. We compare AATS AOD from five short time segments of four P-3 flights with AOD retrieved by the Moderate Resolution Imaging Spec-troradiometer (MODIS) dark-target land aerosol retrieval al-gorithm from measurements acquired over land during one Terra and four Aqua satellite overpasses that were spatially and temporally near-coincident with the AATS measure-ments.
Our paper is the fourth in a series of studies that use AATS data obtained during ARCTAS. Shinozuka et al. (2011) pro-vided a detailed overview of AOD calculated from AATS measurements during the spring and summer phases of ARC-TAS. They focused on data obtained during aircraft vertical profiles, for which they compared AOD magnitude and spec-tral behavior, in addition to particle fine-mode fraction cal-culated from AATS data, with parameters derived from P-3 in situ sensor measurements. They also examined the con-sistency between AATS and ground-based full-column AOD using measurements obtained during flyovers of five sites of the Aerosol Robotic Network (AERONET) (Holben et al., 1998). Shinozuka and Redemann (2011) used AATS AOD to conduct a statistical study on the horizontal variability of AOD during both phases of ARCTAS. Segal-Rosenheimer et al. (2013) used AATS measurements in ARCTAS to demon-strate a new approach to retrieving cirrus properties.
Our investigation compares AATS AOD with MODIS Collection 6 (C006) AOD retrievals at 10 km×10 km and
3 km×3 km (at nadir) spatial resolution over land. Most
studies (Chu et al., 2002; Remer et al., 2005; Levy et al., 2005, 2007a, b, 2010; Remer et al., 2013) that have ad-dressed validation of MODIS aerosol retrievals over land have relied solely on ground-based sunphotometer measure-ments from AERONET, and have benefitted from the large number of available MODIS–AERONET coincident mea-surements. Studies to validate MODIS over water aerosol retrievals have used data from AERONET coastal or island sites (e.g., Levy et al., 2005; Redemann et al., 2005); from shipboard measurements by handheld devices as part of the Maritime Aerosol Network (Kleidman et al., 2012); or from over-water airborne sunphotometer measurements by AATS-6 or AATS-14 (Schmid et al., 2003a, b; Livingston et al., 2003, 2009; Redemann et al., 2005, 2006; Russell et al.,
2007), for which the number of coincident data sets is lim-ited. All of the studies referenced above dealt with valida-tion of the 10 km resoluvalida-tion aerosol product retrieved by the MODIS over-water or over-land operational algorithms. Other retrieval algorithms have been developed and applied to MODIS data to yield aerosol retrievals at finer resolution for local areas of interest (C. Li et al., 2005; Castanho et al., 2008) or for global application (Lyapustin et al., 2011). Re-mer et al. (2013) provide a detailed description of the C006 MODIS 3 km aerosol retrieval algorithm, and compare six months of Aqua AOD (retrieved from measurements col-lected over three separate years) with values calculated from collocated AERONET measurements. Munchak et al. (2013) further investigate the usefulness and validity of the MODIS 3 km product over an urban/suburban landscape by compar-ing the product with a mesoscale array of 40 AERONET sta-tions and an airborne high-spectral-resolution lidar.
The five MODIS–AATS near-coincident measurement events analyzed in this paper represent the first comparison of airborne sunphotometer AOD with the MODIS C006 10 km and the new 3 km resolution over-land aerosol retrieval prod-ucts, as well as the largest number of over-land intercom-parisons from a single AATS field mission. Consistent with the approach in previous AATS-MODIS comparisons, we take advantage of the high temporal (one 3 Hz 3 s average every 4 s) and spatial (∼360 m/3 s average in the
horizon-tal) resolution, and the areal extent of the AATS measure-ments, to compare AATS and MODIS AOD within individ-ual MODIS aerosol retrieval grid cells that intersected the P-3/AATS track. There are a total of 58 10 km and 134 3 km grid cells that have AOD available from both (1) the standard MODIS operational algorithm retrievals and (2) calculations from AATS measurements.
The high-spatial-resolution AATS measurements obtained during ARCTAS present a unique opportunity to examine the impact of spatial variability on over-land MODIS AOD re-trievals. Yet, we recognize that there are limitations to the analyses. First, the number of available intercomparisons is limited to five MODIS overflights, and as we shall show, clouds further limited the availability of MODIS retrieval cells and confounded the comparisons in two of these cases. Secondly, there are inherent differences between the MODIS and AATS sensors that make such comparisons problematic. MODIS is a downward-viewing satellite sensor that mea-sures upwelling Earth–atmosphere reflectance, and AATS is a Sun-viewing airborne sensor that measures transmission of the direct solar beam through the atmosphere above the aircraft. Invariably, there are temporal and spatial sampling differences. MODIS measurements within a satellite aerosol retrieval grid cell are essentially instantaneous compared to the AATS measurements. During ARCTAS, the latter were acquired over the time period, ranging from several sec-onds to a few minutes, that it took the P-3 to traverse some small fraction of each satellite retrieval grid cell. Because the respective sensor viewing geometries are significantly
J. M. Livingston et al.: Comparison of MODIS 3 km and 10 km resolution aerosol optical depth retrievals 2017
different, so too are the respective air parcel volumes sam-pled. Hence, spatial inhomogeneity of the aerosol, especially within a smoke plume, can lead to significant differences in the retrieved AODs. This is further complicated by the lim-ited coverage and by the location of the specific track of the aircraft within each MODIS retrieval grid cell.
On the other hand, some limitations of the analysis ex-pressed above also apply to analyses that use stationary ground-based sunphotometers to evaluate satellite aerosol re-trievals. In fact, the mobility of the airborne instrument actu-ally mitigates the spatial and temporal differences between satellite and suborbital sampling of the aerosol field. Stan-dard MODIS spatiotemporal collocation for a 10 km prod-uct involves averages of retrievals in a 50 km box and within an hour of sunphotometer observations (Ichoku et al., 2002). With airborne instruments, the collocations are achieved within the exact 10 km or 3 km retrieval box with no spatial averaging, and within minutes temporally. The ground-based collocation method acquires large data sets that can be ana-lyzed statistically to relate lack of precision and bias to spe-cific algorithmic or environmental parameters (Levy et al., 2010; Hyer et al. 2011). Airborne studies simply do not have the statistics to do the same. However, airborne studies, with their more precise collocations and case studies, can provide a deeper understanding of algorithmic features that cannot be discerned through the averaging procedures of the larger statistical data bases, especially when inhomogeneous con-ditions exist.
2 Sensors and aerosol retrieval algorithms
2.1 MODIS
The MODIS instruments aboard the Terra and Aqua satel-lites measure radiance in 36 visible, near-infrared, and in-frared spectral bands between 415 and 14 235 nm (King et al., 1992) using different spatial resolutions of 0.25, 0.50, or 1 km, depending on the particular band. MODIS views a swath ∼2300 km wide that is broken into 5 min
“gran-ules”, each∼2030 km long. The MODIS over-ocean
opera-tional algorithm for the retrieval of AOD has been described in detail by Remer et al. (2005). The MODIS dark-target over-land retrieval algorithm is based on work by Kaufman et al. (1997). As noted by Levy et al. (2010), the second-generation over-land dark-target algorithm was developed by Levy et al. (2007a, b, 2009) and addressed issues identified in previous versions of the MODIS dark-target land aerosol product (e.g., Remer et al., 2005; Levy et al., 2005). Levy et al. (2013) describe in detail the MODIS Collection 6 aerosol products and the differences between the Collection 5 and Collection 6 algorithms. Remer et al. (2013) discuss the new 3 km resolution C006 aerosol products and present an ini-tial comparison of the MODIS AOD retrievals and collocated AERONET AODs on a global basis. Munchak et al. (2013)
focus on the mid-Atlantic region of the US and make use of a mesoscale grid of approximately 40 AERONET instru-ments to evaluate the 3 km resolution product across an ur-ban/suburban landscape.
The MODIS retrieval algorithm over land (both 10 km and 3 km) performs a simultaneous inversion of the measured top of the atmosphere reflectance in three channels (centered at wavelengths,λ, of 466, 645, and 2113 nm) to retrieve total spectral AOD, “fine” model weighting parameter, and sur-face reflectance at 2113 nm. This is done by comparing mea-surements to pre-computed lookup tables (LUTs) of simu-lated top-of-atmosphere (TOA) reflectance for five aerosol types (Levy et al., 2007a), loadings, and observing geometry, but with a number of constraints. These constraints include (a) assigning a fine-dominated aerosol type (fine model) for a given location and season; (b) requiring the fine model to be mixed with a coarse-dominated (dust) model, with some to-be-determined weighting (ETA); and (c) requiring that the surface optical properties must be spectrally related. Specif-ically, for our ARCTAS region, the moderately absorbing fine model is assumed. The principal product is AOD at 553 nm, but since the LUT is indexed, the AOD can also be determined at the other three wavelengths (466, 645, and 2113 nm). From this information, one can also calculate such properties as fine-model AOD (fAOD = ETA·AOD) and
ex-tinction Ångström exponent (AE). Although these derived parameters (fAOD and AE) were included in Collection 5 (C005) products, Levy et al. (2010) concluded that these size parameters in the over-land data set have little physical valid-ity, and instead primarily reflect algorithm assumptions about particle type. Hence, only the directly retrieved fine-model weighting parameter has been retained as a product in the C006 aerosol data set. Although the AE is not retained as a product, it can easily be calculated offline, and we have cal-culated it as the negative slope of a linear least-squares fit of log(AOD) vs. log(λ) using only AOD from the three shortest MODIS AOD wavelengths of 466, 553, and 645 nm.
The retrieval technique is the same for creating the 3 km and 10 km data products. Although the MODIS C006 aerosol products are provided at these (nadir) resolutions, the algo-rithm uses the higher-resolution MODIS observations (e.g., 0.5 km×0.5 km or 1 km×1 km data). This is done to
in-crease signal to noise and to have the flexibility to filter out or “mask” pixels that are not appropriate for clear-sky, dark-target aerosol retrieval, including clouds, snow/ice, in-land water, and bright reflecting surfaces. As described in Levy et al. (2010) and Remer et al. (2012), several tests are applied (Martins et al., 2002; Ackerman et al., 1998; R. Li et al., 2005) to remove these inappropriate pixels. The first “test” is actually a set of multiple tests to mask cloudy pixels. The cloud mask is primarily based on spa-tial variability of reflectance, and results in a designation of “cloudy” or “cloud free” for each 0.5 km resolution pixel. In the MODIS C006 product, this resulting cloud mask is re-ported as Aerosol_Cldmask_Land_Ocean. In the first subtest
(Martins et al., 2002), the standard deviation is calculated for each set of 3×3 0.5 km resolution reflectances (applied to
the 466 nm channel for over-land retrievals); if the standard deviation exceeds a designated value, then the center pixel of the nine pixels is designated “cloudy”. Spatial variability is also calculated using the 1382 nm channel at 1 km resolu-tion. This channel is sensitive to the upper atmosphere and to cirrus clouds in the upper atmosphere. Smooth, thin cir-rus that might escape identification as cloud in the 466 nm spatial variability test can sometimes be identified with this cirrus-sensitive channel. Over land, pixels that include inland water, snow (R. Li et al., 2005), and bright land surfaces are then deselected based on information provided as input, pixel brightness, and several internal algorithm tests. For exam-ple, pixels with calculated values of the normalized differ-ence vegetation index (NDVI) less than 0.1 are believed to be “inland water bodies” and are masked.
At the end of the masking procedures, all the pixels that have escaped masking and are considered ready for retrieval are ordered according to their reflectance at 645 nm. The darkest 20 % and the brightest 50 % of these remaining and “good” pixels are arbitrarily discarded, and the procedure continues with only 30 % of the unmasked pixels. The land algorithm requires a minimum of 12 remaining pixels (10 % of a possible 120) to attempt a retrieval at 10 km, and at least 50 pixels (42 %) to receive consideration as a very good qual-ity retrieval. To attempt a 3 km retrieval, the algorithm re-quires at least 5 pixels (45 % of a possible 11). The number of pixels used in each 3 km or 10 km retrieval is reported in the MODIS C006 product as Number_Pixels_Used_Land.
Most diagnostics available at 10 km are also included in the archived data files for the 3 km product (Remer et al., 2013). These include a quality flag (QF) that classifies each retrieval as bad (0), marginal (1), good (2), or very good (3); the number of 0.5 km×0.5 km pixels used in the retrieval,
and the assigned fine-model aerosol type.
2.2 AATS-14
The AATS-14 instrument measures the atmospheric trans-mission of the direct solar beam in 14 spectral channels with center wavelengths ranging from 354 to 2139 nm, and full width at half maximum (FWHM) bandwidths of∼5 nm
(ex-ceptions are 2.0 nm for the 354 nm channel and 17.3 nm for the 2139 nm channel). The instrument has been described in detail in several previous publications (e.g., Russell et al., 2005, 2007, and references therein). Our methods for data acquisition and analysis have been well documented in the literature (Russell et al., 1993a, b; Schmid and Wehrli, 1995; Schmid et al., 1996, 1998, 2001, 2003a; Livingston et al., 2005, 2007). Most recently, citing the previous publications, Shinozuka et al. (2011) detailed these procedures. We pro-vide only a brief synopsis here.
The AATS channel wavelengths were chosen to permit separation of aerosol, water vapor, and ozone transmission
along the AATS-to-Sun slant path. During ARCTAS, data were sampled at 3 Hz and recorded as 3 s averages together with the sample standard deviations over the nine samples. We routinely calculate spectral AOD from detector volt-ages measured in 13 of the 14 AATS channels. Calculation of AOD(λ) requires knowledge of exoatmospheric detector voltages, V0(λ). For the data we present here, the V0(λ) val-ues were based on sunrise measurements acquired at Mauna Loa Observatory, Hawaii, in May 2008. In accord with the procedure described in Schmid et al. (2003a, b), these val-ues were then adjusted by analysis of high-altitude clear-air AOD spectra obtained during the deployment. AATS mea-surements were screened to remove data points that include clouds by using both the standard deviations of the raw volt-ages and the shape of the spectral AOD signature.
3 Results
3.1 Overview of ARCTAS data cases and analysis
approach
We compare AATS and MODIS AOD retrieved from mea-surements acquired over land during four P-3 flights that in-cluded five satellite overpasses on 30 June (Aqua), 2 July (Aqua), 3 July (Terra and Aqua), and 9 July (Aqua) 2008. On 30 June, the P-3 intersected a well-defined smoke plume in a clear-to-mostly-clear sky at the exact time of the Aqua over-pass. The 2 July case was marked by smoke beneath scattered cirrus and cumulus clouds and a rather complicated P-3 hori-zontal flight track. The two 3 July coincidences were charac-terized by a relatively small AOD (< 0.3), spatially homoge-neous regional haze from smoke outflow with no distinguish-able plume (Shinozuka et al., 2011) in mostly clear sky. The locations of the coincident MODIS aerosol grid cells and the P-3 track were within 25 km for the morning Terra and after-noon Aqua overpasses, which occurred about 3 h apart. The 9 July case involved a general south–north P-3 flight track characterized by smoke beneath scattered clouds.
In each case, we limit the comparison to AATS data col-lected at minimum P-3 altitude (∼100–600 m a.g.l.) within
intersecting MODIS aerosol retrieval grid cells during short-duration, primarily horizontal flight segments within a few minutes of the time of the satellite overpass. The duration of the flight segments was 12–17 min for the 30 June, 3 July, and 9 July cases, and 48 min for the 2 July case; tem-poral differences between the AATS measurements and the MODIS overpass were 0–20 min for 30 June, 3 July, and 9 July, and 7–55 min for 2 July. For each MODIS over-pass, we first calculate the mean AOD spectrum from all cloud-screened AATS measurements within each MODIS grid cell. Then, we interpolate using a second-order poly-nomial in log(AOD)-log(λ) space for the 11 AATS channels centered at wavelengths between 353.5 and 1019.1 nm to cal-culate AATS AOD at the MODIS wavelength of 553 nm.
J. M. Livingston et al.: Comparison of MODIS 3 km and 10 km resolution aerosol optical depth retrievals 2019
To compare MODIS full-column AOD retrievals with AATS above-aircraft AOD, it is necessary to increase each AATS AOD by the amount of AOD between the surface and the altitude of the P-3. We have estimated this amount by as-suming a constant below-aircraft aerosol extinction spec-trum profile equal to the extinction coefficient calculated from simultaneous measurements at flight level by the P-3-based University of Hawaii HiGear in situ suite of ments, as described in Shinozuka et al. (2011). These instru-ments included two three-channel (450, 550, and 700 nm) TSI model 3563 integrating nephelometers (Anderson et al., 1996, 2003; Heintzenberg and Charlson, 1996), and two three-wavelength (470, 530, and 660 nm) Radiance Research particle soot absorption photometers (PSAPs). After inter-polation to 553 nm, the below-aircraft AOD estimates were added to the mean AATS AODs within each grid cell to yield adjusted AODs. However, we note that the uncertainty in the estimated below-aircraft AOD can be particularly large within a smoke plume due to the assumption of vertical ho-mogeneity in aerosol extinction below the aircraft, and that there is no way to validate these estimates for the cases dis-cussed here. Hence, we have chosen to use both the unad-justed and adunad-justed AATS AODs in our analyses, but have been careful to repeatedly inform the reader exactly what we are showing in order to avoid confusion. For comparison of MODIS and AATS AE, we calculate AATS AE values using only AATS AOD calculated from measurements in the five channels centered at wavelengths between 451 and 675 nm. In particular, the AATS AE values are calculated as the nega-tive slope of a linear least-squares fit of log(AOD) vs. log(λ) for AATS channels centered atλ=451, 499, 520, 606, and
675 nm.
For each case, we show the MODIS RGB image with lo-cations of the P-3/AATS flight track and the MODIS 10 km aerosol retrieval grid cells overlaid. We also present a map view of the P-3 flight track color-coded by AATS AOD at 520 nm superimposed on color-coded boundaries of the MODIS 10 km retrieval grid cells intersecting the P-3 track, and (in a separate figure) the MODIS 3 km retrieval grid cells that either intersect (green) the P-3 track or intersect (black) a MODIS 10 km grid cell. We also show a color-coded multipanel graph that shows the corresponding re-trieved MODIS and the calculated AATS AOD spectra (the latter before any wavelength interpolation or adjustment due to estimated AOD below the P-3) within the 10 km MODIS grid cells. Graphs of AOD (at 553 nm) as a function of lati-tude or longilati-tude are used to overlay unadjusted and adjusted AATS AOD with MODIS 10 km and 3 km AOD along the flight track. Scatterplots are used to compare mean MODIS 3 km and 10 km AODs within the MODIS 10 km grid cells, and to compare the MODIS 3 km and 10 km AODs with the corresponding mean of the AATS AODs at 553 nm. Follow-ing the analyses of the individual cases, we examine compos-ite scatterplots that compare MODIS and AATS AODs for all grid cells. Table 1 lists values of parameters (including
MODIS and AATS AOD at 553 nm, AE, MODIS retrieval quality flags, and number of measurements) pertaining to the MODIS–AATS AOD comparisons within the 10 km retrieval grid cells. Corresponding scatterplot statistics for the AOD comparisons are given in Table 2 for each day and for the composite data set. These include the absolute and relative number of cells with retrieved MODIS AOD that agree with the calculated AATS AOD to within the MODIS expected error (EE), values of R2 and the corresponding p value, and mean and RMS differences. Analogous statistics for AE comparisons are given in Table 3.
3.2 30 June 2008
On 30 June, we acquired AATS-14 measurements during a NW–SE aircraft transect at an altitude of 102–218 m a.g.l. during the time period 19.67–19.95 UT, bracketing the time of the Aqua MODIS satellite overpass at 19.84 UT. The measurements were focused on a thick smoke plume orig-inating from a forest fire located at∼58.43◦N, 106.76◦W
in north-central Saskatchewan. AATS measurements yielded mid-visible (520 nm) AODs that ranged from 0.05 in clear air outside the smoke plume to > 2 in the plume, with corre-sponding AE of 1.56 to 2.16, respectively.
In Fig. 1a, we show the Aqua MODIS RGB image at the time of satellite overpass, the locations of the 13 MODIS C006 operational 10 km aerosol retrieval grid cells, and the location of the P-3/AATS flight track during the 19.67– 19.95 UT period. The smoke plume dominates the scene, and it is apparent that the projected P-3 track intersected the plume at the exact time of the MODIS overpass. In fact, P-3, flying at an altitude of ∼125 m a.g.l., actually
pene-trated the plume. Scattered-to-broken clouds are evident in the area well north of the plume, but the southern two-thirds of the scene, including the region of the smoke plume and most of the P-3 flight track, appears to be cloud-free, al-though this image alone cannot be used to completely rule out very small scattered cumulus or thin cirrus. In Fig. 1b, the P-3 flight track is plotted as color-coded AATS-derived AOD at 520.4 nm, and the locations of the 10 km resolution grid cells (color-coded by location for subsequent compar-ison with AATS AOD spectra) that intersect the P-3 flight track are also shown. These are overlaid on a contour plot of MODIS 553 nm AOD retrieved with both the aerosol cloud mask and the NDVI mask turned off (see discussion in the next paragraph). The contours are shown only for illustra-tive purposes to identify the location of the smoke plume relative to the P-3 flight track. In Fig. 1c, AATS AODs at wavelengths 451.2, 520.4, and 675.1 nm, as well as the cor-responding AATS AE, are plotted as a function of time and latitude. Solid magenta squares are used to display AE calcu-lated from the mean of the AATS AODs located within each MODIS aerosol retrieval grid cell, and these are plotted at the mean time of the AATS measurements within each grid cell. Values of AE outside the plume were 1.5–1.8, which
Table 1.Parameters for individual MODIS 10 km aerosol retrieval grid cells, including MODIS and AATS AOD and Ångström exponents.
MODIS AATS AOD 553 nm Ångström exponent
Date Cell index Qual. flag Number of 0.5 km pixels No. Obs. MODIS AATS MODIS AATS (satellite) Number Masks on Masks On Cld. Msk Off +NDVI off in cell Masks on Cld. off +NDVI off Unadj. Adj. Masks on Cld. off Unadj. Adj.
30 June (Aqua) 1 3 62 112 114 14 0.092 0.106 0.105 0.056 0.061 1.734 1.739 1.629 1.659 2 3 82 115 119 19 0.012 0.020 0.020 0.055 0.059 1.881 1.739 1.626 1.670 3 3 83 109 111 19 0.028 0.031 0.035 0.056 0.059 1.676 1.781 1.613 1.648 4 3 95 115 115 20 0.160 0.162 0.162 0.066 0.076 0.619 0.595 1.725 1.754 5 3 115 118 120 18 0.041 0.042 0.041 0.045 0.048 1.793 1.802 1.557 1.587 6 3 111 116 118 20 0.110 0.107 0.105 0.106 0.123 0.928 1.412 1.970 2.008 7 3 64 103 118 19 1.189 1.084 1.114 1.167 1.239 1.256 1.191 2.156 2.166 8 3 102 118 121 20 1.039 1.022 1.026 0.864 0.982 0.625 0.627 2.146 2.160 9 3 105 109 117 16 0.152 0.162 0.182 0.328 0.402 1.736 1.755 2.115 2.137 10 3 109 116 121 15 0.026 0.030 0.028 0.065 0.080 1.738 1.842 1.775 1.833 11 3 107 107 113 2 0.018 0.018 0.016 0.040 0.044 1.935 1.935 1.551 1.586 12 3 106 106 112 18 0.031 0.031 0.037 0.041 0.045 1.781 1.781 1.584 1.627 13 3 100 100 109 18 0.047 0.047 0.055 0.042 0.046 1.785 1.785 1.628 1.656
2 July (Aqua) 1 46 121 47 1.817 2.076 1.711 2.964 1.235 1.857 1.896 2 52 121 46 0.690 1.117 1.438 2.219 1.253 2.003 1.986 3 3 95 98 118 48 0.115 0.115 0.122 0.089 0.148 1.762 1.727 1.419 1.550 4 0 17 54 61 28 0.088 0.112 0.113 0.050 0.062 1.744 1.754 1.125 1.275 5 3 46 93 112 9 0.096 0.095 0.097 0.051 0.064 1.748 1.743 1.099 1.229 6 41 61 16 1.272 1.187 0.628 1.117 1.406 1.420 1.575 7 2 33 82 88 14 0.282 0.257 0.267 0.183 0.257 1.726 1.735 1.239 1.376 8 42 48 10 0.292 0.297 0.269 0.415 0.828 1.099 1.302 9 42 50 9 0.926 0.939 0.315 0.505 1.516 1.544 1.621 10 27 67 13 0.692 0.574 0.761 1.151 1.601 1.788 1.826 11 16 42 3 1.820 1.880 0.960 1.527 1.233 1.921 1.992 12 17 57 12 1.154 1.654 0.721 1.196 1.442 1.999 2.080 13 24 51 7 0.275 0.287 0.156 0.312 1.740 1.675 1.887 14 21 34 10 0.253 0.247 0.076 0.096 1.730 1.420 1.543 15 16 25 2 0.245 0.295 0.065 0.083 1.737 1.412 1.500 16 2 40 75 109 11 0.144 0.169 0.183 0.266 1.318 1.748 1.731 1.496 1.864 17 1 27 63 119 1 0.165 0.188 0.391 0.926 2.164 0.620 0.608 1.776 1.783 18 53 115 20 0.438 0.829 1.819 2.715 1.685 1.880 1.884 19 21 119 23 0.833 2.403 1.701 2.701 1.323 2.083 2.047 20 3 55 96 121 20 0.727 0.816 0.857 0.791 1.338 1.583 1.557 1.579 1.691 21 3 104 114 121 20 0.387 0.386 0.387 0.331 0.621 1.696 1.700 1.423 1.495 22 2 39 45 49 7 0.368 0.369 0.371 0.258 0.451 0.580 0.578 1.260 1.291 23 0 73 86 121 14 0.535 0.535 0.553 0.233 0.429 0.545 0.546 1.163 1.225 24 2 46 69 121 23 0.333 0.319 0.350 0.269 0.454 1.707 1.718 0.980 1.062 25 0 30 107 119 35 0.267 0.342 0.356 0.336 0.495 1.739 1.716 1.001 1.073 26 0 24 110 118 15 0.438 0.605 0.611 0.366 0.499 1.685 1.631 1.459 1.493 27 2 46 83 121 14 0.167 0.185 0.193 0.295 0.442 1.739 1.736 0.973 1.083 28 2 44 79 120 11 0.257 0.246 0.248 0.223 0.337 1.744 1.746 1.205 1.337 29 1 22 46 59 12 0.159 0.163 0.189 0.148 0.192 0.606 1.744 1.543 1.603 30 3 79 115 120 16 0.126 0.155 0.159 0.801 0.925 1.739 1.742 1.730 1.739 31 3 51 99 115 7 0.373 0.511 0.516 1.776 2.003 1.705 1.663 1.822 1.829 32 20 58 7 0.849 1.621 2.365 2.648 1.542 1.782 1.791
3 July (Terra) 1 3 117 33 0.230 0.200 0.225 0.609 1.709 1.718 2 3 121 7 0.249 0.213 0.229 0.610 1.676 1.693 3 3 98 20 0.171 0.219 0.236 1.746 1.675 1.684 4 3 111 22 0.157 0.221 0.240 1.747 1.678 1.686 5 3 120 4 0.161 0.210 0.230 1.741 1.682 1.689 6 3 109 23 0.245 0.206 0.227 0.606 1.681 1.695 7 3 120 25 0.107 0.196 0.217 1.759 1.691 1.709 8 3 113 24 0.125 0.190 0.209 1.735 1.697 1.710 9 3 121 22 0.080 0.190 0.213 1.766 1.701 1.718 10 3 120 4 0.088 0.193 0.215 1.744 1.700 1.716 11 3 121 25 0.115 0.192 0.214 1.743 1.706 1.717 12 3 121 11 0.221 0.194 0.219 0.595 1.704 1.725
3 July (Aqua) 1 3 120 37 0.151 0.194 0.216 1.762 1.701 1.713 2 3 117 24 0.146 0.193 0.226 1.751 1.703 1.723 3 3 116 86 0.208 0.197 0.221 1.741 1.712 1.726 4 3 118 11 0.189 0.199 0.223 1.732 1.718 1.736 5 3 118 4 0.240 0.201 0.222 0.717 1.721 1.734 6 3 120 81 0.196 0.201 0.223 1.743 1.724 1.739
9 July (Aqua) 1 1 24 37 70 31 0.676 0.671 0.623 0.462 0.490 0.526 0.526 1.550 1.575 2 0 20 75 112 24 0.265 0.302 0.306 0.242 0.250 1.737 1.727 1.551 1.569 3 1 21 92 117 58 0.272 0.318 0.312 0.247 0.253 1.405 1.504 1.554 1.568 4 1 26 88 105 19 0.492 0.522 0.545 0.307 0.316 0.928 0.796 1.554 1.565 5 3 62 100 120 35 0.532 0.595 0.591 0.384 0.391 0.803 0.539 1.494 1.507 6 3 77 103 119 12 0.654 0.663 0.654 0.496 0.503 1.148 1.151 1.502 1.507 7 2 34 73 83 38 0.711 0.751 0.735 0.683 0.696 1.142 1.136 1.460 1.471 8 2 45 67 118 11 0.459 0.471 0.709 0.590 0.610 1.678 1.679 1.505 1.523 9 3 94 103 121 19 0.351 0.352 0.352 0.383 0.428 1.712 1.708 1.561 1.601
J
.
M.
Li
vingston
et
al.:
Compa
rison
of
MODIS
3
km
and
10
km
resolution
aer
osol
optical
depth
retrie
v
als
2021
Table 2.Summary of parameters and statistics for MODIS/AATS AOD comparisons.
MODIS AOD (MODIS–AATS) AOD (MODIS 3 km–MODIS 10 km)
Date Cell res. Masks Retrieval Total no. Number of cells (%) R2 pval Mean difference RMSD R2 pval Mean difference RMSD (satellite) [km] Cloud NDVI qual. flag cells < AATS AOD Within EE > AATS AOD Abs. Rel. ( %) Abs. Rel. ( %) Abs. Rel. ( %) Abs. Rel. ( %) 30 June (Aqua) 10 on on 3 13 2(15) 10(77) 1(8) 0.960 0.000 −0.025 −9.8 0.080 31.9 0.986 0.000 0.015 6.8 0.059 26.0
3 on on 3 35 2(6) 31(88) 2(6) 0.925 0.000 0.035 16.3 0.126 58.2
2 July (Aqua) 10 on on all 18 9(50) 9(50) 0 0.049 0.378 −0.398 −58.5 0.718 105.9 0.885 0.000 0.025 8.9 0.065 23.1 10 on on 3,2,1 14 8(57) 6(43) 0 0.069 0.363 −0.501 −73.9 0.811 119.6 0.933 0.000 0.022 8.5 0.051 19.2 10 on on 3,2 12 7(58) 5(42) 0 0.183 0.165 −0.415 −61.3 0.659 97.2 0.933 0.000 0.029 10.2 0.054 19.3 10 on on 3 6 4(67) 2(33) 0 0.367 0.202 −0.546 −80.5 0.788 116.3 0.979 0.000 0.028 9.2 0.048 15.7 3 on on all 25 12(48) 12(48) 1(4) 0.243 0.012 −0.230 −38.2 0.462 76.8
3 on on 3 23 12(52) 10(43) 1(4) 0.282 0.009 −0.257 −41.8 0.480 77.9
3 July (Terra) 10 on on 3 12 6(50) 6(50) 0 0.268 0.085 −0.060 −27.1 0.081 35.5 0.905 0.000 −0.0002 −0.1 0.022 13.8 3 on on 3 44 18(41) 26(59) 0 0.135 0.014 −0.057 −25.8 0.084 37.8
3 July (Aqua) 10 on on 3 6 1(17) 5(83) 0 0.007 0.873 −0.034 −15.1 0.047 21.0 0.817 0.013 0.002 1.0 0.015 7.9 3 on on 3 22 6(27) 16(73) 0 0.003 0.818 −0.036 −16.0 0.060 26.9
9 July (Aqua) 10 on on all 9 1(11) 4(44) 4(44) 0.539 0.024 0.053 12.1 0.124 28.3 0.874 0.000 0.037 7.6 0.068 13.9 10 on on 3 3 0 1(33) 2(67) 0.325 0.614 0.072 16.3 0.127 28.9 0.988 0.069 0.052 10.1 0.059 11.5 3 on on 3 (all = 3) 8 0 8(100) 0 0.727 0.007 0.016 2.9 0.095 17.5
Aggregated
All dates 10 on on all 58 19(33) 34(59) 5(9) 0.235 0.000 −0.137 −33.9 0.407 100.7 0.954 0.000 0.017 6.4 0.054 20.3 10 on on 3 40 13(32) 24(60) 3(8) 0.472 0.000 −0.108 −31.5 0.314 91.8 0.974 0.000 0.013 5.7
3 on on all 134 38(28) 93(69) 3(2) 0.544 0.000 −0.057 −18.5 0.218 70.1 3 on on 3 132 38(28) 91(69) 3(2) 0.545 0.000 −0.060 −19.3 0.219 70.8
All except 2 July 10 on on all 40 10(25) 25(62) 5(13) 0.894 0.000 −0.019 −6.9 0.089 31.6 0.970 0.000 0.014 5.2 0.049 18.6 10 on on 3 34 9(26) 22(65) 3(9) 0.916 0.000 −0.030 −12.0 0.081 32.2 0.976 0.000 0.011 4.8 0.043 19.3 3 on on 3 (all = 3) 109 26(24) 81(74) 2(2) 0.877 0.000 −0.018 −7.3 0.097 39.6
All dates∗ 10 on on all 58 11(19) 39(67) 8(14) 0.403 0.000 −0.039 −12.8 0.244 79.9 10 on on 3 40 7(18) 30(75) 3(7) 0.471 0.000 −0.056 −19.4 0.256 87.9 3 on on all 134 18(13) 105(78) 11(8) 0.515 0.000 −0.003 −1.0 0.191 74.5 3 on on 3 132 18(14) 104(79) 10(8) 0.520 0.000 −0.006 −2.2 0.190 74.5 All except 2 July∗ 10 on on all 40 6(15) 29(73) 5(12) 0.908 0.000 0.003 1.0 0.084 32.6 10 on on 3 34 5(15) 26(76) 3(9) 0.930 0.000 −0.007 −3.1 0.074 32.2 3 on on 3 (all = 3) 109 14(13) 89(82) 6(5) 0.863 0.000 0.006 2.5 0.105 47.8
∗For these comparisons, AATS AOD values donotinclude estimate of AOD below aircraft.
www
.atmos-chem-ph
ys.net/14
/2015/2014/
Atmos.
Chem.
Ph
ys.,
14,
2015–
2038
,
(a)
(b)
(c)
40
Fig. 1. (a)Aqua MODIS RGB image for the overpass at 19.85 UT on 30 June 2008. Locations of the MODIS 10 km resolution aerosol
re-trieval grid cells (red) and the P-3/AATS-14 flight track (yellow) are overlaid. Yellow numbers give UT along the P-3 flight track.(b)Overlay
of MODIS grid cells (color-coded for comparison with AATS AOD spectra in Fig. 3) and P-3 track (color-coded by AATS 520 nm AOD) on contour map of MODIS AOD retrieved at 10 km resolution with the aerosol cloud mask and the NDVI mask turned off. Cells are numbered from NW to SE.(c)Time and latitude series of AATS AOD (colors) and Ångström exponent (AE, black) along the P-3 flight track; magenta
squares show mean AATS AE calculated for AATS measurements within individual MODIS 10 km grid cells.
indicates that the AATS cloud filter was effective in remov-ing any optically thick cloud-contaminated observations, for which an AE near zero would be expected. Values of AE in-side the plume were 2.1–2.2, indicative of small particles of fresh smoke.
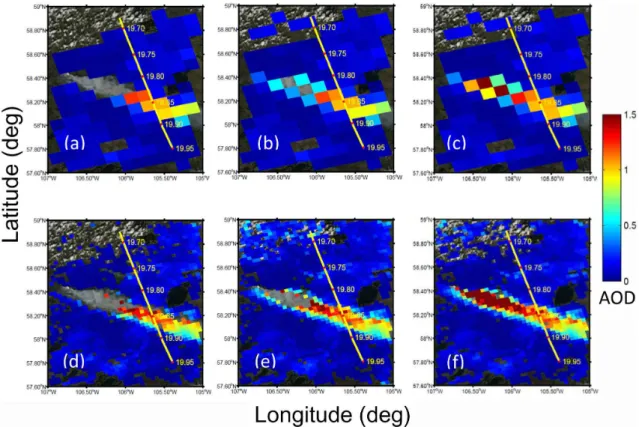
The results of MODIS AOD retrievals at 10 km and 3 km resolution are shown in Fig. 2 for three scenarios: (1) the standard operational retrieval (a, d), (2) aerosol cloud mask off (b, e), and (3) aerosol cloud mask and NDVI mask off (c, f). In each panel, the MODIS 553 nm AOD has been color-coded by magnitude and overlaid on the same RGB image shown in Fig. 1a; the P-3 flight track is shown for refer-ence. Regions with no color-coded AOD are those for which there was no MODIS AOD retrieval, and it is clear that the standard operational retrieval algorithm masks a significant number of grid cells in the heart of the smoke plume at both 10 km (Fig. 2a) and 3 km (Fig. 2d) resolution. Comparison of the corresponding panels (b, e and c, f) for retrieval sce-narios 2 and 3 reveals that application of both the aerosol cloud mask and the NDVI mask limited the number of re-trievals within the smoke plume, especially west of the
P-3/AATS track. Fortunately, however, our focus in this paper is on those grid cells that intersect the P-3 flight track, and we note that the MODIS operational retrieval algorithm ac-tually retrieved AOD in all 10 km grid cells located along that segment of the P-3 flight track inside the smoke plume. However, it failed to retrieve AOD in two 3 km grid cells in the heart of the plume along the flight track due to applica-tion of the aerosol cloud mask. There were also two 3 km grid cells with no AOD retrieval along the flight track south of the plume. However, the AATS cloud filter also identified the region just south of the plume as cloud-contaminated, and this is reflected in missing AOD data points at∼58.03◦N in
Fig. 1c.
We present detailed results of the MODIS–AATS com-parisons in Fig. 3, and list corresponding parameters for the AOD retrievals in each 10 km grid cell along the P-3 flight track in Table 1. Panels 3a, c, d, and e show results for the MODIS standard (cloud mask and NDVI mask on) AOD re-trievals only, while panel b includes MODIS AOD spectra retrieved with and without the cloud and NDVI masks. The locations of the AOD color-coded MODIS 10 km retrieval
J. M. Livingston et al.: Comparison of MODIS 3 km and 10 km resolution aerosol optical depth retrievals 2023
Fig. 2.Overlay of P-3 flight track and color-coded MODIS AOD retrievals at 553 nm at 10 km(a–c)and 3 km(d–f)resolution on RGB
image for the 19.85 UT overpass on 30 June 2008. Results for MODIS C006(a, d)operational retrieval,(b, e)retrieval with aerosol cloud
mask off, and(c, f)retrieval with both aerosol cloud mask and NDVI mask off.
grid cells (red) and the 3 km cells (green) that intersect the P-3 track are plotted in Fig. 3a, in addition to all 3 km cells (black) that intersect a 10 km cell but not the P-3 track.
In Fig. 3b, we superimpose corresponding calculated AATS and retrieved MODIS AOD spectra in cells 2–13 of the 13 intersecting MODIS 10 km grid cells. Cell 1, the northernmost cell, has been omitted to maximize the size of the display. AODs are shown only for the three short-est MODIS wavelengths and for the seven AATS channels between 354 and 675 nm. As noted in Sect. 3.1 above, in this and subsequent spectral AOD plots, we purposely show the calculated AATS AODs without any adjustment for the estimated AOD below the P-3 altitude. However, Table 1 lists AATS AOD at 553 nm and AE before and after ad-dition of the estimated below-aircraft AOD. MODIS spec-tra are shown for the standard retrievals and with the cloud and NDVI masks off, and the spectra are color-coded using the same color scheme as that used in Fig. 1b. Plots are ar-ranged and labeled numerically from north to south along the P-3 flight track. The AATS data points represent the mean of all cloud-free AATS retrievals within each corre-sponding MODIS grid cell; the vertical bars give the sample standard deviation (wide horizontal ticks) and range (narrow ticks) within the cell. Typically, AATS measurement uncer-tainties for an individual observation were much less than
either the sample standard deviation or the range of AATS-derived AOD for a particular MODIS grid cell. The verti-cal bars plotted on the standard MODIS retrievals represent the EE,±(0.05 + 0.15 AOD), for the over-land AOD retrieval
(Remer et al., 2005; Levy et al., 2010). All standard MODIS AOD retrievals yield a QF of 3 (Table 2) and used a moder-ately absorbing fine-mode aerosol (type 2, not listed in Ta-ble 2).
MODIS AODs agree with AATS values (calculated before the addition of estimated AOD below the aircraft) to within the MODIS EE in most 10 km grid cells that are shown in Fig. 3b. In particular, MODIS retrievals agree with the ad-justed AATS AODs to within EE in 77 % (10 of 13) 10 km grid cells (Table 2). Examination of Table 1 reveals that the two 10 km grid cells (numbers 7 and 8 in the heart of the plume in Fig. 1b) with the largest MODIS and AATS AODs are among the 10 cells in agreement. The MODIS aerosol cloud mask deselected 49 and 16 0.5 km pixels, respectively, and the NDVI mask deselected an additional 15 and 3 0.5 km pixels, respectively, in these two grid cells. As indicated by the AOD values in Table 1, there is little difference between the MODIS retrievals performed with and without the cloud and NDVI masks. The difference between MODIS AODs and adjusted AATS AODs falls outside the MODIS EE only in cells 4, 9, and 10; these are discussed below.
(b)
(e)
(d)
(a)
AATS
AOD
(c)
42
Fig. 3.Results for 30 June 2008 AATS–MODIS coincidence.(a)Plan view map showing overlay of P-3 flight track (color-coded by AATS520 nm AOD), MODIS operational 10 km and 3 km retrieval grid cells intersecting the P-3 track, and MODIS 3 km (black) grid cells inter-secting the 10 km grid cells.(b)MODIS (colored symbols and lines follow same color scheme as in Fig. 1b) and unadjusted AATS (black
circles) AOD spectra within the 10 km grid cells. Cell number is given in the upper left of each panel, and the MODIS retrieval quality flag QF is listed in the upper right. The northernmost cell, cell 1, has been omitted to maximize the display. Vertical bars on the AATS AOD points represent±1 sample standard deviation (wide ticks) and range (narrow ticks) of AOD within each cell. MODIS AOD spectra are
shown for the operational retrieval (colored squares with solid line) and for the retrieval with the aerosol cloud mask and the NDVI mask off (colored cross symbols with dashed line).(c)Latitudinal variation of 553 nm AOD for AATS (blue circles before and blue dots after
addition of below-aircraft AOD estimate), for MODIS 10 km (red) and 3 km (green) operational retrievals along the P-3 track, and for mean
±1 standard deviation MODIS 3 km retrievals (black) within each 10 km cell.(d, e)Scatterplots of the data shown in(c). Dashed lines
in(e)represent the one-to-one MODIS/adjusted AATS AOD correspondence, and±1 standard deviation boundaries of the MODIS AOD
expected errors (EE, defined in text). The AATS values in(e)include below-aircraft AOD estimated from the HiGEAR data.
First, we focus on the individual data points while momen-tarily ignoring the MODIS uncertainty bars. The MODIS AOD spectrum in cell 2 (58.69◦N, north of the smoke plume)
underestimates the mean AATS spectrum by∼0.05 (0.012
vs. 0.059) at 553 nm. We do not have a definitive expla-nation for this difference, but for an AOD loading as low as that measured by AATS, even a small error in the
sur-face reflectivity assumed by the MODIS retrieval algorithm can yield an AOD uncertainty at least as large as the ob-served MODIS–AATS AOD difference. The MODIS RGB image (Fig. 1) indicates that there were some clouds in cells 1 and 2, but the AATS data in both cells have been cloud-screened, and since resultant AOD spectra along the flight track through the two cells are essentially equal (cf. Fig. 3b,
J. M. Livingston et al.: Comparison of MODIS 3 km and 10 km resolution aerosol optical depth retrievals 2025
c, and Table 1), there is no indication that the AATS spec-tra are cloud-contaminated. We note that in cell 1 (spectrum not shown) the MODIS 553 nm AOD (0.092) exceeds the AATS AOD by about 0.03, but we cannot say whether this is due to residual cloud or cloud effects. In any event, the MODIS–AATS AOD differences are within the MODIS EE in both cells 1 and 2. MODIS AOD in cell 4 (58.51◦N, north
of the smoke plume) overestimates AATS AOD by greater than the EE, and there are at least two plausible explana-tions for the overestimate. The MODIS retrieval may still in-clude residual cloud-affected reflectances, perhaps evidenced by the low MODIS AE of 0.62 versus 1.72 for the AATS spectrum. However, we note again the finding of Levy et al. (2010) that the MODIS AE does not contain reliable par-ticle size information. Secondly, the RGB image in Fig. 1 indicates that MODIS may have actually measured aerosol in the western portion of grid cell 4, whereas AATS would not have seen this aerosol, because the P-3 track traversed only the far eastern portion of the MODIS grid cell. Although the agreement between MODIS and AATS AOD data points seems particularly good in cells 5–8 (including cells 7 and 8 in the center of the plume), the MODIS spectrum in cell 8 is much flatter (AE = 0.62) than the corresponding AATS spectrum (AE = 2.15). As shown in Table 1, MODIS AODs significantly underestimate the AATS values (by∼60 %) in
the two southernmost cells (9 – dark green; 10 –light green) that intersect the smoke plume, but this can probably be ex-plained by a combination of horizontal inhomogeneity within the plume and different instrument sampling regions. In par-ticular, cell 9 includes a large region of less optically dense smoke, whereas AATS viewed through the heart of the plume along the P-3 track in the far eastern portion of the MODIS cell. A large portion of cell 10 was outside the smoke plume, but similar to the AATS measurements along the P-3 track through cell 9, AATS viewed the Sun through much greater smoke concentrations located only in the northeastern por-tion of cell 10. This was also the region where some AATS data points were excluded by the AATS cloud filter. As can be seen in Fig. 3c and e (less obvious), the MODIS retrieval plus EE in cell 10 barely falls below the AATS mean value.
We show the latitudinal variation of AOD in Fig. 3c by overplotting MODIS AODs retrieved at 553 nm at both spa-tial resolutions and AATS AODs (with and without the ad-dition of estimated AOD below the aircraft) interpolated to 553 nm. Also plotted are values of the mean and standard deviation of the MODIS retrievals in all 3 km grid cells inter-secting each 10 km cell. MODIS retrievals at both resolutions successfully track the plume. A scatterplot of MODIS 3 km vs. MODIS 10 km AOD (553 nm) is presented in Fig. 3d, where the mean (symbol) and sample standard deviation (vertical bar) AODs have been calculated from all MODIS 3 km retrieval grid cells intersecting each 10 km grid cell. The comparison yields a high coefficient of determination (R2) of 0.986 (with apvalue of 0.000), a mean difference of 6.8 %, and a root-mean-square difference (RMSD) of 26 %
(rightmost columns of Table 2). Figure 3e presents corre-sponding scatterplots of MODIS 3 km and 10 km retrievals versus the mean of the adjusted AATS AODs (labeled AOD AATS adj HG) calculated within the 3 km and 10 km MODIS grid cells. The dashed line represents the 1:1
correspon-dence, and the dashed curves the 1 standard deviation ex-pected MODIS over-land AOD retrieval uncertainties. The MODIS EE curves (Remer et al., 2005; Levy et al., 2010) for the 10 km retrievals are defined above in this section; the EE curves for the 3 km retrievals equal±(0.05 + 0.25 AOD)
(Remer et al., 2013). The statistical measures (Table 2) are not remarkably different for the MODIS 10 km and 3 km retrievals with the cloud and NDVI masks on and off (not shown). Comparing the AATS and MODIS (cloud mask on) retrievals, we find that the 35 3 km and 13 10 km MODIS re-trievals yield statistically significant (pvalues = 0.000) high R2values. About 88 % (31 of 35) of the 3 km AOD retrievals agree with AATS AODs to within the MODIS EE, which exceeds the 77 % agreement (noted above) for the 10 km re-trievals. Examination of the data in Table 2 indicates that the 3 km retrievals yield larger values of bias (+0.035,+16.3 %
vs.−0.025,−9.8 %) and RMSD (0.13, 58 % vs. 0.08, 32 %)
than do the 10 km retrievals.
3.3 2 July 2008
In this section, we compare AATS AODs derived from mea-surements acquired on 2 July during the time period 19.7– 20.5 UT with AODs retrieved from collocated MODIS mea-surements taken during an Aqua overpass at 19.58 UT. Dur-ing this time, the P-3 performed various cross-plume and along-plume maneuvers at altitudes 210–420 m a.g.l. to sam-ple smoke originating from two separate fires. This case is particularly challenging for comparing AATS and MODIS AOD retrievals due to scattered clouds above the smoke. This is evident in Fig. 4, in which we superimpose on the MODIS RGB image the locations of the P-3 flight track and the MODIS 10 km retrieval grid cells for the operational re-trieval and for rere-trievals with either the aerosol cloud mask off or with the aerosol cloud and NDVI masks off (see below and Fig. 4 caption for details).
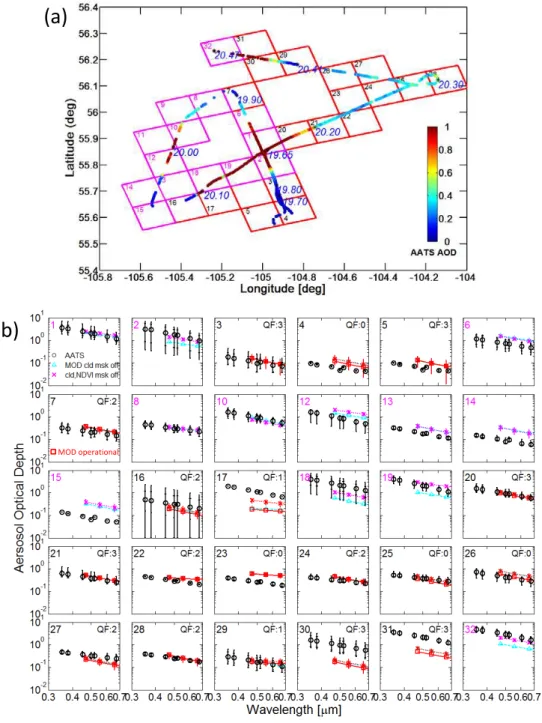
The locations of the MODIS 10 km grid cells and the color-coded, cloud-screened AATS 520 nm AOD along the P-3 flight track are superimposed in Fig. 5a. The MODIS grid cells have been numbered in chronological order along the P-3 flight track for comparison of MODIS and AATS AOD spectra in Fig. 5b. For those few MODIS grid cells that included multiple P-3 flight intersections at different times and in different directions, we have used the time of the first intersection to order each cell. Red cell boundaries with black cell numbers identify those cells (18 total) for which the MODIS standard operational algorithm produced an AOD retrieval; magenta cell boundaries and numbers des-ignate cells for which the algorithm produced a retrieval only with the aerosol cloud mask (or with the cloud mask and the
43
Fig. 4.Aqua MODIS RGB image for the overpass at 19.58 UT on 2
July 2008, with overlay of locations of the P-3 flight track (yellow) and the MODIS 10 km resolution aerosol retrieval grid cells (red for a retrieval with the MODIS operational algorithm, and magenta for a retrieval only for the cloud mask or the cloud and NDVI masks off).
NDVI mask) off. MODIS and unadjusted AATS AOD spec-tra for 30 of the 32 grid cells shown in Fig. 5a are plotted in Fig. 5b (cells 9 and 11, for which there was no MODIS AOD retrieval with the masks on, have been omitted to fa-cilitate display of the multipanel plot). MODIS spectra are displayed for retrievals with cloud mask off, with cloud and NDVI masks off, and (for the 18 cells referenced above), for the operational retrievals (i.e., with both masks on). Each panel is annotated with the cell number and the MODIS re-trieval QF for the standard (i.e., masks on) rere-trieval. Quality flag values are not meaningful, and hence are not shown for the retrievals with the masks off. Based on the MODIS RGB image in Fig. 4 and the magnitude of the AATS AOD spec-tra in Fig. 5b, we conclude that smoke dominated the AATS measurements in 12 of the 30 cells displayed in Fig. 5b: cells 30–32 in the far north; 10 and 12 (and also cells 9 and 11 not shown) in the west; and 1, 2, 6, and 17–20 in the center. We note that all MODIS retrievals used a moderate-absorption fine-mode aerosol type.
We include MODIS AOD retrieved with the aerosol cloud mask off and with the cloud and the NDVI masks off in Fig. 5b and Table 1 to suggest that although the standard MODIS retrieval algorithm failed to retrieve AOD in the heart of the plumes due to clouds, there might be information in the MODIS reflectances. We call the reader’s attention to the MODIS “cloud-contaminated” AOD spectra in Fig. 5b in the heart of the eastern plume in cells 1, 2, 17, 18, and 19, and even in cells 8 and 10 of the western plume. It is beyond the scope of this paper to pursue extracting aerosol information from these “cloud-contaminated” MODIS retrievals. Further-more, although we show these MODIS retrievals, and at least in that sense, do compare them with the AATS values, we do
not include them in AOD scatterplots in subsequent figures or in the statistics listed in Tables 2 and 3. This is because the 2 July coincidence region was obviously greatly affected by clouds in addition to smoke, unlike the 30 June region, for which a well-defined smoke plume was located in clear-to-mostly-clear sky.
In Fig. 6 we take a more detailed look at the MODIS– AATS AODs presented in Fig. 5b by displaying various pa-rameters as a function of cell number for all 32 cells high-lighted in Figs. 4 and 5a. Results are shown for the MODIS operational retrievals and for the retrievals with the aerosol cloud mask off, but not for retrievals with both the aerosol cloud and the NDVI masks off. In Fig. 6a we plot mean AATS interpolated 553 nm AODs, both with and without addition of the in situ estimate of the below-aircraft AOD, and the corresponding MODIS minus AATS AOD differ-ences with and without below-aircraft AOD. We note that the below-aircraft AOD estimates are very large (up to 1) in the heart of the eastern plume in cells 1, 2, and 16–20, and significant in cell 6 of the eastern plume and in cells 10–12 of the western plume. We cannot validate these estimates, but we recognize that the very large values may be suspect, es-pecially for cases when the smoke plumes do not extend ver-tically to the ground as our extrapolation method assumes. In Fig. 6b we plot AATS AOD AE (calculated without the ad-dition of estimated below-aircraft AOD) and corresponding MODIS minus AATS AE differences. The standard MODIS AOD retrieval QF values are given in Fig. 6c; the number of pixels used in the MODIS retrieval for each cell, and also the number of AATS AOD measurements within each cell, are given in Fig. 6d.
AATS mean AODs (Fig. 6a) and AE (Fig. 6b) are pos-itively correlated, with R2=0.52 and a p value of 0.000. Because the AATS data processing cloud filter, which re-lies both on raw signal variation during the 3 s sampling period and on spectral AOD shape, may not remove all cloud-contaminated measurements for spatially homoge-neous clouds, such as thin cirrus with small OD compared to the total AOD (Redemann et al., 2005), we cannot say with absolute certainty that all cloud-affected data points have been removed from the 2 July measurements. However, the relative contribution of residual cloud to the total AOD is likely quite small, as AATS AE exceeded 0.95 in all 32 cells, and the cells (1, 2, 10–12, 17–20, 30–32) with the largest mean AOD values had AE > 1.7. The MODIS AE values show no correlation with the AATS values (see also Table 3), but this is not surprising in light of the above-mentioned find-ing by Levy et al. (2010). Hence, we focus on comparison of MODIS and AATS AOD.
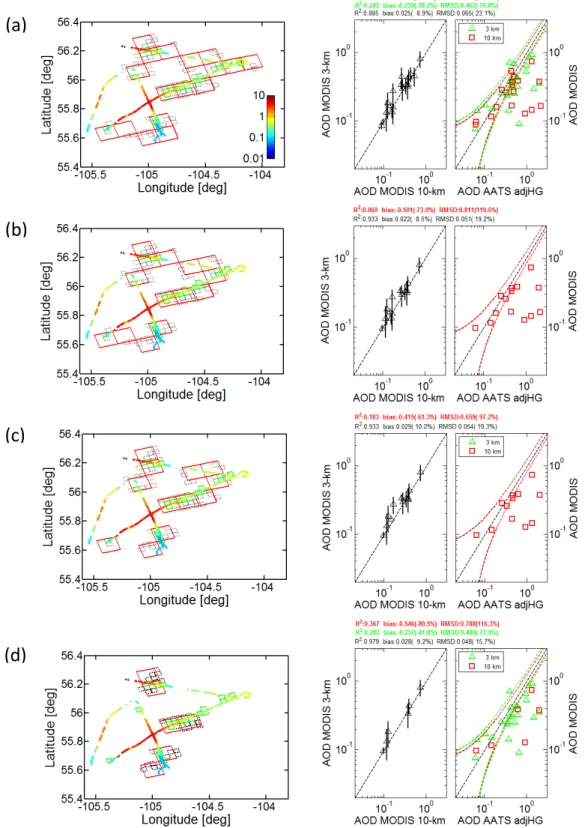
In Fig. 7 we examine the operational MODIS AOD re-trievals as a function of the MODIS retrieval QF: (a) QF≥0,
(b) QF≥1, (c) QF≥2, and (d) QF = 3. The AATS-AOD
color-coded P-3 flight track is superimposed on the loca-tions of the MODIS 10 km and 3 km retrieval grid cells in the left panels, analogous to Fig. 3a. Scatterplots of MODIS
J
.
M.
Li
vingston
et
al.:
Compa
rison
of
MODIS
3
km
and
10
km
resolution
aer
osol
optical
depth
retrie
v
als
2027
Table 3.Summary of parameters and statistics for MODIS/AATS Ångström exponent comparisons.
Date MODIS Ångström exponent (MODIS–AATS) Ångström exponent (MODIS–adjusted AATS) (satellite) Cell res. Aerosol Retrieval Total No. R2 pval Mean difference RMSD R2 pval Mean difference RMSD
[km] cloud mask qual. flag cells Abs. Rel. (%) Abs. Rel. (%) Abs. Rel. (%) Abs. Rel. (%) 30 June (Aqua) 10 on 3 13 0.339 0.037 −0.276 −15.6 0.675 38.0 0.332 0.039 −0.308 −17.1 0.683 37.8
3 on 3 35 0.067 0.133 −0.401 −22.9 0.723 41.3 0.056 0.169 −0.435 −24.4 0.736 41.2
2 July (Aqua) 10 on all 18 0.034 0.461 0.118 8.7 0.595 44.1 0.005 0.775 0.023 1.6 0.555 38.4 3 on all 25 0.087 0.153 0.173 12.7 0.432 31.8 0.086 0.155 0.083 5.7 0.397 27.4 10 on 3 6 0.076 0.598 0.193 14.3 0.323 24.0 0.121 0.499 0.116 7.3 0.252 15.9 3 on 3 23 0.094 0.154 0.153 11.2 0.434 31.8 0.102 0.138 0.058 4.0 0.399 27.3
3 July (Terra, Aqua) 10 on 3 18 0.001 0.897 −0.263 −15.5 0.567 33.3 0.000 0.989 −0.277 −16.2 0.574 33.5
3 on 3 66 0.002 0.726 −0.370 −21.8 0.660 38.8 0.003 0.641 −0.384 −22.4 0.667 39.0
9 July (Aqua) 10 on all 9 0.030 0.657 −0.294 −19.3 0.500 32.8 0.047 0.575 −0.312 −20.2 0.509 33.0
10 on 3 3 0.928 0.172 −0.298 −19.5 0.457 29.9 0.860 0.244 −0.317 −20.6 0.461 29.9
3 on 3 (all = 3) 8 0.017 0.762 −0.378 −25.2 0.583 38.8 0.044 0.619 −0.397 −26.1 0.592 38.9
Aggregated
All dates 10 on all 58 0.022 0.262 −0.153 −9.7 0.592 37.5 0.011 0.426 −0.196 −12.1 0.585 36.0
3 on all 134 0.008 0.298 −0.277 −17.0 0.637 38.9 0.005 0.414 −0.311 −18.6 0.641 38.4
10 on 3 40 0.065 0.111 −0.201 −12.7 0.569 36.0 0.057 0.140 −0.231 −13.5 0.570 33.3
3 on 3 132 0.006 0.375 −0.288 −17.5 0.640 39.0 0.003 0.523 −0.321 −19.2 0.644 38.4
All except 2 July 10 on all 40 0.016 0.434 −0.274 −16.3 0.591 35.1 0.012 0.500 −0.295 −17.3 0.598 35.1
10 on 3 34 0.049 0.208 −0.271 −16.1 0.602 35.7 0.041 0.250 −0.292 −16.9 0.609 35.2
3 on 3 (all = 3) 109 0.006 0.438 −0.381 −22.4 0.675 39.7 0.003 0.571 −0.401 −23.3 0.685 39.8
www
.atmos-chem-ph
ys.net/14
/2015/2014/
Atmos.
Chem.
Ph
ys.,
14,
2015–
2038
,
(a)
(b)
MOD operational
44
Fig. 5.For 2 July:(a)overlay of color-coded (by AATS 520 nm AOD) P-3 flight track and locations of the MODIS 10 km grid cells for
retrievals with (red cell boundaries with black cell numbers) and without (magenta cell boundaries and numbers) the aerosol cloud mask (or the cloud and NDVI masks);(b)unadjusted AATS and MODIS AOD spectra. As explained in the text, retrieval quality flags are valid and
shown only for MODIS operational retrievals.
and AATS AODs are presented in the rightmost panels, anal-ogous to Fig. 3d and e. Although only a few 3 km retrievals intersect each 10 km grid cell, the MODIS results at these two resolutions are mutually consistent, as shown in the left scatterplots and in Table 2. Of 18 10 km retrievals, only 12 had QF≥2 and only 6 had the highest QF = 3. If we
com-pare the MODIS and AATS AODs (AATS values adjusted for the below-aircraft AOD), only 43 % of the MODIS 10 km
retrievals with values of QF≥1 and 33 % (two of six) of those
with QF = 3 fall within the MODIS EE. Most of the MODIS retrievals with QF≥1 underestimate AATS AOD by greater
than the EE (see Table 2, column labeled “< AATS AOD”); however, none of them overestimates AATS AOD. Values of R2increase with increasing QF, butR2is still only 0.37 for the six QF = 3 retrievals, and with a correspondingpvalue of 0.202, even this is not statistically significant. MODIS
J. M. Livingston et al.: Comparison of MODIS 3 km and 10 km resolution aerosol optical depth retrievals 2029
black,
(a)
(b)
(c)
(d)
45
Fig. 6.For 2 July: parameters pertaining to the comparison of MODIS 10 km retrievals and AATS AOD as a function of the 10 km retrieval
grid cell numbers shown in Fig. 5.(a)AATS AOD (right axis scale) before (black solid triangles and dashed line) and after (black open
triangles and dotted line) addition of the below aircraft AOD estimates, corresponding MODIS minus AATS AOD differences (left axis scale) for the MODIS operational retrievals (red circles – unadjusted AATS AOD; magenta squares – adjusted AATS AOD) and for the special MODIS retrievals (blue crosses and dashed line – unadjusted AATS AOD; cyan crosses and dashed line – adjusted AATS AOD) with the aerosol cloud mask off.(b)Calculated AE values for unadjusted AATS (black, right axis scale), and MODIS minus AATS AE differences
(red – MODIS operational; blue – MODIS aerosol cloud mask off, left axis scale).(c)MODIS quality flags for the operational retrievals.(d)
Number of 0.5 km resolution pixels (left axis scale) used in the MODIS 10 km retrieval (red for operational retrieval, blue for retrievals with aerosol cloud mask off), and number of AATS AOD measurements (black, right axis scale) within each 10 km grid cell.
AOD retrievals significantly underestimate the AATS values by 60–80 % at 10 km resolution and∼40 % at 3 km
resolu-tion. It is likely that the negative biases occur because the MODIS algorithm preferentially retrieves AOD from pixels in the non-smoky part of the cells. Values of the mean dif-ference and RMSD are not markedly different for different ranges of QF included. Of only 25 retrievals at 3 km resolu-tion, 23 had QF = 3 and the other 2 had QF = 0. Of those with QF = 3, 43 % fall within MODIS EE when compared with the AATS values, but 52 % underestimate AATS AOD by greater than the EE. Mean MODIS–AATS differences were∼40 %,
with RMSD values of∼77 %, both of which are smaller than
for the 10 km retrievals.
3.4 3 July 2008
On 3 July there were separate AATS-MODIS Terra and AATS-MODIS Aqua coincidences near 55.7◦N, 112.2◦W
in east-central Alberta. As shown in Fig. 8, the MODIS Terra overpass occurred at 18.50 UT, and coincident AATS measurements were taken during a NW–SE horizon-tal transect at a mean ±1 standard deviation altitude
of 0.176±0.054 km a.g.l. during the time period 18.45–
18.7 UT. The MODIS Aqua overpass occurred at 20.33 UT,
and AATS measurements were acquired during the period 20.40–20.66 UT along a P-3 flight track that included a short longitudinal transect followed by a series of constant altitude circles, with a mean altitude for the entire flight segment of 0.203±0.041 km a.g.l. The weather was clear for both
flight segments, and the measured AODs were small, with AATS mid-visible AODs 0.21–0.26 for the Terra overpass and 0.22–0.24 for the Aqua overpass. Shinozuka et al. (2011) characterized the aerosol as an outflow of smoke with no dis-tinguishable plume. In Fig. 8, we show the MODIS RGB image, the P-3 flight track, and the MODIS 10 km AOD re-trieval grid cells for the two MODIS overpasses.
In Fig. 9, we compare AATS measurements with MODIS operational AOD retrievals within 12 MODIS 10 km reso-lution AOD retrieval grid cells and 44 3 km grid cells for the Terra overpass. The P-3 flight track color-coded by the AATS 520 nm AOD and the locations of the MODIS 10 km and 3 km resolution grid cells are superimposed in Fig. 9a. Corresponding MODIS and AATS AOD spectra within each 10 km grid cell are plotted in Fig. 9b. Analogous to the spec-tra shown in Figs. 3 and 5, the AATS AODs in Fig. 9b have not been increased to account for estimated AOD below the aircraft altitude (but results for both adjusted and unadjusted AATS AODs are included in Tables 1–3). The latitudinal
retrievals: (a) QF≥0, (b) QF≥1, (c) QF≥ 2, (d) QF=3.
(a)
(d)
(c)
(b)
46
Fig. 7.For 2 July: map overlays and MODIS 3 km/10 km and MODIS/AATS AOD scatterplot results for different values of the MODIS
retrieval quality flag for the MODIS operational AOD retrievals:(a)QF≥0,(b)QF≥1,(c)QF≥2, and(d)QF = 3. Retrievals at 3 km
resolution have been omitted from the scatterplots in(b)and(c)for clarity, because 23 of 25 3 km retrievals yielded QF = 3 and the remaining
2 yielded QF = 0.
J. M. Livingston et al.: Comparison of MODIS 3 km and 10 km resolution aerosol optical depth retrievals 2031
(a)
(b)
47
Fig. 8.Overlays of MODIS RGB image with 10 km retrieval grid
cell and P-3 flight track locations for(a)Terra overpass at 18.5 UT
and(b)Aqua overpass at 20.3 UT on 3 July 2008.
variation of AOD at 553 nm for the MODIS 10 km and 3 km resolution retrievals, as well as for mean spectrally interpo-lated AATS AODs before and after correction for the esti-mated AOD (∼0.02) below the aircraft, are shown in Fig. 9c.
AATS AODs significantly exceeded MODIS retrievals at both resolutions over most of the flight track. In fact, the difference between MODIS AODs and AATS AODs ad-justed for the below-aircraft amount was 0.08–0.15 in 8 of 12 10 km grid cells. All MODIS retrievals yield a retrieval QF of 3 (very good) and used a moderate-absorption fine-mode aerosol. A scatterplot of MODIS 3 km and 10 km retrievals is presented in Fig. 9d, with anR2of 0.90 (pvalue = 0.000), a mean difference∼0 (−0.1 %), and an RMS difference of
0.02 (14 %). The corresponding scatterplot of MODIS AOD versus AATS AOD (corrected for below-aircraft AOD) is shown in Fig. 9e. Not surprisingly, values of R2 are low (0.27 for 10 km and 0.14 for 3 km), and MODIS-minus-AATS mean differences (−0.06/∼ −27 %) and RMS
dif-ferences (0.08/∼36 %) are large, with little difference
be-tween the 3 km and 10 km results. Despite the relatively large MODIS–AATS AOD differences, 50 % of the MODIS 10 km retrievals and 59 % of the 3 km retrievals fall within the MODIS EE. The remainder underestimate AATS AOD by greater than the EE.
In Fig. 10 we present an analogous set of plots for the MODIS–AATS AOD comparison for the Aqua overflight at 20.33 UT. AATS data were acquired within 22 3 km and 6 10 km MODIS grid cells, although the majority of AATS measurements were taken within the four 10 km cells cen-tered east of 112.4◦W, as shown in Fig. 10a. MODIS AODs
underestimate the adjusted AATS values by∼0.08 within the
two easternmost 10 km cells and within nine 3 km cells cen-tered between longitudes 112–112.4◦W. MODIS retrievals
agree with the mean of the adjusted AATS values to within the EE in 83 % (5 of 6) of 10 km grid cells and 73 % (16 of 22) of 3 km grid cells. MODIS AODs underestimate AATS values by greater than the EE in the remainder of the grid cells. The correlation (R2=0.82, p value = 0.013) be-tween the MODIS 3 km and 10 km AOD retrievals is slightly poorer, the mean difference the same, and the RMS differ-ence slightly smaller (0.015 vs. 0.022) than for the MODIS Terra overpass in the same general region about 3 h earlier. The MODIS–AATS AOD comparisons for the 10 km and 3 km retrievals exhibit no correlation (R2< 0.01), with mean difference values of∼ −0.035 (−15 %) that are about 40 %
smaller than the corresponding MODIS–AATS Terra nega-tive differences (∼ −0.06/−27 %), and RMS differences of
0.047 (21 %) and 0.060 (27 %) that are 42 % and 29 % less than the MODIS–AATS Terra values. The lack of MODIS– AATS correlation is expected because the spatial variation in AATS AOD is small compared to the MODIS uncer-tainty. As is the case for the MODIS Terra retrievals, all MODIS Aqua retrievals yield a retrieval QF = 3 and used a moderate-absorption fine-mode aerosol. We can think of two reasons why the Terra retrieval underestimates of AATS AODs might exceed the Aqua underestimates. First, by 2008, Terra measurements were subject to sensor calibration drift (Levy et al., 2010) that led to retrievals that not only underes-timate the true AOD but are also less than the corresponding Aqua AOD retrievals by up to ∼0.02, which (perhaps
co-incidentally) is very close to the 0.026 difference between the 10 km resolution Terra MODIS–AATS AOD mean dif-ference (−0.060) and the Aqua MODIS–AATS AOD mean
difference (−0.034). However, a more likely explanation, not
only for the differences between the magnitudes of the Terra and Aqua underestimates of AATS AOD but also for the Terra and Aqua underestimates of AATS AOD, is local vari-ability in surface reflectance properties and subsequent devi-ation from modeled spectral reldevi-ationships not accounted for by the MODIS retrieval algorithm.
3.5 9 July 2008
On 9 July the P-3 flew along a south–north track over southeastern Yukon Territory during the time period 19.515– 19.713 UT just prior to a MODIS Aqua overpass at 19.75 UT. The locations of the P-3 flight track and the MODIS 10 km AOD retrieval grid cells are superimposed on the MODIS RGB image in Fig. 11. The flight included a descent from
(a)
(b)
(d)
(e)
(c)
48
Fig. 9.Multipanel figure for 03 July Terra MODIS–AATS AOD comparison. Figure is analogous to Fig. 3 except MODIS 10 km grid cells in (a)have been color-coded to match the MODIS AOD spectra shown in(b), and MODIS spectra are shown only for the operational MODIS
retrieval.
600 to 120 m a.g.l. from 19.51 to 19.55 UT during the brief westward and southward portion of the track, followed by a turn to the north and a general S–N transect at relatively con-stant altitude (148±21 m a.g.l.) from 19.55 to 19.69 UT, and
finally an ascent to ∼580 m a.g.l. from 19.69 to 19.71 UT.
The region was dominated by smoke and scattered clouds above the aircraft, both evident in Fig. 11.
In Fig. 12 we examine the MODIS and AATS AODs in detail, and this is analogous to Figs. 3, 9, and 10. As shown in Fig. 12a, the MODIS operational retrieval algo-rithm yielded AOD in nine intersecting 10 km cells along the P-3 track, but only eight intersecting 3 km cells (green). Missing data points along the flight track reflect AATS mea-surements that have been excluded by the AATS cloud filter. We plot the corresponding AOD spectra (arranged in chrono-logical order) in Fig. 12b. The red number in each panel gives the MODIS retrieval QF value, with only three very good
(= 3) and two good (= 2) retrievals among the nine 10 km re-trievals. MODIS AOD retrievals for the aerosol cloud mask off and for the cloud and NDVI masks off are not shown, but these are given in Table 1; values are little different from the operational retrievals.
As shown in Fig. 12c, the magnitude of the estimated AOD below the aircraft is almost negligible. The agreement be-tween MODIS and AATS 553 nm AOD is better than for the 2 July smoke/cloud case, with much smaller mean and RMS percentage differences than for the 2 July case. For the 9 July case, the MODIS 3 km retrievals yield a higher R2(0.73,pvalue = 0.007) and lower mean and RMS differ-ences than do the 10 km retrievals. MODIS AODs agree with the mean of the adjusted AATS values to within the EE in all eight 3 km grid cells, but in only four of nine 10 km grid cells for all QF and in one of three 10 km cells with QF = 3. The two 10 km cells exhibiting the largest disagreement are the