www.atmos-meas-tech.net/8/5277/2015/ doi:10.5194/amt-8-5277-2015
© Author(s) 2015. CC Attribution 3.0 License.
Implications of MODIS bow-tie distortion on aerosol optical depth
retrievals, and techniques for mitigation
A. M. Sayer1,2, N. C. Hsu1, and C. Bettenhausen1,3
1NASA Goddard Space Flight Center, Greenbelt, Maryland, USA
2Goddard Earth Sciences Technology And Research (GESTAR), Universities Space
Research Association (USRA), Columbia, Maryland, USA
3Science Systems and Applications Inc., Lanham, Maryland, USA
Correspondence to:A. M. Sayer ([email protected])
Received: 20 July 2015 – Published in Atmos. Meas. Tech. Discuss.: 18 August 2015 Revised: 4 December 2015 – Accepted: 7 December 2015 – Published: 17 December 2015
Abstract. The scan geometry of the Moderate Resolution Imaging Spectroradiometer (MODIS) sensors, combined with the Earth’s curvature, results in a pixel shape distor-tion known as the “bow-tie effect”. Specifically, sensor pix-els near the edge of the swath are elongated along-track and across-track compared to pixels near the centre of the swath, resulting in an increase of pixel area by up to a factor of ∼9
and, additionally, the overlap of pixels acquired from con-secutive scans. The Deep Blue and Dark Target aerosol opti-cal depth (AOD) retrieval algorithms aggregate sensor pixels and provide level 2 (L2) AOD at a nominal horizontal pixel size of 10 km, but the bow-tie distortion means that they also suffer from this size increase and overlap. This means that the spatial characteristics of the data vary as a function of satellite viewing zenith angle (VZA) and, for VZA>30◦, corresponding to approximately 50 % of the data, are are-ally enlarged by a factor of 50 % or more compared to this nominal pixel area and are not spatially independent of each other. This has implications for retrieval uncertainty and ag-gregated statistics, causing a narrowing of AOD distributions near the edge of the swath, as well as for data comparability from the application of similar algorithms to sensors without this level of bow-tie distortion. Additionally, the pixel over-lap is not obvious to users of the L2 aerosol products because only pixel centres, not boundaries, are provided within the L2 products. A two-step procedure is proposed to mitigate the effects of this distortion on the MODIS aerosol products. The first (simple) step involves changing the order in which pixels are aggregated in L2 processing to reflect geographical location rather than scan order, which removes the bulk of the
overlap between L2 pixels and slows the rate of growth of L2 pixel size vs. VZA. This can be achieved without significant changes to existing MODIS processing algorithms. The sec-ond step involves additionally changing the number of sensor pixels aggregated across-track as a function of VZA, which preserves L2 pixel size at around 10 km×10 km across the
whole swath but would require algorithmic quality assurance tests to be re-evaluated. Both of these steps also improve the extent to which the pixel locations a user would infer from the L2 data products represent the actual spatial extent of the L2 pixels.
1 Introduction
The Moderate Resolution Imaging Spectroradiometers (MODIS) aboard the Terra and Aqua platforms have been used to create data products for a range of earth science dis-ciplines, including analyses of the atmospheric aerosol bur-den. Mid-visible aerosol optical depth (AOD) data products have been generated routinely by a variety of dedicated al-gorithms over bright (Hsu et al., 2004, 2006, 2013) and dark (Kaufman et al., 1997; Levy et al., 2007, 2013; Hsu et al., 2013) land surfaces, ocean surfaces (Tanré et al., 1997; Levy et al., 2013), and as a by-product of algorithms for the at-mospheric correction of land/ocean surface reflectance (e.g. Ahmad et al., 2010; Lyapustin et al., 2011).
Aqua (hereafter MXD04 collectively). The latest version of MXD04 products (Collection 6, C6) contains data generated by the Deep Blue (DB) algorithms over land surfaces (Hsu et al., 2013), a Dark Target (DT) over-land algorithm, and an over-water algorithm which also uses wavelengths at which the water surface is dark (Levy et al., 2013). These L2 prod-ucts are generated from level 1b (L1b) calibrated radiance data measured by the MODIS instruments. To decrease noise in the retrieval and provide a manageable data volume, the standard L2 products are provided at a nominal horizontal pixel size of 10 km (referred to as “retrieval pixels”) com-pared to a L1b pixel size of 0.25–1 km (dependent on band, referred to as “sensor pixels”). As aerosol horizontal varia-tions are often on length scales of the order of tens of kilo-metres (e.g. Anderson et al., 2003), this pixel size should preserve the underlying spatial shape of aerosol fields with-out major smoothing of features. Note that a separate nomi-nal 3 km DT product is also available, albeit with larger un-certainties than the 10 km standard product (Munchak et al., 2013; Remer et al., 2013, Livingston et al., 2014).
However, a consequence of the MODIS scan geometry and Earth’s curvature, of which many users of MXD04 data may not be aware, is a distortion of pixel size and shape from the centre to the edge of the swath. This is known as the “bow-tie effect” and has the potential to alias into angle-dependent artefacts and changes in retrieval quality in the derived data sets. It also presents a challenge for the contin-uation of MODIS-like data sets using similar sensors such as the Visible Infrared Imaging Radiometer Suite (VIIRS) on the Suomi National Polar-orbiting Partnership (S-NPP) platform, launched in late 2011, for which these bow-tie dis-tortions are much smaller. Consequently, data sets gener-ated from similar algorithms may exhibit different angular-dependent characteristics.
The purpose of this study is to illustrate the influence of the MODIS bow-tie distortion on AOD retrievals and exam-ine some techniques for mitigation of these distortions, for potential application in future MODIS (or VIIRS) data re-processings. Section 2 discusses MODIS and its scan geom-etry, providing an illustration of the bow-tie effect and the dependence of MODIS AOD retrievals on view angle. Sec-tion 3 proposes a two-step soluSec-tion to mitigate these effects, of which the first step is relatively simple and could be ac-complished with minor changes to existing MODIS process-ing algorithms, while the second step would require more careful evaluation. Finally, Sect. 4 provides a discussion on the importance of the results.
2 Illustration of the problem
MODIS takes measurements in a total of 36 bands with cen-tral wavelengths between 412 nm and 14.4 µm (Barnes et al., 1998; Toller et al., 2013). The L1b data are organised into 5 min granules, which consist of 1354 pixels across-track and 203 scans along-track. The term “along-track” indicates the
Sub-satellite track
Along-track
Across-track (2,330 km swath)
One scan
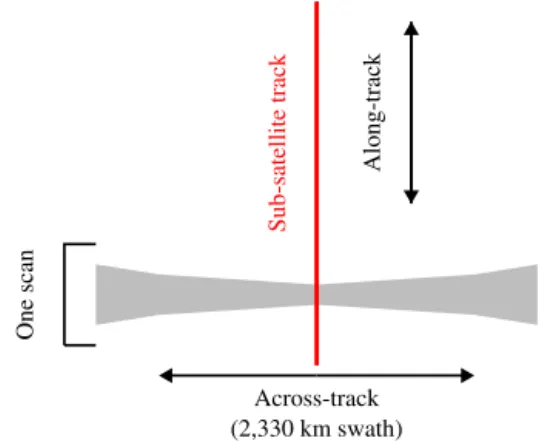
Figure 1.Illustration of some terms related to MODIS scan
geom-etry.
direction of the satellite flight track (for daytime data this is approximately from north to south for Terra and from south to north for Aqua, due to the satellites’∼98.2◦inclination), while “across-track” indicates the direction perpendicular to the flight track (alternating east–west and west–east for suc-cessive scans). This is illustrated in Fig. 1.
Each scan is approximately 10 km wide at nadir; there are 10 detectors for nominal 1 km bands, 20 detectors for 0.5 km bands, and 40 detectors for the two bands at nominal 0.25 km resolution. Note that these quoted nominal pixel sizes are only approximate, and this terminology is used for simplic-ity of understanding. Barnes et al. (1998) and Xiong et al. (2006) provide more details about MODIS spatial charac-terisation. The MODIS spatial response functions on a pixel level are not exactly square and have some slight blurring be-tween adjacent pixels. For example, pre-launch characterisa-tion of MODIS Terra revealed band 8 (centred near 412 nm), nominally of 1 km pixel size, had an effective across-track size around 1.08 km across-track and 1.01 km along-track. Distortions are band dependent and, for the bands relevant to AOD retrieval, of similar (fairly small) magnitude. In the present study pixel sizes (lengths) are approximated as half the distance between adjacent pixel centres in each direction. The error introduced by this approximation is much smaller than the distortion of pixel shape/size resulting from the bow-tie effect. Still it is worth bearing in mind that the represen-tation of sensor pixels (and coarser-resolution L2 data) as quadrilaterals is an idealisation. Campagnolo and Montano (2014) provide some more discussion and on-orbit charac-terisation of MODIS’s spatial performance from the point of view of land surface reflectance data products.
Figure 2.MODIS granule used as a case study throughout this manuscript. Panel(a)shows a true-colour composite,(b)the VZA along and
across the scans,(c)the L2 (nominal 10 km) Deep Blue retrieved AOD for the granule, and(d)the Deep Blue retrieval-pixel area.
(a) MODIS pixel growth vs. view angle
-70 -50 -30 -10 10 30 50 70
Viewing zenith angle, degrees 0
2 4 6 8 10
Effective pixel area, km
2 (b) View zenith angle histogram
0 10 20 30 40 50 60 70
Absolute viewing zenith angle, degrees 0.0
0.2 0.4 0.6 0.8 1.0
Cumulative fraction
Figure 3. (a)Area of nominal 1 km×1 km sensor pixels as a function of VZA, and(b)histogram of absolute VZA. The median is shown
with a dashed line. Data for the MODIS granule shown in Fig. 2.
native resolution for bands 8–36). DB uses the L1b data ag-gregated to 1 km while the DT algorithms use the L1b data at 0.5 km.
The L2 aerosol products are created by aggregating blocks of contiguous sensor pixels through one scan along-track and 10 1 km sensor pixels across-track (or 20 0.5 km pix-els for the appropriate bands in DT). The DB algorithms (Hsu et al., 2013) retrieve AOD from suitable (e.g. cloud-free snow-free) data at sensor-pixel resolution and then aggregate to retrieval-pixel resolution (a “retrieve-then-average” tech-nique), while the DT algorithms (Levy et al., 2013) average measured reflectance from suitable pixels and then perform a single retrieval at retrieval-pixel resolution (an “average-then-retrieve” technique). The two averaging methods should be equivalent when the underlying scene is homogeneous but not when there is surface or atmospheric heterogene-ity. Thus, the L2 aerosol products consist of 135 retrieval-pixel positions across-track and 203 along-track (the four ex-cess across-track nominal 1 km sensor pixels are discarded as 1354 does not divide evenly by 10). As the sensor scans across-track back and forth, the light observed by MODIS is reflected from a scan mirror onto the focal plane assemblies.
Dependent on the scan direction, both sides of this scan mir-ror are used. Differences in the quality of the characterisation of these two mirror sides can lead to striping in the data be-tween forward and reverse scans in some situations (Franz et al., 2007).
Because of this scan geometry the spatial resolution de-grades from nadir (viewing zenith angle (VZA) 0◦) to the
scan edge (VZA∼65◦), such that pixels near the edge of
the scan are larger than those near nadir; the swath width is
∼2330 km, despite the fact that there are only 1354
across-track sensor pixels. The primary distortion is across-across-track (i.e. pixels get longer in the longitudinal direction) but there is also an along-track (i.e. latitudinal) distortion, resulting in overlap between pixels from consecutive scans near the swath edges. These give a scan a shape similar to a bow tie, hence the term “bow-tie effect”.
(a) MODIS actual nominal 1/10 km pixels, odd scans
-5 -4 -3 -2
Longitude, degrees 29.1
29.2 29.3 29.4 29.5
Latitude, degrees
(b) MODIS actual nominal 1/10 km pixels, even scans
-5 -4 -3 -2
Longitude, degrees 29.1
29.2 29.3 29.4 29.5
Latitude, degrees
(c) MODIS actual nominal 1/10 km pixels, all scans
-5 -4 -3 -2
Longitude, degrees 29.1
29.2 29.3 29.4 29.5
Latitude, degrees
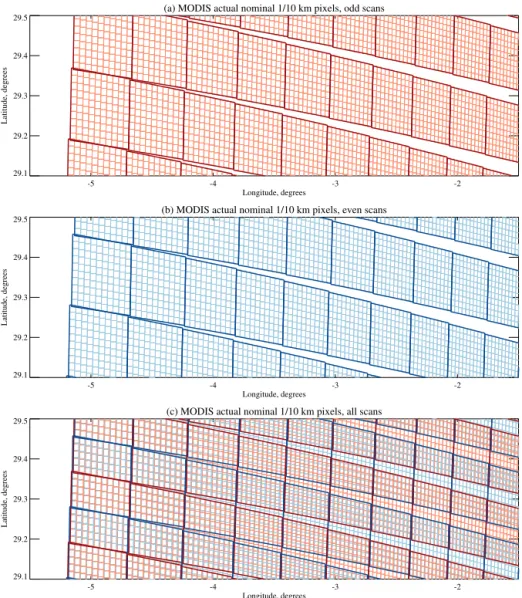
Figure 4.Borders of nominal 1 km sensor pixels (pale colours) and nominal 10 km retrieval pixels (strong colours) along the western edge
of the granule shown in Fig. 2, illustrating the overlap between scans near swath edges. Data from alternating forward/backward scans are shown in red and blue. Panel(a)shows odd-numbered scans only,(b)even-numbered scans only, and(c)all scans.
results in a retrieval-pixel area of ∼100 km2 near the
cen-tre of the swath, as the VZA increases, the pixel area is in-creased by almost a factor of 10 at the extreme edges of the swath. Figure 3 shows that the median absolute VZA is about 30◦, for which pixel area is increased by around∼50 %
com-pared with VZA=0◦. Hence, although the MODIS aerosol
retrieval-pixel size is commonly stated to be 10 km×10 km,
half the time the actual area encompassed by these retrieval pixels is at least 50 % larger than that. Note that the sign of VZA in Fig. 3 is defined such that positive values are found on the western side of the swath.
Taking a closer view of the area near the western edge of the swath, Fig. 4 shows the ground locations of the sensor and retrieval pixels. Scans are coloured alternating in red and blue (odd scans in red, even in blue). Two factors are im-mediately apparent. One is the strong elongation of pixels in
the across-track (longitudinal) direction. The second is that, at the swath edge, successive scans (e.g. a red-coloured scan and the blue-coloured scans immediately before and after it) are fully overlapped in the along-track direction. Each edge-of-swath retrieval covers half of the area of the retrieval pixel from the scan before it and half of the area from the scan after it (i.e. they are fully overlapping). Even 10 retrievals in from the scan edge the retrieval pixels are more than half overlapped between successive scans. This therefore repre-sents a sizeable fraction of the MXD04 data, particularly in terms of area covered.
MODIS actual and apparent (L2) 10 km pixels
-5 -4 -3 -2
Longitude, degrees 29.1
29.2 29.3 29.4 29.5
Latitude, degrees
Figure 5.Borders of nominal 10 km retrieval pixels (strong colours, as in Fig. 4c) along the western edge of the granule shown in Fig. 2.
Pixel centres are overplotted with coloured asterisks, and inferred L2 pixel bounds are drawn in black lines.
(a) Deep Blue arid
0.0 0.2 0.4 0.6 0.8 1.0
550 nm AOD 0.0001
0.0010 0.0100 0.1000 1.0000
Fraction of data
VZA<10o VZA>55o
(b) Deep Blue vegetated
0.0 0.2 0.4 0.6 0.8 1.0
0.0 0.0 0.0 0.0 0.0 0.0
550 nm AOD 0.0001
0.0010 0.0100 0.1000 1.0000
Fraction of data
(c) Dark Target land
0.0 0.2 0.4 0.6 0.8 1.0
0.0 0.0 0.0 0.0 0.0 0.0
550 nm AOD 0.0001
0.0010 0.0100 0.1000 1.0000
Fraction of data
(d) Dark Target ocean
0.0 0.2 0.4 0.6 0.8 1.0
0.0 0.0 0.0 0.0 0.0 0.0
550 nm AOD 0.0001
0.0010 0.0100 0.1000 1.0000
Fraction of data
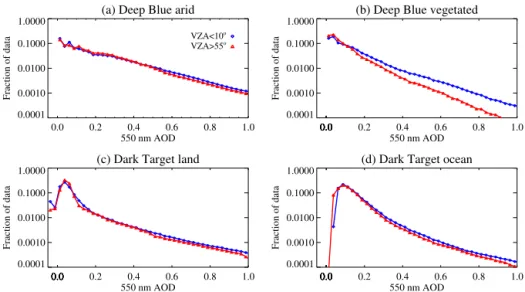
Figure 6.Histograms of retrieved MODIS Aqua AOD at 550 nm during the year 2006 retrieved from(a)DB over bright arid surfaces,(b)DB
over dark vegetated surfaces,(c)DT over dark vegetated surfaces, and(d)the over-water DT algorithm.
latitudes/longitudes overplotted. The fact that the L2 pixels overlap and are oversampled is not clear from the L2 prod-ucts alone and would require auxiliary knowledge of the L1b sensor-pixel locations, which are not provided in the L2 prod-ucts.
All other things being equal, the expected effects of both aspects of this distortion (i.e. pixel enlargement and overlap) on the MXD04 products would be to decrease the variability of the retrieved AOD near the edge of the scan compared to that near the centre of the scan. Figure 6 shows histograms of AOD at 550 nm from all four algorithm/surface types in-cluded within the C6 MXD04 products (DB over arid and vegetated surfaces; DT over land and ocean), for data with VZA<10◦ and VZA>55◦, corresponding to roughly the lowest and highest VZA quintiles respectively (Fig. 3). These histograms are calculated from all L2 products for the year 2006; for the DT ocean panel only latitudes poleward of 35◦
are used, as otherwise a sampling bias may be introduced
due to the presence of sun glint near the centre of the swath in tropical regions.
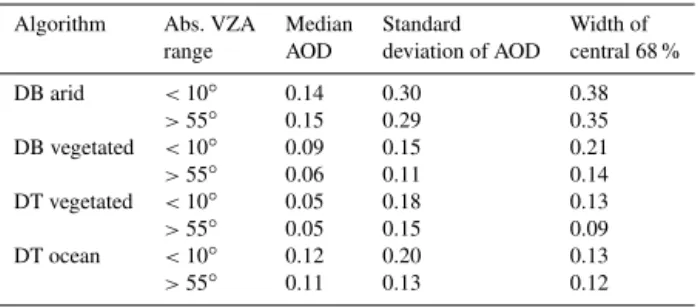
The median, standard deviations, and width of the central 68 % of the data (i.e. difference between 84th and 16th per-centiles of AOD) for these histograms are shown in Table 1. In all cases, the retrievals near the edge of the swath show smaller variability than those near the centre, which is consis-tent with the expected effects of the bow-tie distortion. The median AOD is more stable between the two sets of VZA. The decrease in variability (∼25 % decrease in AOD
stan-dard deviation or width of central 68 %) is most pronounced for the dark (vegetated) land surfaces in DB and DT. This may reflect the lack of strong aerosol point sources over the open ocean and potentially the spatial scales of aerosol features over desert and ocean surfaces being larger than aerosols over vegetated land.
Table 1.Median, standard deviation, and width of central 68 % of
AOD at 550 nm for the histograms shown in Fig. 6.
Algorithm Abs. VZA Median Standard Width of
range AOD deviation of AOD central 68 %
DB arid <10◦ 0.14 0.30 0.38
>55◦ 0.15 0.29 0.35
DB vegetated <10◦ 0.09 0.15 0.21
>55◦ 0.06 0.11 0.14
DT vegetated <10◦ 0.05 0.18 0.13
>55◦ 0.05 0.15 0.09
DT ocean <10◦ 0.12 0.20 0.13
>55◦ 0.11 0.13 0.12
dark vs. bright in the two algorithms, and the fact that DT over land allows retrievals of small negative AOD (down to
−0.05) while DB does not. All histogram shapes may also be
influenced by the fact that the algorithms’ AOD retrieval un-certainties are factors of solar/viewing geometry (e.g. Hyer et al., 2011; Sayer et al., 2013, 2014); depending on the na-ture of these uncertainties, they may also be contributing to shifts in the shapes of the AOD distributions. It is difficult to disentangle the relative importance of these oversampling and error reduction to the change in width, particularly since the answers are likely to be algorithm specific. However, Ta-ble 1 and Fig. 6 support the assertion that the retrieval over-lap and size distortion, undesirable from a point of view of homogeneity of data characteristics, may also be influencing the statistics of the retrieved AOD.
3 Potential mitigation techniques
3.1 Reordering along-track sensor-pixel aggregation The most straightforward way to ameliorate the effects of the bow-tie distortion on the MXD04 aerosol products would simply be to change the along-track sensor-pixel aggregation order from one based on the order of data collection (i.e. scan order) to one based on the order in which pixel centres are ar-ranged on the ground (i.e. geographical order). This could be achieved by reordering the L1b data at each across-track po-sition within each granule in order of increasing (for Aqua) or decreasing (for Terra) latitude, and it would not require any other changes to data processing algorithms or output data file format. Algorithmically, it is as simple as looping across each of the across-track positions and sorting the data by lat-itude (although for granules straddling the poles it becomes a little more complicated). This is referred to hereafter as the “resorted” aggregation technique and has the basic effect of decreasing the distortion in the along-track direction.
A comparison between swath-edge L2 standard and re-sorted retrieval-pixel boundaries is shown in Fig. 7. The 100 % areal overlap of swath-edge pixels in the standard aggregation is reduced to around 40 % in the resorted ag-gregation and effectively removed by a distance of a half-dozen retrieval pixels in to the swath (while in the
stan-dard aggregation pixels are still significantly overlapped at this position). Additionally, although the spatial overlap is
∼40 %, the overlap in terms of L1b pixel radiance data is
only∼20 %, as the central (non-overlapped) 60 % of the
re-sorted retrieval pixel contains data from 8 out of the 10 along-track positions within the cell. This resorting technique also means that the actual area covered by each pixel now aligns much more closely with the area that a data user would in-fer based on the geolocation information within the L2 data products (cf. Fig. 5).
Because of the DB retrieve-then-average methodology, it is most straightforward to use the DB algorithm to illustrate the effects of changing the aggregation technique on AOD retrievals than DT. Figure 8 shows the difference in AOD and pixel area for this technique as compared to the stan-dard L2 aggregation (Fig. 2). The large-scale AOD patterns do not change, although some striping is reduced (as pixels from scans using both mirror sides are now included in the same retrieval pixel, mitigating residual calibration effects on AOD discontinuities). The median AOD difference is, as ex-pected, negligible (<0.01) and the standard deviation of the AOD difference is 0.02. The main advantage from this ap-proach, however, is the reduction of retrieval-pixel area by up to around 40 % (Fig. 8d) at the edge of scan compared to the standard aggregation, due to the removal of much of the along-track retrieval-pixel growth and overlap. For VZA >30◦, the increase of pixel area with VZA proceeds only about half as quickly for a factor of around 5 at the edge of the scan compared to around a factor of 9 using the standard aggregation.
3.2 Change of across-track pixel aggregation counts Although the resorting technique described in Sect. 3.1 in-creases retrieval-pixel independence and dein-creases pixel size by addressing the along-track aspect of the bow-tie distor-tion, it does not improve the across-track pixel growth vs. VZA, which is the larger of the two contributions to retrieval-pixel size increase. In an ideal situation retrieval-retrieval-pixel size and shape would not vary with across-track scan position, but for MODIS this can only be accomplished by changing the number of pixels aggregated across-track when going from sensor-pixel to L2 retrieval-pixel resolution.
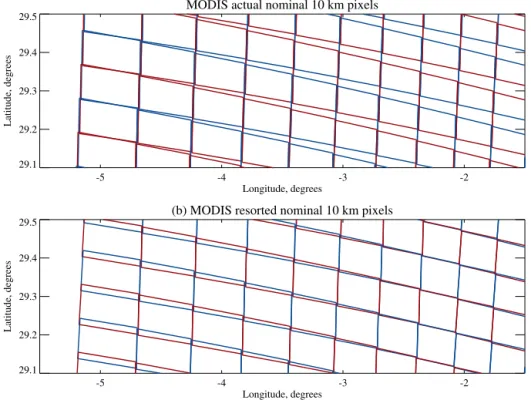
prod-MODIS actual nominal 10 km pixels
-5 -4 -3 -2
Longitude, degrees 29.1
29.2 29.3 29.4 29.5
Latitude, degrees
(b) MODIS resorted nominal 10 km pixels
-5 -4 -3 -2
Longitude, degrees 29.1
29.2 29.3 29.4 29.5
Latitude, degrees
Figure 7.Actual L2 retrieval-pixel boundaries for(a)the standard (Figs. 4c and 5) and(b)resorted aggregation techniques.
Figure 8.DB AOD retrieval for the granule in Fig. 2 using the “resorted” aggregation technique. Panel(a)shows the DB AOD at 550 nm, (b)the difference from the AOD using the standard aggregation technique (Fig. 2c),(c)the resulting retrieval-pixel area, and(d)the ratio
of the area using the resorted technique to that from the standard technique (i.e. ratio of panel(c)to Fig. 2d). Pixels without retrievals are
shaded in grey.
ucts more significantly and require more careful assessment prior to large-scale implementation.
The combination of resorting along-track and changing across-track aggregation number is referred to hereafter as the “variable aggregation” technique. Figure 9 shows that by changing the number of across-track positions aggregated as a function of VZA, from 2 near the edge of the swath to 10
(as in the standard MXD04 aggregation) near the centre, it is possible to preserve a pixel area of around 100 km2across
the whole MODIS swath. This results in an increase of L2 data array size from 203×135 retrieval pixels to 203×233
(a) Across-track pixel aggregation
-70 -50 -30 -10 10 30 50 70 Viewing zenith angle, degrees 0
2 4 6 8 10 12
Number to aggregate
(b) L2 pixel area, km2
-70 -50 -30 -10 10 30 50 70 Viewing zenith angle, degrees 0
200 400 600 800 1000
Median pixel area, km
2
Original Resorted Variable aggregation
Figure 9. (a)Number of across-track positions aggregated for the “variable aggregation” technique, and(b)pixel area as a function of VZA
for the granule shown in Fig. 2 for all three aggregation techniques. The dashed line indicates an area of 100 km2.
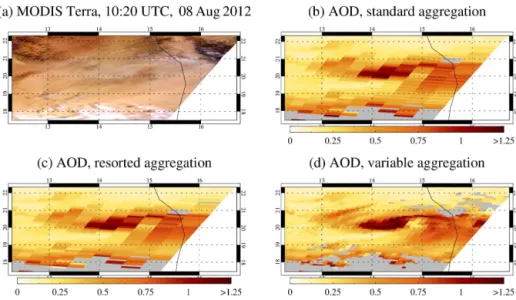
Figure 10.Effect of aggregation technique on spatial distribution of retrieved DB AOD at 550 nm. Panel(a)shows a true-colour image
for the eastern portion of the granule shown in Fig. 2, and panels(b–d)show the L2 AOD for each of the standard, resorted, and variable
aggregation techniques respectively. Pixels without retrievals are shaded in grey.
for VZA smaller than ∼10◦ the aggregation remains the
same as in the standard product (i.e. 100 sensor pixels per L2 pixel). One further point of relevance, however, is that since the source L1b sensor pixels are still distorted and the atmospheric path length is also dependent on VZA, it is still possible that the error characteristics of the retrievals, and ef-ficacy of cloud tests making use of spatial homogeneity (e.g. Martins et al., 2002), could change as a function of VZA.
One potential downside of moving to the “variable aggre-gation” technique is the decrease in the number of L1b pix-els available to contribute to the L2 pixel near the edge of the swath. One of the original reasons for reporting the L2 data at a coarser spatial resolution than the L1b products was to decrease the level of noise in the AOD retrieval, and so a drop in the number of pixels averaged could potentially increase the noise. Larger-scale testing would be required to assess this in detail. However, it is not expected to be a significant factor: for DB, in most cases the standard devi-ation of the sensor-pixel AOD retrievals within the L2 grid is small (often 0.01 or less), suggesting little noise or insta-bility within the retrieval. This is consistent with validation
analyses which indicate that the bulk of the retrieval error in a given situation is contextual (i.e. dependent on geometry, sur-face cover, and aerosol loading/type) rather than radiometric random noise (Sayer et al., 2013, 2014). Additionally, the geometries which would be subject to reaggregation are also those geometries where retrieval errors tend to be lower due to an increased atmospheric path length, which also has the effect of suppressing noise in the retrieval, and would still be true after applying the reaggregation.
better fidelity. Data holes are also much more closely aligned with the presence of clouds; while this will not affect the L2 retrievals themselves (as only cloud-free sensor pixels are used), it does improve the utility of the data for those wish-ing to assess the dependence of aerosol properties as a func-tion of distance from clouds (e.g. Bar-Or et al., 2011; Várnai et al., 2013) or collocate aerosol and cloud data for other pur-poses.
3.3 Larger-scale test application
As a larger-scale test of the effect of reaggregation on AOD statistics, the proposed techniques have been applied to MODIS Terra DB data from the year 2006 over part of east-ern North America (30–50◦N, 70–90◦W; 1978 granules
to-tal), which uses almost exclusively the “vegetated” branch of the DB processing code. Although these results are spe-cific to this region and may well differ for regimes dominated by other aerosol types, or for different algorithms, they do provide an indication of the magnitude of changes in AOD which may result from reaggregation of the MODIS data.
The standard QA tests required for inclusion in the DB “best estimate” data product (i.e. pixels with QA=2 or 3)
were applied (Hsu et al., 2013), with the exception that the absolute pixel count criterion of at least 40 (out of 100) valid retrievals within the 10×10 sensor-pixel box being required
was altered to a relative criterion of at least 40 % of potential pixels being present. Without this change, the variable aggre-gation technique would lose coverage near the edge of the swath, since these reaggregated retrieval pixels have fewer potential sensor-pixel retrievals to draw from for large VZA (Fig. 9). Due to the improved homogeneity of retrieval-pixel size with scan angle in the variable aggregation technique, this run provides a factor of 1.79 more L2 retrievals than either the standard or resorted aggregation methods (which have a very similar data volume to each other). This is higher than that expected from the ratio of potential L2 pixels within a granule using the different techniques (233/135≈1.73); the
extra may be a result of more accurately collocating adjacent sensor pixels in areas close to data gaps (such as coasts or cloud edges).
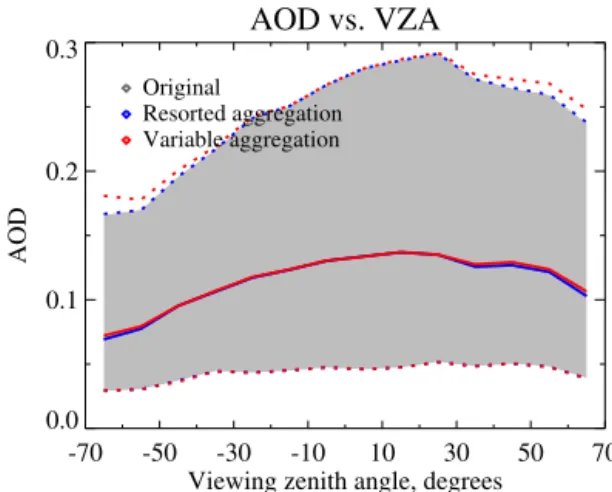
Figure 11 shows the distribution of AOD as a function of VZA for all three aggregation techniques. The distributions for the original and resorted techniques are barely distin-guishable. However, the distribution for the variable aggre-gation technique clearly shows an increased width at large VZA compared to the other two (by 0.01–0.02). The increase comes mainly from the higher-AOD tail of the distribution and also slightly (of order 0.01 or less) increases the median AOD at large VZA compared to the other two techniques. This is consistent with expectations, as otherwise the bow-tie effect would act to smooth out high-AOD scenes to a greater extent than low-AOD scenes (since high-AOD scenes are more likely to be heterogeneous).
AOD vs. VZA
-70 -50 -30 -10 10 30 50 70
Viewing zenith angle, degrees 0.0
0.1 0.2 0.3
AOD
Original
Resorted aggregation Variable aggregation
Figure 11.Effect of aggregation technique on angular distribution
of AOD over eastern North America in 2006, in bins of 10◦. Solid
lines show the median AOD in each bin, and dashed lines bound the central 68 % of the data. The shaded grey region indicates the central 68 % of data using the operational MODIS C6 aggregation technique.
The distributions of AOD vs. VZA do still show some residual angular dependence of peak and width for all ag-gregation techniques. This is likely due to a combination of effects from sampling and residual angular-dependent uncer-tainties in the DB AOD retrieval of these surfaces. Com-paring the widths of the AOD distributions near the edges and centre of the swath in Fig. 11 suggests that, for this re-gion, around a third to a half of the difference in AOD dis-tribution width results from the artificial smoothing from the bow-tie distortion, while the remainder may be a combina-tion of effects from changing retrieval uncertainty character-istics and sampling differences. Since the change in AOD distributions is most pronounced on the high-AOD tail, how-ever, it is likely that regions with a higher typical level of AOD, or more frequent high-AOD events, would exhibit larger changes in AOD distributions as a result of aggrega-tion changes.
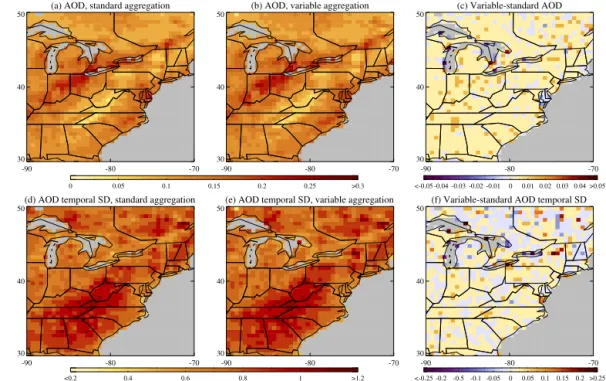
Spatially, the patterns of AOD are, as expected, very sim-ilar. Figure 12 shows the mean and standard deviation of AOD for the standard and variable aggregation runs at 0.5◦
decreas-(a) AOD, standard aggregation
-90 -80 -70
30 40 50
0 0.05 0.1 0.15 0.2 0.25 >0.3
(b) AOD, variable aggregation
-90 -80 -70
30 40 50
(c) Variable-standard AOD
-90 -80 -70
30 40 50
<-0.05 -0.04 -0.03 -0.02 -0.01 0 0.01 0.02 0.03 0.04 >0.05
(d) AOD temporal SD, standard aggregation
-90 -80 -70
30 40 50
<0.2 0.4 0.6 0.8 1 >1.2
(e) AOD temporal SD, variable aggregation
-90 -80 -70
30 40 50
(f) Variable-standard AOD temporal SD
-90 -80 -70
30 40 50
<-0.25 -0.2 -0.5 -0.1 -0.05 0 0.05 0.1 0.15 0.2 >0.25
Figure 12.Effect of aggregation technique on spatial distribution of AOD over eastern North America in 2006 vs. VZA. The top and bottom
rows show geometric mean and temporal standard deviation respectively. The left column shows data for the standard aggregation, the middle the variable aggregation technique, and the right the difference between the two. Data shown at 0.5◦resolution; grid cells with fewer than 10
days of data are shaded in grey.
ing the VZA dependence of AOD, given data from a single day typically samples only a small range of VZA) but the slight increase in AOD can also mean an increase in AOD standard deviation. Again, it is important to emphasise that differences will be region specific since they depend on the magnitude and spatiotemporal variability of AOD.
4 Perspectives on product regularity and MODIS/VIIRS continuity
The full influence of the MODIS bow-tie effect on the MXD04 aerosol data products has not received wide recog-nition up to this point. Despite the fact that visualisations of the data make the elongation of L2 pixels fairly obvious, the substantial overlap between them at the edge of the swath, and the effect that this oversampling and enlargement may have on the L2 data and aggregated statistics, has been un-derappreciated, and many data users may be unaware of it because it cannot be inferred from the L2 data products in isolation.
Although this distortion has not hindered the widespread use of the MXD04 data products for scientific applications, the issue is increasingly relevant now that MODIS-like al-gorithms are being developed for application to NPP-VIIRS data. The VIIRS sensor makes measurements at similar spec-tral bands to MODIS, with a similar L1b sensor-pixel size of nominal 0.75 km for moderate-resolution bands (M-bands), and a broader swath (3040 km). VIIRS has a similar
across-track scanning pattern to MODIS, although with 16 M-band detectors per scan. However, VIIRS incorporates several de-sign features to reduce the bow-tie distortion (Wolfe et al., 2012, 2013). Firstly, the VIIRS on-board native pixel size is actually smaller than the nominal M-band size in the across-track direction. The scan is divided into three regions (in both directions). From nadir out to a scan angle of 31.72◦,
three pixels are aggregated across-track to create the M-band L1b data; from 31.72 to 44.86◦ two pixels are aggregated,
and from 44.86◦to the edge of scan no aggregation is
per-formed. Additionally, at the outer two aggregation zones, two and four pixels respectively are deleted from the along-track scan edges (so-called “bow-tie deletion”). The net effect of this is that pixels within each aggregation zone are enlarged in length by at most approximately only a factor of 2 and that overlap between sensor pixels from consecutive scans is in most cases two or fewer detectors, compared to up to 100 % in MODIS. Thus, there are structural reasons that, even if the AOD retrieval algorithms are as close as possible, the char-acteristics of L2 and L3 data derived from the sensors may differ, which has implications for MODIS/VIIRS data con-tinuity and the generation of multi-sensor long-term climate data records.
to serve as a point of reference to bring these issues to wider recognition within the data user community. Aggre-gating sensor pixels by geographical location rather than in along-track scan order is one straightforward step which can be taken to decrease the along-track distortion; however, as discussed, taking the additional step of changing to a vari-able across-track aggregation has larger implications for al-gorithm development and QA tests. This is already an issue which algorithm developers are facing to an extent, because with the VIIRS bow-tie deletion the number of valid sensor pixels also changes as a function of VZA through the three M-band aggregation zones.
One important caveat to this recommendation is that a strength of the MODIS data product suite is that multiple L2 products are produced on a common grid (e.g. standard nom-inal 10 km DB and DT aerosol data) or on a common scaling of this detector-based grid (e.g. some cloud products). This makes it fairly straightforward to, for example, perform di-rect comparisons between the DB and DT aerosol data sets or to collocate aerosol and cloud data products for other stud-ies. If one product were reaggregated then it would make the most sense for others to also be reaggregated to preserve this common structure. Note, however, that many other MODIS data products are essentially ungridded aside from the under-lying scan structure (e.g. some nominal 1 km cloud or ocean colour products) or on a grid defined relative to the Earth rather than the satellite (e.g. some land products), in which case comparisons or synergistic applications would be un-affected by the change to atmospheric product aggregation (since the grids are not the same as the aerosol products any-way). In fact, the L2 grids of the MODIS land products were designed in part to account for some of the scan-related dis-tortions (Wolfe et al., 1998).
The present study has focused on mid-visible AOD, as this is the primary data product from the DB/DT L2 aerosol al-gorithms. Other retrieved quantities, such as AOD at other wavelengths or the Ångström exponent, are susceptible to these effects in the same way. The effect on downstream L3 products such as mean AOD in a 1◦ box is likely to
be smaller on global average since these products represent an additional level of spatial aggregation anyway. However the increase in effective spatial resolution near the edge of the swath resulting from the variable aggregation technique would lead to a greater number of available L2 retrievals to go into the L3 average, potentially resulting in a more ac-curate grid-box mean AOD. Additionally, the L3 products contain histograms of retrieved AOD; by decreasing effec-tive pixel size and removing the overlap between pixels, these histograms should also become more accurate repre-sentations of the aerosol variability within a grid cell. In-deed, a test application to data over North America reveals changes in L3-like data due to changes in off-nadir retrievals. Changes are, however, likely to be algorithm- and region-specific. Therefore, it seems likely that the benefits of
reag-gregation would extend to the L3 aerosol data products, even though the most substantial benefit is to the L2 products.
Although presented here in the context of the DB and DT AOD retrieval algorithms, these types of issues will be common to any algorithm which aggregates MODIS data to a coarser resolution or to any other sensor with a similar type of scanning geometry and detector setup. The mitigation is fairly straightforward for this example because the MXD04 spatial resolution matches the along-track length of one scan (i.e. 10 nominal 1 km sensor pixels). However for data prod-ucts where the L2 resolution does not match the scan length, such as the DT nominal 3 km AOD product (Remer et al., 2013), the distortion will have an irregular impact on the ac-tual and perceived size of the L2 retrieval pixels. Thus, to obtain a L2 product where the pixel-to-pixel variation in area covered is minimised, it makes most sense to perform re-trievals at either the coarsest L1b data pixel size (i.e. nomi-nal 1 km for MODIS or 0.75 km for VIIRS) or else with an along-track aggregation which is an exact divisor (or multi-ple) of the scan length (e.g. 2, 5, or 10 km for MODIS; 3, 6, or 12 km for VIIRS).
Acknowledgements. This work was supported by the NASA
EOS program, managed by H. Maring. More information about Deep Blue can be found at http://deepblue.gsfc.nasa.gov. The MODIS Characterization Support Team and Ocean Biol-ogy Processing Group are thanked for their extensive efforts in maintaining the high radiometric quality of MODIS data. MODIS level 1 data and aerosol products are available from http://ladsweb.nascom.nasa.gov. The authors thank three referees (L. A. Munchak and two anonymous) for their helpful reviews of this manuscript.
Edited by: A. Kokhanovsky
References
Ahmad, Z., Franz, B. A., McClain, C. R., Kwiatowska, E. J., Werdell, J., Shettle, E. P., and Holben, B. N.: New aerosol mod-els for the retrieval of aerosol optical thickness and normalized water-leaving radiances from the SeaWiFS and MODIS sensors over coastal regions and open oceans, Appl. Optics, 49, 5545– 5560, doi:10.1364/AO.49.005545, 2010.
Anderson, T. L., Charlson, R. J., Winker, D. M., Ogren, J. A., and Holmén, K.: Mesoscale Variations of Tropospheric Aerosols, J. Atmos. Sci., 60, 119–136, doi:10.1175/1520-0469(2003)060<0119:MVOTA>2.0.CO;2, 2003.
Bar-Or, R. Z., Altaratz, O., and Koren, I.: Global analysis of cloud field coverage and radiative properties, using morphologi-cal methods and MODIS observations, Atmos. Chem. Phys., 11, 191–200, doi:10.5194/acp-11-191-2011, 2011.
Campagnolo, M. L., and Montano, E. L.: Estimation of Ef-fective Resolution for Daily MODIS Gridded Surface Re-flectance Products, IEEE T. Geosci. Remote, 52, 5622–5632, doi:10.1109/TGRS.2013.2291496, 2014.
Franz, B. A., Kwiatkowska, E. J., Meister, G., and McClain, C. R.: Utility of MODIS-Terra for ocean color applications, P. SPIE IS&T Elect. Im., 6677, doi:10.1117/12.732082, 2007.
Hsu, N. C., Tsay, S.-C., King, M. D., and Herman, J. R.: Aerosol properties over bright-reflecting source regions, IEEE T. Geosci. Remote, 42, 557–569, doi:10.1109/TGRS.2004.824067, 2004. Hsu, N. C., Tsay, S.-C., King, M. D., and Herman, J. R.:
Deep Blue retrievals of Asian aerosol properties dur-ing ACE-Asia, IEEE T. Geosci. Remote, 44, 3180–3195, doi:10.1109/TGRS.2006.879540, 2006.
Hsu, N. C., Jeong, M.-J., Bettenhausen, C., Sayer, A. M., Hansell, R., Seftor, C. S., Huang, J., and Tsay, S.-C.: Enhanced Deep Blue aerosol retrieval algorithm: the second generation, J. Geophys. Res., 118, 9296–9315, doi:10.1002/jgrd.50712, 2013. Hyer, E. J., Reid, J. S., and Zhang, J.: An over-land aerosol
opti-cal depth data set for data assimilation by filtering, correction, and aggregation of MODIS Collection 5 optical depth retrievals, Atmos. Meas. Tech., 4, 379–408, doi:10.5194/amt-4-379-2011, 2011.
Kaufman, Y. J., Wald, A. E., Remer, L. A., Gao, B.-C., Li, R.-R., and Flynn, L.: The MODIS 2.1 µm channel-correlation with vis-ible reflectance for use in remote sensing of aerosol, IEEE T. Geosci. Remote, 35, 1286–1298, doi:10.1109/36.628795, 1997. Levy, R. C., Remer, L. A., Mattoo, S., Vermote, E. F., and
Kauf-man, Y. J.: Second-generation operational algorithm: retrieval of aerosol properties over land from inversion of Moderate Resolu-tion Imaging Spectroradiometer spectral reflectance, J. Geophys. Res., 112, D13211, doi:10.1029/2006JD007811, 2007.
Levy, R. C., Mattoo, S., Munchak, L. A., Remer, L. A., Sayer, A. M., Patadia, F., and Hsu, N. C.: The Collection 6 MODIS aerosol products over land and ocean, Atmos. Meas. Tech., 6, 2989– 3034, doi:10.5194/amt-6-2989-2013, 2013.
Livingston, J. M., Redemann, J., Shinozuka, Y., Johnson, R., Rus-sell, P. B., Zhang, Q., Mattoo, S., Remer, L., Levy, R., Munchak, L., and Ramachandran, S.: Comparison of MODIS 3 km and 10 km resolution aerosol optical depth retrievals over land with airborne sunphotometer measurements during ARCTAS summer 2008, Atmos. Chem. Phys., 14, 2015–2038, doi:10.5194/acp-14-2015-2014, 2014.
Lyapustin, A., Wang, Y., Laszlo, I., Kahn, R., Korkin, S., Remer, L., Levy, R., and Reid, J. S.: Multiangle implementation of atmo-spheric correction (MAIAC): 2. Aerosol algorithm, J. Geophys. Res., 116, D03211, doi:10.1029/2010JD014986, 2011.
Martins, J. V., Tanré, D., Remer, L., Kaufman, Y., Mattoo, S., and Levy, R.: MODIS Cloud screening for remote sensing of aerosols over oceans using spatial variability, Geophys. Res. Lett., 29, 1619, doi:10.1029/2001GL013252, 2002.
Munchak, L. A., Levy, R. C., Mattoo, S., Remer, L. A., Holben, B. N., Schafer, J. S., Hostetler, C. A., and Ferrare, R. A.: MODIS 3 km aerosol product: applications over land in an urban/suburban region, Atmos. Meas. Tech., 6, 1747–1759, doi:10.5194/amt-6-1747-2013, 2013.
O’Neill., N. T., Ignatov, A., Holben, B. N., and Eck, T. F.: The lognormal distribution as a reference for reporting aerosol op-tical depth statistics; Empirical tests using multi-year, multi-site AERONET Sunphotometer data, Geophys. Res. Lett., 27 (20), 3333–3336, doi:10.1029/2000GL011581, 2010.
Remer, L. A., Mattoo, S., Levy, R. C., and Munchak, L. A.: MODIS 3 km aerosol product: algorithm and global perspective, At-mos. Meas. Tech., 6, 1829–1844, doi:10.5194/amt-6-1829-2013, 2013.
Sayer, A. M., Hsu, N. C., Bettenhausen, C., and Jeong, M.-J.: Validation and uncertainty estimates for MODIS Collection 6 “Deep Blue” aerosol data, J. Geophys. Res., 118, 7864–7872, doi:10.1002/jgrd.50600, 2013.
Sayer, A. M., Munchak, L. A., Hsu, N. C., Levy, R. C., Betten-hausen, C., and Jeong, M.-J.: MODIS Collection 6 aerosol prod-ucts: comparison between Aqua’s e-Deep Blue, Dark Target, and “merged” data sets, and usage recommendations, J. Geophys. Res., 119, 13965–13989, doi:10.1002/2014JD022453, 2014. Tanré, D., Kaufman, Y. J., Herman, M., and Mattoo, S.:
Re-mote sensing of aerosol properties over oceans using the MODIS/EOS spectral radiances, J. Geophys. Res., 102, 16971– 16988, doi:10.1029/96JD03437, 1997.
Toller, G., Xiong, X., Sun, J., Wenny, B. N., Geng, X., Kuyper, J., Angal, A., Chen, H., Madhavan, S., and Wu, A.: Terra and Aqua moderate-resolution imaging spectroradiometer collec-tion 6 level 1B algorithm, J. Appl. Remote Sens., 7, 073557, doi:10.1117/1.JRS.7.073557, 2013.
Várnai, T., Marshak, A., and Yang, W.: Multi-satellite aerosol obser-vations in the vicinity of clouds, Atmos. Chem. Phys., 13, 3899– 3908, doi:10.5194/acp-13-3899-2013, 2013.
Wolfe, R. E., Roy, D., P., and Vermote, E.: MODIS Land Data Storage, Gridding, and Compositing Methodology: Level 2 Grid, IEEE Trans. Geosci. Remote Sens., 36, doi:10.1109/36.701082, 1998.
Wolfe, R. E., Lin, G., Nishihama, M., Tewari, K. P., and Mon-tano, E.: NPP VIIRS early on-orbit geometric performance, P. SPIE IS&T Elect. Im., 8510, doi:10.1117/12.929925, 2012. Wolfe, R. E., Lin, G., Nishihama, M., Tewari, K. P., Tilton, J. C.,
and Isaacman, A. R.: Suomi NPP VIIRS prelaunch and on-orbit geometric calibration and characterization, J. Geophys. Res. At-mos., 118, 11508-11521, doi:10.1002/jgrd.50873, 2013. Xiong, X., Che, N., Barnes, W., Xie, X., Wang, L., and Qu, J.: Status