Design & Implementation of Zero Voltage Switching Buck
Converter
*A.Suresh Kumar **P.Krishna Reddy
*Assistant Professor, Dept. of EEE, RGMCET, Nandyal
**P.G.Student, Dept. of EEE, RGMCET, Nandyal
Abstract
—
Zero voltage switching (ZVS) buck converter is more preferable over hard switched buck converter for low power, high frequency DC-DC conversion applications. In Zero voltage switching converter, turn on & turn off of a switch occurs at zero voltage that results in lower switching losses. In this converter soft switching is achieved by using resonant components. The optimal values of resonant components are determined by using electric functions derived from circuit configuration. This type of soft switched resonant converter offers very low electromagnetic interference (EMI).This study presents the circuit configuration with least components to realize highly efficient zero voltage switching resonant converter. It’s feasibility is confirmed with the developed proto type model and experimental results are verified.
Index Terms-- Resonant converter, Soft-Switching, Zero-Voltage- Switching (ZVS).
I. INTRODUCTION
IN DC-DC converters buck regulation is achieved by turn on the switching device for specified duty cycle. High frequency operation of this converter is preferable to reduce the size of the converter. The high frequency operation results in increased power loss in hard switching converters because switching losses are major contribution in the total converter losses and these switching losses increase with increase in switching frequency. The hard switched converter efficiency is low because considerable amount of power is being lost in terms of switching losses. High frequency operation also increases the severity of switching stress and electromagnetic interference (EMI). All the problems of hard switched converters can be solved by soft switched zero voltage switching circuit configuration. In this circuit configuration, the switching frequency is independent of switching losses. so we can increase switching frequency to very high value.
II.
COMPARISONS
BETWEEN
THE
RESONANT
CONVERTER
AND
THE
TRADITIONAL
PULSE
WIDTH
MODULATOR (PWM) CONVERTER
In traditional PWM converter, high frequency operation is desired to reduce the volume and weight of the converter. But increase in operating frequency leads to an increase in the switching losses, switching stress and EMI. The snubber circuit is connected in parallel to the switch in conventional solution to reduce the dv/dt surge resulting from the switching off. Switching on buffer circuit is connected in series swith the switch to reduce the di/dt surge resultingfrom switching on. Although snubber circuits overcome the shortcomings of PWM converters, the efficiency of the whole converter is remains low because switching losses just diverted from switch to snubber circuits in conventional solution. In resonant converter, series and parallel combination of inductor and capacitor create resonant condition. Therefore, the turn on and turn off instants of the switch occurs either at zero voltage or at zero current in resonant condition normally called as soft switching. This soft switching effectively reduces the switching losses, switching stress and EMI.
A. Traditional PWM power converter
Generally transistors are used as the switches of the DC-DC converters. In traditional PWM converters, power transistors such as MOSFET, IGBT are adopted as the switching devices. MOSFET is preferable for low voltage and high current applications where as IGBT is preferable for high voltage applications. The duty cycle of the power switch is controlled to achieve buck/boost topology. During the turn on instant current increases linearly results in switching losses. Although the traditional PWM converter is efficient than conventionally adopted linear power converter, it has some drawbacks. The operating frequency of conventional PWM converter must be raised to high value to minimize the volume and weight of the converter. But increase in switching frequency leads to increases the switching losses and it also increases the severity of switching stress and EMI. So there is a frequency limitation on traditional PWM converter (hard switching converter).
1) Switching Losses:
Fig.1.Switching loss in a traditional PWM power converter
In a real semiconductor switch, at switching instant the switch voltage or switch current do not go to zero instantaneously, they exhibit a slope form. There is duration of time during any switching transition (i.e. switch turn-on and turn-off) that results in overlapping of voltage and current waveforms. This overlapped area indicates switching losses. Fig.1 shows the switching losses in the traditional converters. vsw is the voltage drop between
collector & emitter of the transistors, and isw is the
current flow from the collector.
B. EMI
The dv/dt is generated in the voltage waveform at the instance of switching-off, because of the stray inductance during switching-off. The di/dt is generated at the instance of switching-on, owing to bad reverse recovery characteristics during the switching-on period. These two situations are the source of EMI. EMI also appears increasingly serious with increasing switching frequency.
C. Switching Stress
Fig. 2 displays the switching path in the V-I plane in a switched power converter. The switch must withstand the switching stress within a safe operating area (SOA), stress across the switch is due to high voltage and large current appeared in the switch during switching. The performance of the Power semiconductor elements effected if they withstand large switching stress.
Fig. 2. Typical switching trajectories of power switches.
III. RESONANT POWER CONVERTER
Fig. 3.Circuit diagram of ZVS resonant converter
The resonant power converter utilizes the resonance theory by incorporating a LC resonant circuit as shown in fig. 3 from the conventionally adopted
PWM converter[1,2]. The switching-on and
switching-off instants of power switch occurs at zero voltage, it will helps to reduce the switching losses, switching stress, dv/dt and di/dt surge, and thus EMI. Diode D1 is connected across the switch with appropriate polarity to ensure turn on instant of power switch at zero voltage. The Inductor Lr is connected in series with power switch S to limit di/dt of the power switch and the capacitor Cris connected across the switch to limit dv/dt of the power switch. As Lr and Cr forms a series resonant circuit, the oscillation of Lr and Cr initiated by turning off of the power switch. Dm is a freewheeling diode. A low pass filter formed by Lf and Cf is connected at the output terminals to provide constant load current. It also filters the high frequency ripple signal. In ZVS buck converter, soft-switching is applied to the power switch. Because of this special feature ZVS buck converter is suitable for high-frequency conversion applications.The circuit analysis can be simplified by , the choosing large value of output filter inductance so that output filter along with load can be regarded as an ideal dc current source I0, during a high-frequency resonant cycle. The circuit operation in one switching cycle can be divided into five modes[3,4]. The parameters are defined as follows.
Characteristic impedance, Z0= Lr Cr
Resonant angular frequency, ω0= 1/ LrCr
Resonant frequency, fr =ω0/2π Switching period=Ts.
Fig. 4.Equivalent circuit of Mode I
This mode is valid for 0 ≤ t ≤ t1. In this mode switch S and diode Dm are off. Let us assume Capacitor Cr is initially uncharged. During this mode, capacitor Cr charges from zero voltage to a voltage VS at a constant rate of load current I0. The capacitor voltage VC rises linearly and it is given as
��=�0.� � (1)
This mode ends at time t=t1 When
�� �=�1 =��. (2)
We can obtain (3) by substituting (2) into (1) That is
t1= VS .C
I0 (3)
Mode 2:
Fig. 5.Equivalent circuit of Mode II
This mode is valid for 0 ≤ t ≤ t2. The switch S is remains off, but diode Dm turns on. The capacitor voltage VC is given as
�� =��sin�0�+�� (4)
where Vm = I0 L/C (5)
We can obtain (6) by substituting (5) into (4) The peak switch voltage is
Vt pk = VC pk = I0 L/C + VS (6)
Which occurs
at t = π/2 L/C (7) The inductor current iL is given by
iL= I0cosω0t (8)
This mode ends at t = t2
�� �=�2 =��, and iL t = t2 =−I0. (9)
Therefore, t2=π LC (10)
Mode 3:
Fig. 6.Equivalent circuit of Mode III.
This mode is valid for 0 ≤ t ≤ t3. The capacitor voltage that falls from VS to zero is given by
VC=
VS−Vmsinω0t (11) The inductor current iLis given by
iL=−I0cosω0t (12)
This mode ends at t = t3
�� �=�3 = 0,
andiL t = t3 = iL3. (13) Thus, t3= L/C sin−1x (14)
Where,x =VS
Vm =
VS
I0 L/C (15)
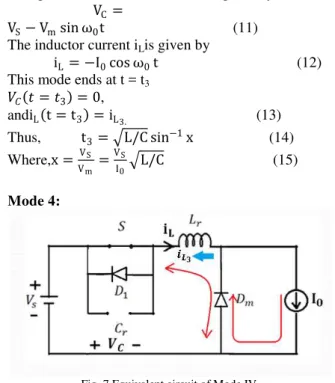
Mode 4:
Fig. 7.Equivalent circuit of Mode IV
This mode is valid for 0 ≤ t ≤ t4. Switch S is turned on and diode Dm remains on. The inductor current which rises linearly fromiL3 to I0 given by iL=
iL3+ VS/L t (16) This mode ends at time t = t4.
�� �=�4 = I0. (17)
We can obtain (18) by substituting (17) into (16) t4= I0−iL3 L/VS (18) iL3 has a negative value.
Fig. 8.Equivalent circuit of Mode V.
This mode is valid for 0 ≤ t ≤ t5.Switch Sis on but Dm is off. In this mode switch carries the load currentI0. The switch S is turned off at the end of this mode, and the cycle is repeated. i.e.,
t5 = T – (t1 + t2 + t3 + t4) (19)
The waveforms for iL and VC are shown in Fig. 9. The peak voltage across the switch is given by
Vt pk = VC pk = I0 L C+ VS
The above equation shows that the peak switch
voltage Vt pk is function of load current
I0.Therefore switch voltage varies with variations in load current that’s why we are maintaining load current as constant by using high value of filter inductance. For this reason, ZVS converters are used only for constant-load applications. The switch must be turned on only at zero voltage. Otherwise, the energy stored in C can be dissipated in the switch. To avoid this situation, the anti parallel diode D1 must conduct before turning on the switch.
The output voltage varies with the switching frequency. Fig. 9 shows key steady-state waveforms of the buck ZVS converter.
Fig. 9.Steady-state waveforms of the developed zero-voltage-switching resonant converter
IV. DESIGN OF RESONANT ELEMENTS
AND SWITCHING FREQUENCY
The condition Z0I0> VSmust hold to ensure that the operation is under zero voltage-switching [5].
I0
1 ω0Cr
> Vin
Cr< I0/ Vinω0 (20)
Similarly, because of the condition Z0I0> VS must hold such that
I0ω0Lr> Vin
Lr > Vin I0ω0 (21)
V. SIMULATION RESULTS
The simulations have been carried out in MATLAB/Simulink. Major circuit parameters are listed in Table I. The values of resonant inductor and resonant capacitor are calculated from design criteria given in the previous section.
TABLE I
CIRCUIT PARAMETERS
Input voltage, Vin 24V Resonant inductor, Lr 200μH Resonant capacitor, Cr 0.1μF Switching frequency, fs 12KHz Resonant frequency, fr 50KHz Output voltage, V0 12V Output current, I0 1A
Simulation of ZVS buck converter is carried out for circuit parameters mentioned in Table I. Fig. 10, shows waveforms of switching signal VGS, resonant voltage VC and resonant current iL obtained from
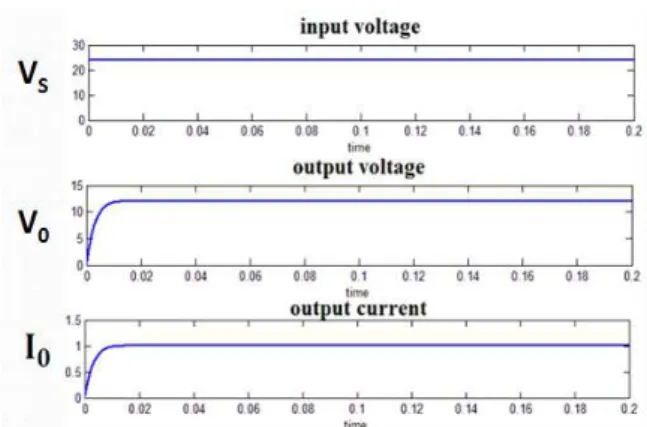
MATLAB simulation. Fig. 11 presents the
waveforms of input voltage VS, output voltage VO and output current IO.
Fig. 10.Waveforms of the switching signal VGS, the resonant
Fig. 11.Waveforms of the input voltage VS, the output voltage V0,
and the output currentI0
The efficiency of ZVS buck converter can be given as
efficiency =output power input power =
12 (1)
24 (0.54)= 92.59%
VI. HARDWARE IMPLEMENTATION
A prototype model of the buck converter with zero voltage switching resonant topology was implemented in laboratory to confirm the functional operation. The specifications of different components used in hardware implementation are listed in Table II. While doing implementation switching pulses for MOSFET are obtained by using IC555 timer operated in Astable mode. The circuit connection of IC555 timer operated in Astable mode is shown in Fig. 12.TABLE II HARDWARE COMPONENTS
A. Generation Of Switching Signal
Fig. 12.Astable Operation Circuit
In the Astable Mode, the output gives high and low pulses based on the value of timing resistors R1, R2 and timing capacitor C1.
t1 = 0.693(R1 + R2).C1 (22) t2 = 0.693(R2).C1 (23) f = 1 / T
f = 1/ (t1 + t2) f = 1.44
R1+R2C1 (24) Duty Cycle = R1+R2
R1+2R2 ∗100% (25)
Where:
t1=the time the pulse is HIGH in sec t2=the time the pulse is LOW in sec
Fig. 13.Experimental set up of ZVS buck converter on work bench
Fig.14. Implementation of Astable circuit by IC555 timer
Fig.15. Implementation of ZVS buck converter circuit COMPONENT
NAME
COMPONENT DETAILS
Resonant inductor 200µH
Resonant capacitor 0.1µF
Filter inductor 600µH
Filter capacitor 1000µF
MOSFET IRF3710
DIODES IN4007
Timer IC NE555
Resistors 2kΩ
Capacitor 0.01µF
Fig.13, displays the experimental set up of ZVS buck converter tested in the laboratory. Fig.14 displays the implementation of Astable mode of operation of IC 555 timer to generate switching signal to the power MOSFET. Fig.15, presents the proto type model of ZVS buck converter.
Fig.16 Wave forms of switching signal and resonant voltage from experimental results
Fig.16, presents the waveforms of switching signal and resonant voltage obtained from proto type model. In the figure we can find the amplitude of switching signal is 6.33333 volts and it’s duty ratio is 76.34%.The peak voltage of resonant voltage is 97.9167 volts and switching frequency is 11.78 kHz.
Fig.17. Output voltage waveform from experimental results
Fig.17, presents the output voltage waveform obtained from laboratory experimental work. In this figure we can find output voltage as 12.0833 volts and ripple content in the output voltage is 625 mv. The efficiency of ZVS buck converter proto type model is
efficiency =output power input power =
12.0833 0.92 24 0.52
= 89.07%.
VII. CONCLUSION
This study presents the circuit configuration of buck converter with ZVS technology for use in solar battery charging circuits, to demonstrate the
effectiveness of developed methodology. The efficiency of ZVS buck converter is in range of 89% to 92%, which is higher than efficiency of traditional PWM buck converter, whose efficiency is in the range of 80% to 85%.Therefore use of ZVS buck converters in solar battery chargers increases the charging efficiency and extends the life of battery charger.
REFERENCES
[1] K. H. Liu and F. C. Lee, ―Zero-voltage switching technique in DC/DC converters,‖ IEEE Trans. Power Electron, vol. 5, no. 3, pp. 293–304,1990.
[2] W. A. Tabisz and F. C., ―Zero -voltage-switching multi-resonant technique—A novel approach to improve performance of high frequency quasi-resonant converters,‖ in Proc. Power Electron. Spec. Conf., 1988, vol. 1, no. 11–14, pp. 9–17.
[3] Muhammad H.Rashid, Power Electronics Circuits, Devices, and Applications, 3rd ed. New Delhi: Prentice-Hall, 2004.
[4] N. Mohan, T. M. Undeland, and W. P. Robbins, Power Electronics: Converters, Applications and Design, 3rd ed. New York: Wiley, 2003. [5] Y. C. Chuang and Yu-Lung Ke, ―A Novel
High-Efficiency Battery Charger With a Buck Zero-Voltage-Switching Resonant Converter,” IEEE Trans. on energy conversion, vol. 22, no. 4, December 2007.
BIOGRAPHIES
A.Suresh Kumar was born in Kurnool,
India. He received the B.Tech (Electrical and Electronics Engineering) degree from the Jawaharlal Nehru Technological University, Hyderabad in 2005; M.Tech (Power Electronics & Drives) from the Veluru Institute of Technology in 2008.He is currently working as an Asst.Professor of the Dept. of Electrical and Electronic Engineering, R.G.M College of Engineering and Technology, Nandyal. His areas of interest are power electronics and Electric Drives and Resonant converters.
P.Krishna Reddy was born in Darsi, India.