*e-mail: [email protected]
Recebido: 12/11/2012 Aceito: 31/07/2013
Bond Graph modeling of the human esophagus and analysis
considering the interference in the fullness of an individual by
reducing mechanical esophageal low
Suélia de Siqueira Rodrigues Fleury Rosa*, Mirella Lorrainy Altoé
Modeling of the human esophagus
Introduction
Decreased food intake is due to the obstructive processes of the esophagus, as proposed by Rosa (2009). Furthermore, according to Rosa (2009) it is possible to insert a device that can reduce the esophagus’s diameter. This device, called an EFC, causes resistance to passage of the bolus when inserted into the esophagus and the result is slower food intake. The need for prolonged mastication occurs due to the reduction in esophageal lumen. This effect on chewing
inluences the triggering mechanisms of satiety and
implies nutritional re-education and consequent weight loss. Thus, a model of the human esophagus is important to understand the interference in satiety when the EFC is used.
In the literature, analyses of bolus motion have already been proposed. However, the modeling that relates pathologies and the passage of the bolus through the esophagus still persist almost entirely based on this binary; they do not evaluate, for example, the interference in satiety.
The Human Esophagus
The esophagus is a ibrous-mucosal-muscular tube
which extends between the pharynx and stomach. It has a mean length of 25 cm (40 cm from the incisors), with 3 cm of lateral diameter and 2 cm of anteroposterior diameter in adults. It consists of three portions: cervical, thoracic and abdominal. The cervical esophagus is about 5 cm long; it starts below the upper esophageal sphincter (UES) and goes to the 1st thoracic vertebra. The thoracic esophagus measures 16-18 cm in length. When it enters the chest, the path of the esophagus is no longer straight, deviating slightly to the left and crossing the left bronchus. It is situated between the vertebrae, the trachea and the lungs (Rosa, 2009). In living individuals, it is very mobile. The lungs, heart and major arteries pulse rhythmically, and the esophagus distends to the extent that the bolus passes through it (Tortora, 2000). There is also within this
framework a ixation of the esophagus to the left main
bronchus through the bronchio-esophageal muscle. In addition, to the right it is crossed by the arch of the azygos vein (a vein of the thorax). On the left, the esophagus is connected to the left recurrent laryngeal nerve, the origin of the left subclavian and carotid arteries; near the thoracic duct and the arch of the aorta (which promotes broncheo-aortic narrowing, for which reason the esophagus measures only 15 to 17 mm in diameter at that level) there is a constriction. In the intra-bronchial portion, the esophagus deviates slightly to the middle line several centimeters above the diaphragm. When the esophagus passes behind the
heart, it deviates to the left again. Subsequently, the esophagus passes near the backbone (level between the 4th and 11th thoracic vertebra), the descending aorta, the azygos vein and thoracic duct segments
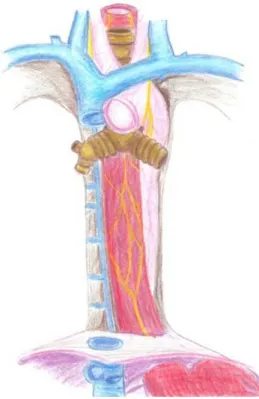
beyond the pleural relection (Paula, 2010). Figure 1
shows the system under study.
Main features
The basic function of the esophagus is to transport swallowed material from the mouth to the stomach and occasionally in the opposite direction; it has a sphincter at each end with the main purpose of keeping it empty, avoiding the entry of air at the top and gastric contents at the bottom. When evaluating the physiological control mechanisms that involve this organ, the muscle of the esophagus, which is responsible for motility, is formed by a circular (internal) and a longitudinal (external) layer. It begins with the voluntary movement of the tongue, which causes an involuntary peristaltic wave, which travels rapidly, reaching the upper esophageal sphincter (pharyngoesophageal sphincter) and producing a rapid and coordinated relaxation followed by a contraction
after swallowing. Muscle ibers found in the distal
55 to 60% of the esophagus are the smooth type,
while in the proximal 10% the ibers are ribbed; in
the intermediate portion, there are mixed smooth and
striated ibers (Dantas et al., 2010; Trawitzki et al.,
Figure 1. Handmade drawing of the system under study. Rev. Bras. Eng. Bioméd., v. 29, n. 3, p. 286-297, set. 2013
2010). In Paula (2010) it is reported that the speed
of the peristaltic wave corresponds exactly to the
contraction manometrically veriied. These peristaltic
waves have durations between 3.0 and 4.5 seconds and reach their maximum amplitude at 60 to 140 mmHg in the lower (distal) esophagus. The contractions are repeated in waves that push the food into the stomach. The passage of solid or semisolid food from the mouth to the stomach takes 4 to 8 seconds; very soft and liquid foods take about 1 second, as shown in the cited reference in the description of the primary peristaltic wave: i) speed: 4.0 to 6.0 cm/s ii) time: 3.0 to 4.5 s and iii) amplitude: 60 to 140 mmHg. Importantly noted is the travel time of food through the esophagus: consistence and time (s): i) solids or
semi-solids equal 4.0 to 8.0 and ii) luids equal 1.0.
Therefore, the aim of this study was to propose a mathematical modeling of the human esophagus considering the interference in the individual satiety due to the EFC. Along with the modeling techniques, Bond Graph theory will be used for the representation of the system under study. Bond Graph theory is a
uniied representation of dynamic systems, in which
elements interact with one another via ports allocated within the system where the exchange of energy occurs (Gawthrop, 1996; Karnopp et al., 2000; Paynter, 1992;
Rosenberg, 1993).
As the application of this device for esophageal treatments already occurs in clinical practice, a mathematical model is important to evaluate via computational simulation the dynamic response of the system. Thus, it will be investigated if using the EFC in order to reduce the diameter of the esophagus in the upper esophageal sphincter area implies that the system response will be slower and consequently will interfere with the individual’s satiation. The results will allow for a better understanding of the passage of food though the esophagus, the establishment of
the relative inluence of some parameters and the
properties of the appetite regulation process.
Methods
The research methodology adopted to obtain the
mathematical model can be deined in three steps:
i) Specify the analog system based on the real physiological model;
ii) Determine the energy domains;
iii) Deine the simpliied hypotheses and the input
and output variables of the system.
The description of each component of the model is presented, divided into the following topics:
Speciied system of study
The human esophagus was modeled based on the description of the esophageal structure, its surrounding elements and its function. The modeling based on
items that directly and indirectly inluence the process
allows the development of a complex model that enables dynamic responses to be valid in a wide range of operations (Marlin, 2010).
As discussed by the authors, with regards to the esophagus all data indicate high uncertainties due to the following factors: spatial distribution of the organ, type and size of the individual and lack of data in the literature.
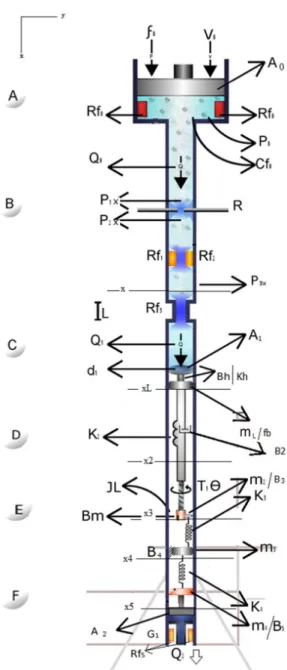
The esophagus was modeled by combining methodologies to approximate the real system with an analogous system- in this case, the mechanical-hydraulic, using the Bond Graph tool to obtain the state variables. Figure 2 shows the conversion of the physiological system into its mechanical-hydraulic analogue.
An advantage of the Bond Graph modeling technique is the division of the system into subsystems, and the energy or power variable occurs in pairs:
pressure-low; force-velocity; torque-angular velocity
and voltage-current. These are pairs that make the connections between the subsystems - called ports. Table 1 shows the analogs of the real variables in the
Bond Graph technique. In these tables, the variables are
classiied as energy dissipators, storers, transformers,
generators and sources.
Energy domains
The energy domains are essential to understand the physiological system using the Bond Graph theory. Thus, it was important to design a simpliied
representation of the rotational mechanical-hydraulic and translational processes involved in the passage of the food trough the esophagus. For a better understanding, see below a description of each modeled region of the system (A, B, C, D, E, F).
Region A
The region of the mouth receives food from a source of effort. Broadly speaking, there are two generalized
variables – effort and low, whose product represents
the power that runs through the system. In the case of the system modeled, the power refers to the passage of the bolus. The food reception process was represented by the translational mechanical analogue.
For the masticatory process, we made an analogue to the hydraulic system. The system was considered analogous to a hydraulic cylinder, where the process has
Modeling of the human esophagus
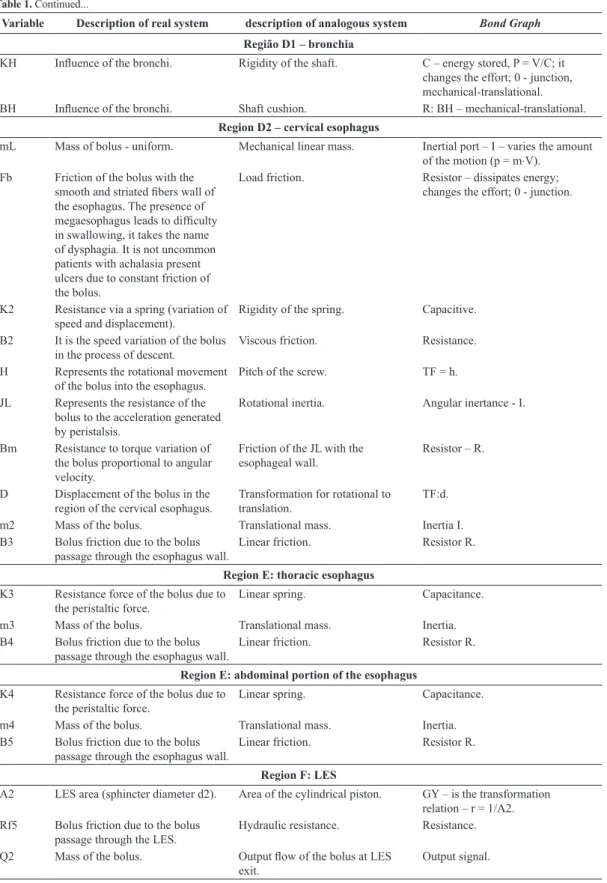
Table 1. Analogues of real variables by Bond Granph technique.
Variable Description of real system description of analogous system Bond Graph
Region A: region of the human mouth
Fo Initial input force of food into the mouth - input system.
Force applied under the area of the hydraulic cylindrical piston.
Mechanical - translational low.
Vo Initial input velocity of food into the mouth.
Velocity applied under the area of the hydraulic cylindrical piston.
Mechanical -translational effort.
A0 Area of the region of the mouth where the food is processed generating the bolus.
Area of the cylindrical piston. GY – is the transformation relation – r = 1/A0.
Rfo Loss of load or dificulty imposed during mastication, tongue, teeth and saliva mixture.
Friction inside the
mouth - dimensionless, is a factor which ranges from 0 to 1 and simulates friction. For younger people, the friction is higher. As for the elderly friction is lower.
Resistor – dissipates energy.
Po Saliva and food for simulating the bolus.
Hydraulic pressure. Effort - hydraulic.
Cfo Volume of the bolus taking into
account the speciic mass of the luid - similar to the reservoir.
Hydraulic capacitance. C – energy stored, P = V/C.
Qo Volume low rate of the bolus when leaving the mouth region.
Hydraulic low. Flow - hydraulic.
Region B: epiglottis
P1x Input pressure of the bolus in this region.
Input pressure. Hydraulic effort, in a 1-junction.
R Epiglottis and the resistances to the passage of food.
Resistance to the volume low rate
(laminar low and without gas). Resistor – dissipates energy. P2x Bolus pressure in this region. Flow pressure. Hydraulic effort, in a 1-junction. Rf1 Cricoid cartilage. Restriction imposed by
cartilage - changes the luid low
velocity.
Resistor – dissipates energy and
changes the luid low velocity.
Rf2 Cricoid cartilage. Restriction imposed by
cartilage - changes the luid low
velocity.
Resistor – dissipates energy and
changes the luid low velocity.
P3x Output pressure of the bolus in this region.
Output pressure. Hydraulic effort, in a 1-junction.
Region C: UES and singularity
Q1x Volumetric low rate of the bolus in the esophagus.
Flow through a lossless pipe,
incompressible luid. Hydraulic low - coming from the region B. Junction 1, common low. In this region, the low keeps the
same. Rf3 The resistance in this region is due
to tissue and cartilage.
Fluidic resistance - RF, TR as a function of absolute viscosity and internal diameter.
RF and TR are deined as turbulent low in rough pipe and are a function of friction factor, as deined
by (Garcia, 2009, p. 278).
P4x Output pressure of the bolus with an abrupt change; function of the friction factor (fa) of the Moody L.F. diagram.
Output pressure that will act on piston system generating mechanical movement.
Hydraulic effort - GY input - to change the domain power.
Region D: cervical esophagus
A1 Area according to the diameter (d1) of the esophagus in this region; it is considered the maximum opening passage.
Area of the cylindrical piston. GY – is the transformation relation – r1 = 1/A1.
Rev. Bras. Eng. Bioméd., v. 29, n. 3, p. 286-297, set. 2013
Table 1. Continued...
Variable Description of real system description of analogous system Bond Graph
Região D1 – bronchia
KH Inluence of the bronchi. Rigidity of the shaft. C – energy stored, P = V/C; it changes the effort; 0 - junction, mechanical-translational. BH Inluence of the bronchi. Shaft cushion. R: BH – mechanical-translational.
Region D2 – cervical esophagus
mL Mass of bolus - uniform. Mechanical linear mass. Inertial port – I – varies the amount of the motion (p = m⋅V).
Fb Friction of the bolus with the
smooth and striated ibers wall of
the esophagus. The presence of
megaesophagus leads to dificulty
in swallowing, it takes the name of dysphagia. It is not uncommon patients with achalasia present ulcers due to constant friction of the bolus.
Load friction. Resistor – dissipates energy; changes the effort; 0 - junction.
K2 Resistance via a spring (variation of speed and displacement).
Rigidity of the spring. Capacitive.
B2 It is the speed variation of the bolus in the process of descent.
Viscous friction. Resistance.
H Represents the rotational movement of the bolus into the esophagus.
Pitch of the screw. TF = h.
JL Represents the resistance of the bolus to the acceleration generated by peristalsis.
Rotational inertia. Angular inertance - I.
Bm Resistance to torque variation of the bolus proportional to angular velocity.
Friction of the JL with the esophageal wall.
Resistor – R.
D Displacement of the bolus in the region of the cervical esophagus.
Transformation for rotational to translation.
TF:d.
m2 Mass of the bolus. Translational mass. Inertia I. B3 Bolus friction due to the bolus
passage through the esophagus wall.
Linear friction. Resistor R.
Region E: thoracic esophagus
K3 Resistance force of the bolus due to the peristaltic force.
Linear spring. Capacitance.
m3 Mass of the bolus. Translational mass. Inertia. B4 Bolus friction due to the bolus
passage through the esophagus wall.
Linear friction. Resistor R.
Region E: abdominal portion of the esophagus
K4 Resistance force of the bolus due to the peristaltic force.
Linear spring. Capacitance.
m4 Mass of the bolus. Translational mass. Inertia. B5 Bolus friction due to the bolus
passage through the esophagus wall.
Linear friction. Resistor R.
Region F: LES
A2 LES area (sphincter diameter d2). Area of the cylindrical piston. GY – is the transformation relation – r = 1/A2. Rf5 Bolus friction due to the bolus
passage through the LES.
Hydraulic resistance. Resistance.
Q2 Mass of the bolus. Output low of the bolus at LES exit.
Modeling of the human esophagus
We adopted a few assumptions, such as:
compressible luid, laminar low with losses and speciic mass ρ constant. In this case, the variable
effort (which in the Bond Graph is the pressure) will remain the same in this region, given the previous assumptions.
Region B
Upon exiting the mouth, the low Q0, which corresponds
to the bolus with saliva, enters region B, which
corresponds to the inal region of the mouth and
pharynx (epiglottis). Thereafter, the low through the oriice is similar to a laminar low, since Re 1< 1100
(Garcia, 2009). In this region, we assumed a luidic
resistance RFi (i = 1, ... 3) which refers to the loss of load along the circuit.
Region C
The output of this part of the circuit generates a low
Q1 and a pressure P3x which refer to the passage of the bolus through the region C. This region of the
system is similar to the low through a capillary tube,
which will be considered laminar (linear), but rough (rough tube) due to the friction. In this region, due
to the azygos veins, aortic arch and the inluence of
the vertebra, we considered the loss of pressure and
low variation as change from the hydraulic energy
domain to mechanical-translational. In this region,
the inluence of diameter, d, must be analyzed in the
mathematical model.
Region D
In region D, the ingested material is propelled along the lumen of the esophagus by two types of forces: the gravitational force and the peristaltic-type force of contraction executed by the muscles of the organ itself, which is able to move the content in the craniocaudal direction, even against gravity or with the body in a supine position. In the erect position, the esophageal transit occurs within 10 seconds. The propulsive movement which, after ingestion, runs the length of the esophagus in craniocaudal direction is called primary peristalsis. The peristalsis triggered by the presence of any liquid or solid material in the lumen of the organ, regardless of swallowing, is called secondary peristalsis (Guyton and Hall, 2006). This region includes the trachea, thoracic duct, laryngeal nerve, left and right lungs and blood vessels. In the transition between the pharynx and esophagus where the cricopharyngeal muscle is connected is where the upper esophageal sphincter (UES) is located. The UES is formed by innervated striated muscles, primarily innervated by the vagus nerve, which act in the modeled process as physical variables of the system.
Regions E and F
Steps E and F of the circuit refer to the esophagus in the abdominal portion between the esophageal body and the stomach, which the lower esophageal sphincter (LES) interposes. The intra-esophageal pressure is lower than the intra-gastric; the LES is characterized by being a zone of 2 to 4 cm of extension with higher
1Reynolds number = Re=ρ υD , Garcia, 2009 .
(
)
µFigure 2. Mechanical and hydraulic representation analogous to the esophagus system, and its variables and constants.
Rev. Bras. Eng. Bioméd., v. 29, n. 3, p. 286-297, set. 2013
pressure than the stomach and is therefore an effective
barrier against the gastro-esophageal relux (Fernandes,
2006). In this region, we sought to represent the entire process of muscle and pressure waves and pleural interference by a torsional spring and a linear spring. The LES can also indicate spontaneous contractions and incomplete relaxation; the representation for such phenomena was made by changing the domain and resistance RF5.
Simplifying assumptions and parameters
adopted
Some considerations were assumed in the modeling of the system:
• The bolus is uniform in its geometric structure; • The volume of saliva is ixed;
• The system parameters are concentrated; • It is assumed that there is noise in the system; • The inluence of a few surrounding organs
and systems was ignored;
• The pharynx implies inertial effects.
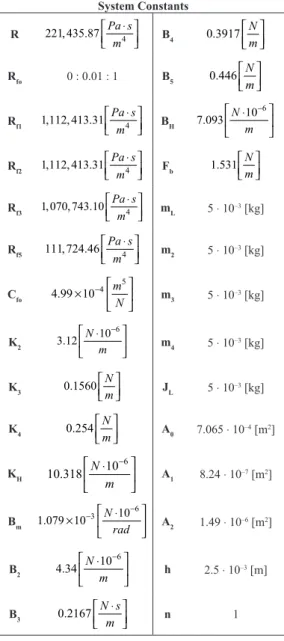
Table 2 shows the values adopted for the system constants. Further details on the equivalence of each constant and the calculation developed can be seen in Table 1. To obtain these variables, we used the values already available in the literature and equations that allowed the acquisition of the magnitude required. In addition, for the study we used a geographically homogeneous population in order to avoid errors in comparison with other populations affected by various factors, since according to Salomão et al. (2004) the esophageal manometry still has no universal standardization for obtaining data.
Results
Bond Graph mathematical model
The Bond Graph model proposed for the esophageal system was structured using the simulation software
20-sim. Just one derivative causality has been identiied.
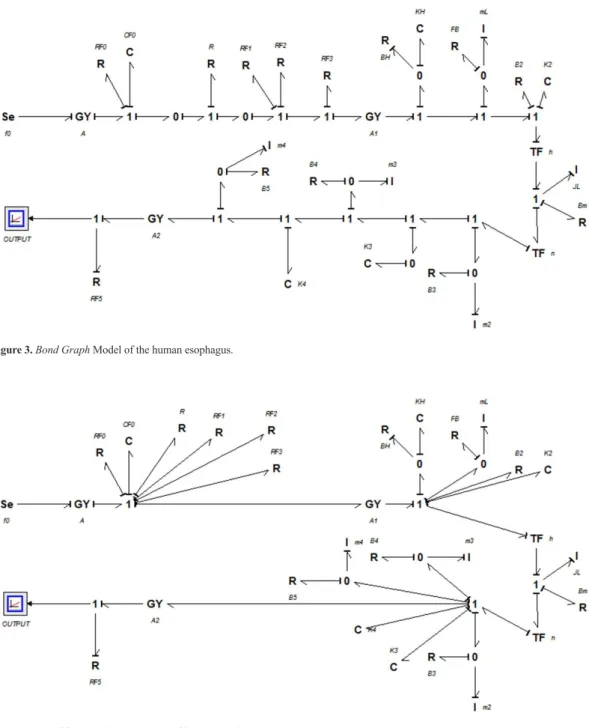
The causality determines how the generalized element can store energy and interact producing the dynamic interactions of the system. Figure 3 demonstrates the modeling obtained in Bond Graph language.
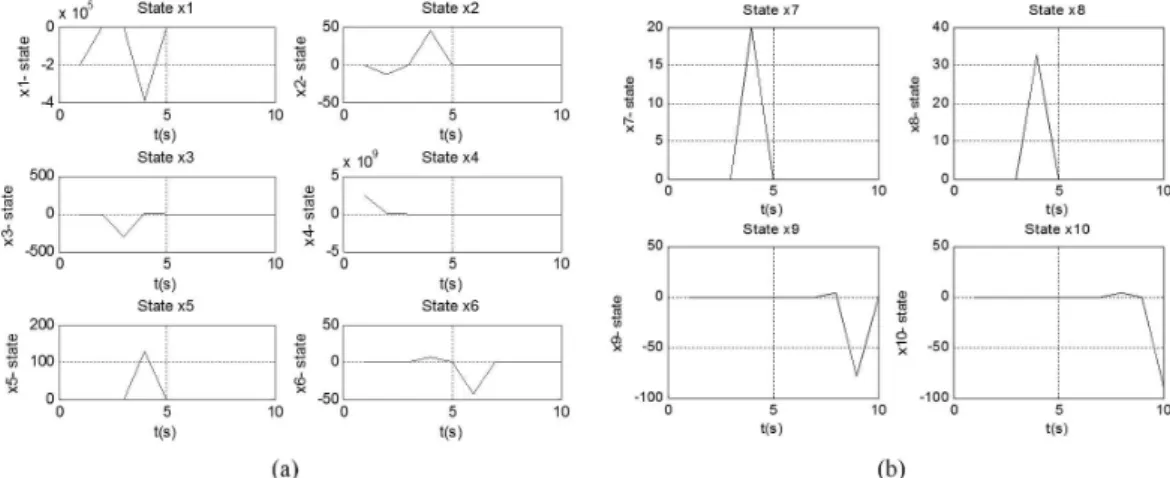
To obtain the equations in state space, the system
was simpliied through the software 20-sim. Figure 4 shows the simpliied diagram.
In the simpliied process, the software analyzed
the power and energy receptors and eliminated redundancies. After the Bond Graph simpliied model,
the equations were obtained to construct the matrix
of state space. Equation 1 shows the matrix of state space for the system modeled. Table 3 presents the
classiication obtained from matrix analysis of state
space of the modeled system.
General dynamics of the esophageal system
The state space matrix was simulated in Matlab using the values indicated in Table 1. The system response, when stimulated with step input, indicates a stable behavior with system characteristics of the
irst order, as shown in Equation 1. For this simulated
output, three different values for Rf0 were adopted.
Table 2. Values adopted for the variables that comprise the esophagus model. Data relating to healthy subjects from a locoregional population.
System Constants
R 221, 435.87 4
Pa s m
⋅
B4 0.3917
N m
Rfo 0 : 0.01 : 1 B5 0.446 N
m
Rf1 1,112, 413.31 4
Pa s m
⋅
BH
6 10 7.093 N m − ⋅
Rf2 1,112, 413.31 4
Pa s m
⋅
Fb 1.531
N m
Rf3 1, 070, 743.10 4 Pa s
m
⋅
mL 5 ⋅ 10
–3 [kg]
Rf5 111, 724.46 Pa s4
m ⋅
m2 5 ⋅ 10
–3 [kg]
Cfo
5 4
4.99 10 m
N
−
×
m3 5 ⋅ 10
–3 [kg]
K2 6 10 3.12 N m − ⋅
m4 5 ⋅ 10
–3 [kg]
K3 0.1560 N
m
JL 5 ⋅ 10
–3 [kg]
K4 0.254
N m
A0 7.065 ⋅ 10
–4 [m2]
KH 6 10 10.318 N m − ⋅
A1 8.24 ⋅ 10 –7 [m2]
Bm
6 3 10
1.079 10 N
rad
−
− ⋅
×
A2 1.49 ⋅ 10
–6 [m2]
B2 6 10 4.34 N m − ⋅
h 2.5 ⋅ 10
–3 [m]
B3 0.2167 N s
m ⋅
Modeling of the human esophagus 1 1 2 3 4 5 6 7 8 1 2 2 2 1 3 1 2 9 10
1 2 2 2 2 2
1 1 1 1 1 1 1
0 0 0 0 0 0 0 0
1 2 3
1 1
0 0 0 0 0 0 0 0
1
0 0 0 0 0 0 0 0
1 1 1 1 1
− + + + + − − − − − − − − − =
H H H
H H H m
Cfo Rfo R Rf Rf Rf A K
B K B K
Fb m x x x x x x x x L K A K A A
A Cfo B K mL B K B K hB K hn K
x x x 2 5 2 1 4 2
2 3 3 4
2
2
3 4 3
2 2 3 2 4 2 4 4 3 5 4 4
1 1 1 1
0
1
0 0 0 0 0 0 0 0 0
0 0 0 0 0 0 0 0
0 0 0 0 0 0 0 0 0
0 0 0 0 0 0 0 0 0
1
0 0 0 0 0 0 0 0
1
0 0 0 0 0 0 0 0
− − − − − − − − L Rf A K
hJ hnm hK hm hm
hn K
hK
B K B
nhK m K nhK K nhK B K m B K m
( )
1 2 3 4 5 6 7 8 9 10 0 0 0 0 0 0 0 0 0 0 ⋅ + ⋅ x A x x x x fo t x x x x x (1) Rev . B ras . E ng . B ioméd ., v. 29, n. 3, p
. 286-297, set
. 2013
Br
az. J. Biom. E
ng
., 29(3), 286-297, S
ept
. 2013
When plotting the response of each state, it is
apparent which states inluence the behavior of the
system. In Figure 5a, b it can be seen that states x1 and x4, with orders 5 and 9 respectively, are the states
of greater inluence.
Internal dynamics of the esophageal system
The impulse response shows asymptotic internal stability of the system, as can be seen in Figure 6a. In Figure 6 b, we can see that the eigenvalues, different
Figure 3.Bond Graph Model of the human esophagus.
Figure 4. Simpliied Bond Graph model of human esophagus.
Table 3. Classiication of the modeled system in the form of state space.
System Classiication
Input vector fo (t) Order: x∈ℜ10
Explicit System No algebric loop SISO
Linear Time-invariant Continuos
Parameters concentrates
Deterministic Matrix A Dimension 10 × 10
Modeling of the human esophagus
or with repetition, are in the left semi-plan providing stability to the system.
Performance of Esophageal Flow Controller - EFC
In order to discuss the relationship between setting the esophagus diameter and resistance to the passage of the bolus in the esophagus, two simulations were conducted. Thus, it was evaluated that if there is
some signiicant change in the fall period, it affects
the process of human satiety.
First, we considered the extension of the esophagus as a tube of 3 cm diameter. Thus, we attributed A0, A1 and A2 equal to 3 cm and excited the system with a pulse stimulus. When the performance of the EFC was evaluated, the area of the upper sphincter region (A1) was reduced to an area with a diameter of 1 cm.
Thus, the results obtained for comparison can be seen in Figure 7a, b.
Discussion
As a irst study, the analysis did not consider all hypothetical inluences. As a result, the order of the inal equation was x∈ℜ10. The temporal response
of the modeled system to the unit step input indicates that the process has a fast time constant which is characteristic of systems derivatives.
Thus, there is an attenuation of the input signal, where it is inferred that the simulated model matches the dynamic intake; in other words, when the force and input speed of a liquid is quick but its resistance is low, the level of energy to expended transport food decreases and the pressure of the esophagus decreases.
Figure 5. (a) Response of states x1 to x6 of the system modeled; (b) Response of states x7 to x10 of the system modeled.
Figure 6. (a) Response of the system modeled to the impulse signal; (b) Root-Locus of the system modeled. Note that the eingevalues are in the left semi-plan providing stability to the system.
Rev. Bras. Eng. Bioméd., v. 29, n. 3, p. 286-297, set. 2013
Furthermore, when the system is being excited by a continuous-time unit impulse, which is equivalent to a sip of water for 20 seconds, the system responds with a stable dynamic. At the beginning of the liquid intake there is a moderate transience, which represents the passage of resting pressure to working pressure.
When the upper esophageal sphincter area was reduced to a diameter of 1 cm, the dynamic behavior was changed since the system response was highly oscillatory and overshot to a greater degree. For this reason, it is possible to infer that the process of lowering food became slower; since the oscillation corresponds to a slower response of the system.
The descent speed of food makes it possible to conclude through analysis, according to (Rosa, 2009), that the inclusion of the EFC implies increasing resistance to passage of a bolus through the esophagus; as consequence, this changes the descent time of food and affects the process of human satiety.
The paper presented a mathematical model for understanding the dynamics of the human esophagus. We evaluated the relationship of the descent speed of the bolus with interference and the satiation of an individual. The method proposed allowed us to validate the hypothesis that the EFC creates a change in the fall time of the food, since after entering the esophagus it causes resistance to the passage of the bolus, the result of which is slower ingestion, which in turn affects the process of human satiety. Based on the absorption, or even the presence of food in the gastrointestinal tract, it contributes to the modulation of appetite and the regulation of energy.
References
Dantas RO, Alves LMT, Nascimento WV. Effect of bolus volume on proximal esophageal contractions of patients with Chagas’ disease and patients with idiopathic achalasia. Diseases of the Esophagus. 2010; 23:670-4. http://dx.doi. org/10.1111/j.1442-2050.2010.01066
Fernandes CR. Importance of pleural pressure for the evaluation of respiratory mechanics. Revista Brasileira de
Anestesiologia. 2006; 56(3):287-93. PMid:19468575. http:// dx.doi.org/10.1590/S0034-70942006000300009
Gawthrop P. Metamodelling: Bond Graphs and dynamic
systems. New York: Prentice Hall; 1996. PMid:8602516.
Garcia C. Modelagem e simulação de processos industrias
e de sistemas eletromecânicos. 2a ed. São Paulo: Editora da Universidade de São Paulo; 2009.
Guyton AC, Hall JE. Textbook of medical physiology. 11th ed.
Philadelphia: Elsevier, Saunders; 2006.
Karnopp D, Margolis DL, Rosenberg RC. System dynamics: modeling and simulation of mechatronic systems. 3rd ed. New York: Horizon; 2000.
Marlin TE. Process control: designing process and control
systems for dynamic perfomance. 2nd ed. New York: McGraw Hill; 2000.
Paula PMC. Proposta de aplicabilidade do módulo CFE® e sua instrumentação para análise isiológica do esôfago
[dissertação]. Brasília: Universidade de Brasília; 2010.
Paynter H. An epistemic prehistory of Bond Graphs. In:
Breedveld P, Dauphin-TanguyG, editors. Bond Graphs for Engineers. Amsterdam: North-Holland; 1992. p. 3-17.
Rosa SSRF. Desenvolvimento de um sistema de controle de
luxo esofagiano para tratamento da obesidade. São Paulo:
Edgard Blücher Ltda; 2009.
Rosenberg RC. Relections on engineering systems and
Bond Graphs. Journal of Dynamic Systems, Measurement,
Modeling of the human esophagus
and Control. 1993; 115(1):242-51. http://dx.doi. org/10.1115/1.2899064
Salomão N, Malafaia O, Ribas-Filho JM, Coelho JCU,
Ribas CM, Ruediger RR. Parametros manométricos normais
para motilidade esofagiana. ABCD Arquivos Brasileiros de Cirurgia Digestiva. 2004; 17(2):95-9.
Tortora GJ. Corpo Humano: fundamentos de anatomia e
isiologia. 4. ed. Porto Alegre: Artmed Editora; 2000.
Trawitzki LVV, Dantas RO, Mello-Filho FV, Marques W Jr. Masticatory muscle function three years after surgical correction of class III dentofacial deformity. International Journal of Oral and Maxillofacial Surgery. 2010; 39:853-6. http://dx.doi.org/10.1016/j.ijom.2009.03.006
Authors
Suélia de Siqueira Rodrigues Fleury Rosa*, Mirella Lorrainy Altoé
Laboratório de Engenharia e Biomaterial – BioEngLab®, Engenharia Biomédica, Faculdade Gama, Universidade de
Brasília – UnB, Área Especial de Indústria Projeção A, Setor Leste, CEP 72444-240, Gama, DF, Brasil. Rev. Bras. Eng. Bioméd., v. 29, n. 3, p. 286-297, set. 2013