Short Report
Printed in Brazil - ©2016 Sociedade Brasileira de Química0103 - 5053 $6.00+0.00*e-mail: [email protected]
GC×GC-TOF/MS Analysis of Bio-Oils Obtained from Pyrolysis of
Acuri and Baru Residues
Claudia Andrea L. Cardoso,*,a Maria Elisabete Machado,b Franksteffen S. Maia,a Giberto Jose Arrudaa and Elina B. Caramãob,c
aCurso de Química, Universidade Estadual de Mato Grosso do Sul,
Rodovia Dourados-Ithaum Km 12, CP 351, 79804-970 Dourados-MS, Brazil
bInstituto de Química, Universidade Federal do Rio Grande do Sul,
91501-970 Porto Alegre-RS, Brazil
cUniversidade Tiradentes, UNIT, 49010-390 Aracaju-SE, Brazil
Bark of acuri and endocarp of baru are residues generated during the processing of these fruits. One alternative to consider is the pyrolysis of these materials to generate bio-oils, opening the perspective for the production of environment-friendly, added value products. Samples of acuri and baru were subjected to laboratorial scale pyrolysis. At the optimized pyrolysis conditions, the bio-oils yields (m/m) were 30% for bark of acuri and 29% for endocarp of baru. Next, the obtained bio-oil was submitted to proximate analysis and GC×GC-TOF/MS (two-dimensional gas chromatography with time-of-flight mass spectrometric detection). The bio-oil generated from the bark of acuri proved to be of the highest complexity with 113 identified compounds, while the bio-oil generated from the endocarp of baru sample led to 71 identified compounds. A total of 29 compounds were confirmed using standards in the acuri bark bio-oil, while 23 compounds were confirmed for endocarp of baru bio-oil. There was a predominance of phenols and ketones for the bio-oil generated from acuri bark, and hydrocarbons and phenols for the bio-oil from baru endocarp.
Keywords: bio-oil, Attalea phalerata, Dipteryx alata
Introduction
The demand for sustainable, renewable, low cost energy sources has stimulated processes that transform biomass in substituents of petroleum products. Biomass resources generate several agricultural residues. Residues are available in large quantities in the environment, and have the advantage of not competing with the food market; in addition, residues contain large amounts of organic constituents and, thereby, large amount of energy.1 Biomass represents the fourth largest global energy source used,2 and can produce solid, liquid and gaseous fuels. Acuri and baru are abundant fruits in the Brazilian State of Mato Grosso do Sul. Brazilian industry currently processes several kinds of native fruits in the manufacturing of products, including the acuri (Attalea phalerata) and baru (Dipteryx alata).3,4
The production of bio-oils from biomass residues, such as bark of acuri and endocarp of baru, opens a perspective
for the production of environment-friendly products with added value. Since there is no published investigation on the pyrolysis of bark of acuri and endocarp of baru, there is currently no information available on the composition of its bio-oils by GC-MS (gas chromatography coupled with mass spectrometry) or GC×GC-TOF/MS (two-dimensional gas chromatography with time-of-flight mass spectrometric detection).
Biomass is a complex material, mainly composed of cellulose, hemicelluloses, and lignin, in addition to extractives (tannins, fatty acids, resins) and inorganic salts.5,6 The biomass can also be used as raw materials to generate energy, chemical products and activated carbon.7-12 Among the several procedures that exist to transform the biomass into energy, one can identify thermochemical methods such as pyrolysis, gasification, liquefaction and combustion.13,14
Pyrolysis is still the simplest thermochemical conversion of biomass to more useful fuel,15-19 and is characterized by the thermal decomposition of organic matter in the absence of oxygen or when combustion takes place with significantly less oxygen than the required amount for complete combustion. In this process, three fractions are generated: gas, char and bio-oil, the last in larger amounts. The fast pyrolysis favors the production of a higher amount of bio-oil, although variations in the process parameters can greatly influence the nature and amount of the generated products.
Bio-oil is a complex mixture that contains a great variety of compounds of different chemical classes, such as carboxylic acids, esters, alcohols, aldehydes, ketones, phenols, alkenes, furans, guaiacols, syringols, furans, sugars, aromatic and nitrogen.20-23 Due to the variety of chemical compounds, bio-oils can be used as bio-fuel or for the production of chemical products,24,25 such as the following: levoglucosan in the manufacturing of pharmaceuticals, biodegradable polymers and surfactants, and hydroxyacetaldehyde, the most active meat-browning agent.23
Several researchers reported the characterization of bio-oil by gas chromatography (GC) with high efficiency, precision and simplicity, especially when coupled with mass spectrometry (MS). However, it may not be sufficient, resulting in several co-elutions of its components.26,27 GC×GC-TOF/MS is a suitable alternative for qualitative and quantitative analysis of bio-oils, because of its higher peak capacity, sensitivity, and selectivity.28 Structurally organized distribution of different classes of compounds is also an important feature of GC×GC (two-dimensional gas chromatography), which helps identifying unknown compounds.29
Some studies have been published regarding bio-oil composition using GC×GC. One of the studies considered the composition of beech pyrolysis oil and hydrodeoxygenated oils using GC-MS, two-dimensional gas chromatography with flame ionization detector (GC×GC-FID), and GC×GC-TOF/MS.30 In that study, the GC×GC-TOF/MS improved the understanding of the molecular distribution over the 1D-2D retention time fields in the contour plot, which was used to classify the analyses in functional groups. By group-type classification of the main components, it was possible to characterize the oils after 250 and 350 analyses of pyrolysis oil and heavy duty oil (HDO), respectively. GC×GC-FID proved to be more helpful for compound identification, although it was proposed a group classification and tentative identification using 72 model compounds, and GC-MS was used to confirm the molecular structures.31 Qualitative and quantitative analysis of the bio-oils showed a superior
performance of GC×GC-TOF/MS, and an average of 300 compounds were detected in the samples.32 The qualitative analysis of bio-oils of the rice rusk and peach pit were identified in 106 and 223 compounds, respectively, using GC×GC-TOF/MS.33 In the analysis of the products from pyrolysis of Brazilian sugar cane straw, it was identified 123 compounds by GC×GC-TOF/MS.34
The objective of the present paper is to employ pyrolysis to obtain bio-oils from acuri and baru residues as well as to use the GC×GC-TOF/MS to investigate their compositions. As demonstrates in this study, the production of bio-oil can be an alternative for the use of these residues.
Experimental
Samples, standard compounds and sample preparation
The biomass used in this work was the bark of acuri and endocarp of baru residues, which were collected in the city of Dourados-MS, Brazil. In the process, the bark of the acuri was manually separated from the rest of the fruit. For the baru, the seeds were separated from the rest of the fruit. The almond was withdrawn from the seeds, so only the endocarp was left for bio-oil production.
The individual standard solutions were prepared in bi-distilled dichloromethane (Merck, Darmstadt, Germany). The 10 µg mL-1 solution prepared for the GC×GC-TOF/MS measurements consisted of 45 compounds: benzene; toluene; xylene; phenol; 2,5-dimethyl phenol; 2-methoxy phenol; naphthalene; 2,6-dimethoxy phenol; eugenol; 2-methoxy-4-propyl phenol; octadecadienoic acid, methyl ester; octadecenoic acid, methyl ester; octadecanoic acid, methyl ester; hexanoic acid, methyl ester; decanoic acid, methyl ester; dodecanoic acid, methyl ester; tetradecanoic acid, methyl ester; hexadecanoic acid, methyl ester; hexadecanoic acid, 15-methy, methyl ester; docosanoic acid, methyl ester; oleic acid; phenol, 4-propyl; phenol, 4-ethyl-2-methoxy and linear hydrocarbons (C7-C28). All standards compounds used were acquired from Sigma Aldrich (Saint Louis, MO, USA).
Biomass analyses
The proximate analysis was used to determine the moisture, volatile matter, fixed carbon and ash contents according to the ASTM (American Society for Testing and Materials) standard methods (E1756-01,35 E872-8236 and E1755-0137).
Pyrolysis
Biomass samples of the baru endocarp and acuri bark were submitted to pyrolysis process. The pyrolysis procedure was performed in a vertical oven, containing a quartz reactor.33 In the pyrolysis procedure, the following values of the governing parameters were set: granulometry (1.0, 2.0, 3.0, 4.0 and 5.0 mm), final temperature of the oven (673.15, 723.15, 773.15, 823.15, 873.15, 923.15 and 973.15 K), residence time at the final pyrolysis temperature (5 min), heating rate (373.15 K min-1), nitrogen flow rate (1 L min-1), and sample mass (10 g). This procedure was triplicated.
Next, the condensable vapors (bio-oil and aqueous phase) were collected after the cooling device, and the liquid products from the pyrolysis were used for proximate analysis.
The condensable vapors (bio-oil and aqueous phase) were separated by liquid-liquid extraction (LLE) using dichloromethane as solvent, and the bio-oil was dried with anhydrous sodium sulfate. The calculation of yield obtained from bio-oil was performed after the evaporation of the solvent, and the obtained fraction was properly weighed to obtain the total biomass yield. Finally, solutions of 1000 µL mL-1 of the bio-oil in dichloromethane were prepared for GC×GC-TOF/MS analysis.
Analysis of bio-oils
The bio-oils were analyzed to determine the water, solids and ash contents as well as the density, pH, value viscosity and stability. Each analysis was performed in triplicate.
The water content of bio-oils was determined using Karl-Fischer (KF) titration technique; the pH value was measured by a pH meter at room temperature. The density of bio-oils was determined from the weight of bio-oils contained in a volume unit (g mL-1), which was measured by using a density bottle at room temperature (about 303 K).
The solids content of bio-oils was defined with insoluble ethanol, and determined by vacuum filtration technique. About 2-3 g of each bio-oil was dissolved in ethanol and filtered through a pre-dried, pre-weighed Whatman No. 3 qualitative filter paper. The liquid was then washed with excess amount of ethanol until the filtrate was clear enough to ensure that there was no organic liquid left on the paper. The
filter paper with the solids was air-dried for approximately 15 min and further dried in an oven at 378.15 K for 30 min. Then the paper was cooled in a desiccator and weighed.35
The ash content of the bio-oil was measured as the amount of residues when heating bio-oil to 1048.15 K with oxygen supply. Direct heating of bio-oil would result in foaming and splashing. Therefore, the first controlled evaporation of water at 378.15 K was performed before a rapid heating to 1048.15 K.38
GC×GC-TOF/MS analysis
A GC×GC-TOF/MS Pegasus-IV system (LECO, St. Joseph, USA) equipped with a liquid nitrogen quad-jet modulator and CTC CombiPal autosampler (CTC Analytics, Carrboro, NC, USA) was used. The electron ionization (EI) with energy of 70 eV, mass acquisition in the range of 50 to 550 m/z at 100 Hz and a detector voltage of 1706 V was used. The transfer line and injector were kept at 553.15 K, while the ion source at 523.15 K. All samples were introduced into the autosampler, using split mode with a ratio of 1:20. A conventional column set was employed: DB-5 (5% phenyl and 95% dimethylpolysiloxane) having 60 m of length, 0.25 mm of internal diameter, and 0.10 µm of film thickness; and DB-17MS (50% phenyl and 50% dimethylpolysiloxane) with 2.15 m of length, 0.18 mm of internal diameter, and 0.18 µm of film thickness. The two columns were purchased from Agilent Technologies (Folsom, CA, USA). The temperature program of the first column started at 323.15 K for 5 min, and was subjected to a heating rate of 277.15 K min-1 up to 553.15 K, remaining at this value for 8 min. The second column temperature was maintained 283.15 K above the temperature of the first column. The modulation period was 7 s, and the hot pulse was 40% of modulation period.
ChromaTOF software version 3.32 (Saint Joseph, MI, USA) was employed for data processing, including tools such as peak finder and deconvolution. Data processing was performed using a signal-to-noise ratio of three. The criteria for accepting a detected compound was a minimum of 800 of similarity match together with a manual inspection of the quality of the mass spectrum of each compound. Identification of bio-oil compounds was performed using some standards, retention index (RI)39 and tentative identification by comparing the mass spectra of unknown components with the ones of the Wiley mass spectra library.40 Data obtained in the total ion current (TIC) color plots processing (retention times, Rt) were transferred to Excel software (Office 2010, USA) in order to obtain graphics dispersion.
the contribution of each compound area to the total area, and for the comparison between the two bio-oils samples. The sum of all peak areas was considered 100% of the sample; for each peak, it was assigned a percentage corresponding to its area. Areas related to solvent and column bleed were not considered in this calculation.
Retention index was calculated using an equivalent first dimension retention time (1t
R) value, obtained by the subtraction of the second dimension retention time (2t
R) from the total retention time, which is a more usual procedure for GC×GC retention index calculations.41 A standard mixture of n-alkane (C7-C28) was injected (1 µL) in GC×GC-TOF/MS under the same conditions carried out for the sample.
Results and Discussion
Characterization of biomass
The biomass samples from the bark of acuri and endocarp of baru were dried in an oven at 378.15 K for a period of 24 h to reduce the moisture content below 10 wt.% wet basis. After drying, the moisture contents of acuri and baru were found to be 1.7 and 1.9 wt.% wet basis, respectively. Measurements showed that the volatile matter of acuri (80.3 wt.%) was similar to the one obtained for the baru (80.1 wt.%), and that the ash content of acuri (4.1 wt.%) was less than that of the baru (5.3 wt.%). The fixed carbon of acuri (13.9 wt.%) was higher than that of the baru (13.3 wt.%).
Thermogravimetrical analysis of the bark of the acuri and endocarp of the baru samples showed a maximum rate of weight loss taking place at the temperature of 592.15 and 609.15 K, respectively. Maximum temperature of pyrolysis was chosen to be equal or above the maximum one reached during the temperature interval referred to the degradation of cellulose, hemicellulose and lignin (424.15 and 753.15 K for bark, and between 429.15 and 773.15 K for endocarp). Based on this data, the temperatures for the generation of bio-oils were selected.
Pyrolysis
It is well known that several parameters influence the pyrolysis yield, such as the type of reactor, pressure, temperature, sweeping gas rate, granulometry, etc.31-33 Figure 1a shows the effect of pyrolysis temperature on the bio-oils yields from baru bark and acuri endocarp residues. The increment of the temperature from 673.15 to 973.15 K leads to variations in the yield of bio-oils from the bark and endocarp pyrolysis. The pyrolysis at 773.15 K shows the
maximum bio-oil yield for both samples. In the optimum pyrolysis conditions, bio-oils yields (m/m) were 30% for bark of acuri and 29% for endocarp of baru, while coal yields (m/m) were 38% for bark of acuri and 36% for endocarp of baru, and gas yields (m/m) were 32% for bark of acuri and 35% for endocarp of baru.
In this study, all bio-oils with a granulometry of 1.0, 2.0, 4.0 and 5.0 mm had lower yields than those obtained with 3.0 mm (Figure 1b). For granulometry smaller than 3.0 mm, higher char yields, but lower liquid yield, were obtained as the granulometry was decreased. For granulometry larger than 3.0 mm, however, the variation in product yields was not so sensitive to the change in granulometry, with a slight decrease of liquid product and a small increase of char products being observed as the granulometry is increased.
650 700 750 800 850 900 950
5 10 15 20 25 30 35
Y
ield / %
Y
ield / %
Temperature / K
Bark Endocarp
(a)
0 1 2 3 4 5 6
15 20 25 30 35
Granulometry / nm
Bark Endocarp
(b)
Figure 1. (a) Effect of temperature on biol-oils yields (pyrolysis conditions: 3.0 mm of granulometry, 1 mL min-1 of nitrogen flow and 10 g
of sample mass, 5 min of residence time at final pyrolysis temperature and heating rate of 373.15 K min-1); (b) effect of granulometry on biol-oils
yields (pyrolysis conditions: 773.15 K of temperature, 1 mL min-1 of
This effect might result from the increase in the heat and mass transfer resistances with the increase in granulometry.42
There is no report in the literature concerning the pyrolysis of acuri bark and baru endocarp for bio-oil production. However, pyrolysis of other similar matrices has already been performed for this purpose. For instance, pyrolysis of dry peach pulp was reported to lead to a maximum yield of 27.7% using a fluidized bed reactor at 823.15 K, and a heating rate of 278.15 K min-1.20 Pomegranate core pyrolysis was performed in a tubular reactor at constant nitrogen flow, with a heating rate of 278.15 K min-1 and final temperature of 873.15 K, to achieve a maximum yield of 22.23%.21 Bio-oil yield was 27.3% for rice husk, and 32.4% for peach pit in quartz reactor.33 Another study reported bio-oil yield of 23.9% for sugar cane straw.34 According to this, the yields obtained from the raw materials considered in the present study were similar to these others types of bio-oils.
Characterization of bio-oils by water, solids and ash contents, density and pH analysis
Bio-oils were characterized by measuring the water, solids and ash content as well as the density and pH value. Each analysis was performed in triplicate.
The water is the most abundant single component in bio-oils. It results from original moisture in feedstocks and dehydration reactions during the fast pyrolysis process. The water contents of bio-oils usually vary in the range of 15-30 wt.% wet basis depending on the initial moisture in feedstocks and pyrolysis conditions.43 The water contents of acuri and baru bio-oils were 21 and 18 wt.% wet basis, respectively. The dehydration reactions during the fast pyrolysis process carried out at higher temperatures led to the decomposition of lignin, thus breaking the OH bonds of its structure.
The solids contents of acuri and baru bio-oils were 4.1 and 3.6 wt.%, respectively. The ash content of bio-oil from acuri was 0.20 wt.% while from baru it was 0.19 wt.%. The density of bio-oils from the pyrolysis of acuri was 1.2 g mL-1; for baru bio-oils, the density was 1.1 g mL-1. The pH value is one of the important bio-oils properties as it is an indicator of their corrosiveness. The pH value of the bio-oil products in the present study was measured to be 4, which is quite similar to wood bio-oil,43 indicating a bio-oil with acid characteristics.
Qualitative chromatographic analysis of bio-oils
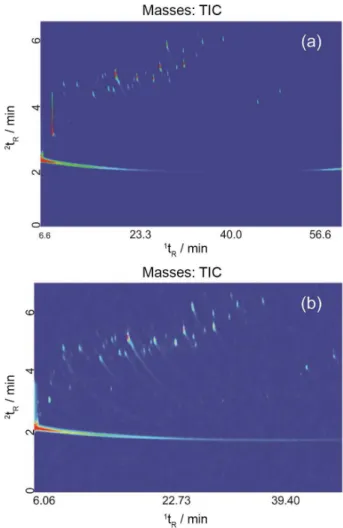
Figure 2 shows the different profiles of the GC×GC-TOF/MS color plots of bio-oils produced from
bark of acuri and endocarp of baru bio-oils. The total numbers of compounds detected after processing in the software ChromaTOF were 385 and 489 for the endocarp and bark bio-oils, respectively. However, only 113 and 71 compounds were tentatively identified in the bio-oils from acuri bark and baru endocarp, respectively.
Sfetsas et al.32 detected 300 compounds in bio-oil samples that were analyzed by GC×GC-TOF/MS. Moraes et al.34 also described the application of GC×GC/TOF-MS to bio-oil from the pyrolysis of sugar cane straw, identifying 123 compounds. Djokic et al.44 identified and quantified bio-oils by GC×GC-FID and GC×GC-TOF/MS, reporting approximately 150 tentatively identified compounds.
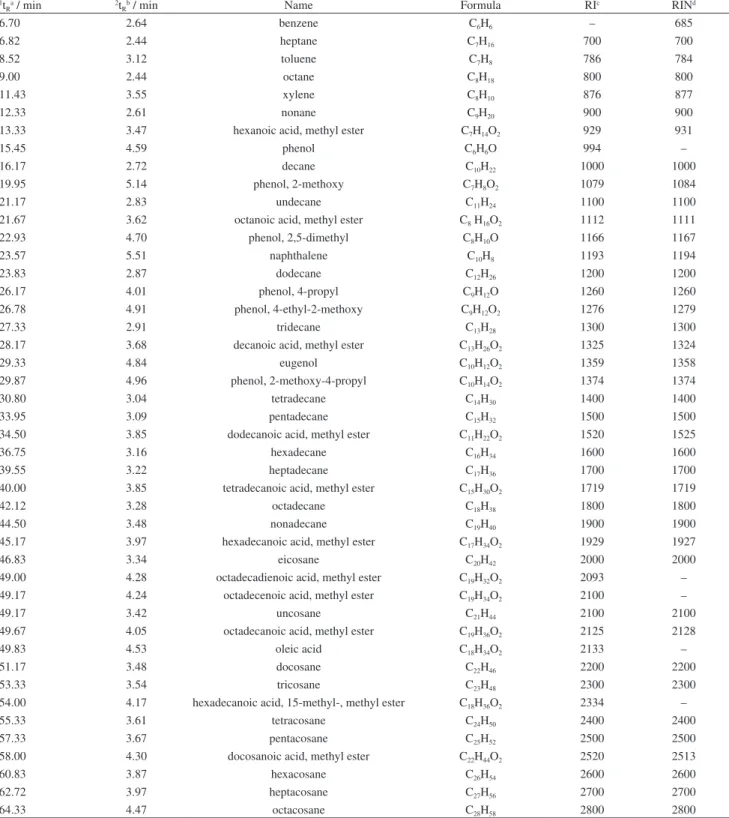
Table 1 presents the list of standards analyzed by GC×GC-TOF/MS in the same conditions of bio-oils, and the retention index calculated using an equivalent first dimension retention time (1t
R) value.
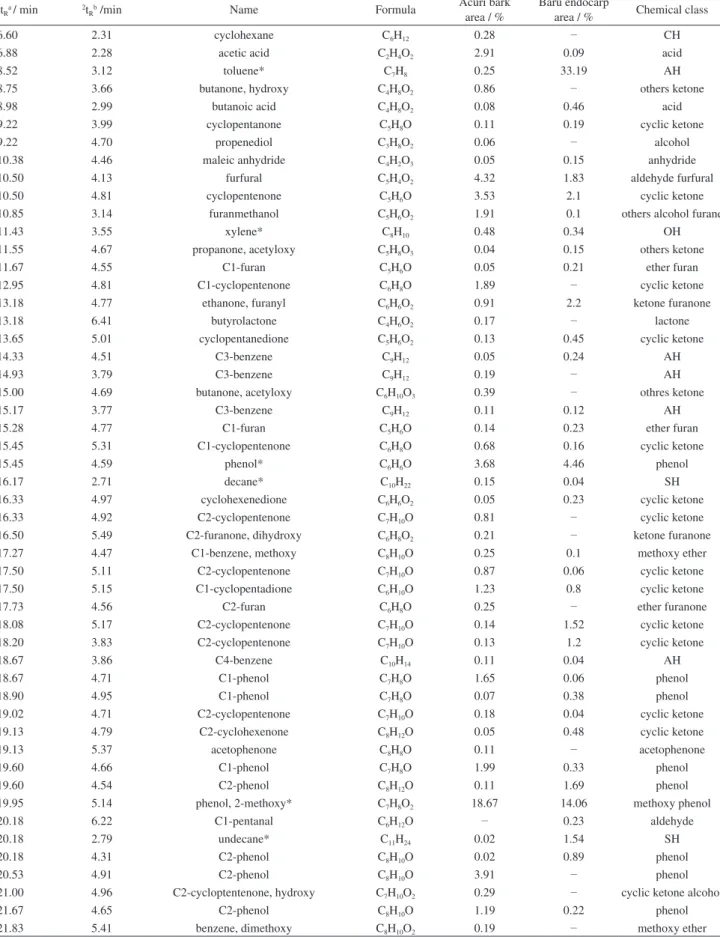
Table 2 presents the list of compounds identified in two bio-oils. The compounds of bio-oils were classified
in the following classes and subclasses: esters, anhydrides, acids, phenols (phenols, methoxy phenols and phenol diols), ketones (ketones, cyclic ketones, benzofuranone, furanones, acetophenones, lactones, others ketones and
ketones alcohol), alcohols (alcohols, others alcohols and others alcohols furanone), ethers (furan ethers , methoxy ethers, furanone ethers), aldeydes (aldehydes and furfural aldehydes), hydrocarbons (saturated hydrocarbons,
Table 1. Standards analyzed by two-dimensional gas chromatography with time-of-flight mass spectrometric detector
1t
Ra / min 2tRb / min Name Formula RIc RINd
6.70 2.64 benzene C6H6 – 685
6.82 2.44 heptane C7H16 700 700
8.52 3.12 toluene C7H8 786 784
9.00 2.44 octane C8H18 800 800
11.43 3.55 xylene C8H10 876 877
12.33 2.61 nonane C9H20 900 900
13.33 3.47 hexanoic acid, methyl ester C7H14O2 929 931
15.45 4.59 phenol C6H6O 994 –
16.17 2.72 decane C10H22 1000 1000
19.95 5.14 phenol, 2-methoxy C7H8O2 1079 1084
21.17 2.83 undecane C11H24 1100 1100
21.67 3.62 octanoic acid, methyl ester C8 H16O2 1112 1111
22.93 4.70 phenol, 2,5-dimethyl C8H10O 1166 1167
23.57 5.51 naphthalene C10H8 1193 1194
23.83 2.87 dodecane C12H26 1200 1200
26.17 4.01 phenol, 4-propyl C9H12O 1260 1260
26.78 4.91 phenol, 4-ethyl-2-methoxy C9H12O2 1276 1279
27.33 2.91 tridecane C13H28 1300 1300
28.17 3.68 decanoic acid, methyl ester C13H26O2 1325 1324
29.33 4.84 eugenol C10H12O2 1359 1358
29.87 4.96 phenol, 2-methoxy-4-propyl C10H14O2 1374 1374
30.80 3.04 tetradecane C14H30 1400 1400
33.95 3.09 pentadecane C15H32 1500 1500
34.50 3.85 dodecanoic acid, methyl ester C11H22O2 1520 1525
36.75 3.16 hexadecane C16H34 1600 1600
39.55 3.22 heptadecane C17H36 1700 1700
40.00 3.85 tetradecanoic acid, methyl ester C15H30O2 1719 1719
42.12 3.28 octadecane C18H38 1800 1800
44.50 3.48 nonadecane C19H40 1900 1900
45.17 3.97 hexadecanoic acid, methyl ester C17H34O2 1929 1927
46.83 3.34 eicosane C20H42 2000 2000
49.00 4.28 octadecadienoic acid, methyl ester C19H32O2 2093 –
49.17 4.24 octadecenoic acid, methyl ester C19H34O2 2100 –
49.17 3.42 uncosane C21H44 2100 2100
49.67 4.05 octadecanoic acid, methyl ester C19H36O2 2125 2128
49.83 4.53 oleic acid C18H34O2 2133 –
51.17 3.48 docosane C22H46 2200 2200
53.33 3.54 tricosane C23H48 2300 2300
54.00 4.17 hexadecanoic acid, 15-methyl-, methyl ester C18H36O2 2334 –
55.33 3.61 tetracosane C24H50 2400 2400
57.33 3.67 pentacosane C25H52 2500 2500
58.00 4.30 docosanoic acid, methyl ester C22H44O2 2520 2513
60.83 3.87 hexacosane C26H54 2600 2600
62.72 3.97 heptacosane C27H56 2700 2700
64.33 4.47 octacosane C28H58 2800 2800
a 1t
R = Retention time in the first dimension; b2tR = retention time in the second dimension; cRI = retention index calculated; RIN = retention index obtained
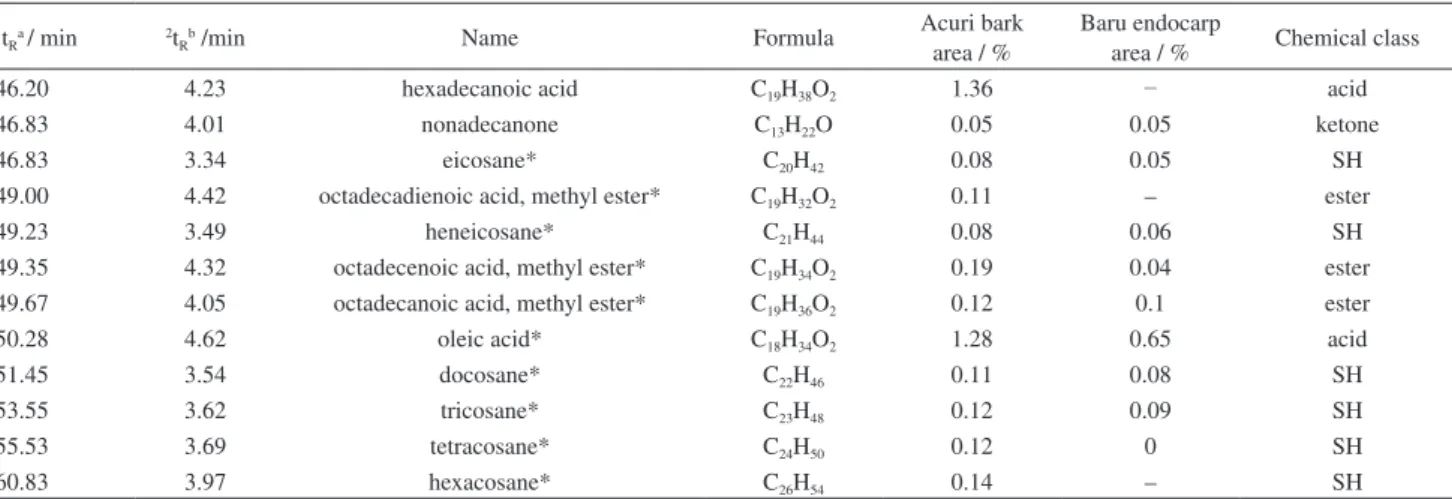
Table 2. Compounds of the bio-oils from acuri bark and baru endocarp tentatively identified by two-dimensional gas chromatography with time-of-flight mass spectrometric detector
1t
Ra / min 2tRb /min Name Formula
Acuri bark area / %
Baru endocarp
area / % Chemical class
6.60 2.31 cyclohexane C6H12 0.28 – CH
6.88 2.28 acetic acid C2H4O2 2.91 0.09 acid
8.52 3.12 toluene* C7H8 0.25 33.19 AH
8.75 3.66 butanone, hydroxy C4H8O2 0.86 – others ketone
8.98 2.99 butanoic acid C4H8O2 0.08 0.46 acid
9.22 3.99 cyclopentanone C5H8O 0.11 0.19 cyclic ketone
9.22 4.70 propenediol C3H8O2 0.06 – alcohol
10.38 4.46 maleic anhydride C4H2O3 0.05 0.15 anhydride
10.50 4.13 furfural C5H4O2 4.32 1.83 aldehyde furfural
10.50 4.81 cyclopentenone C5H6O 3.53 2.1 cyclic ketone
10.85 3.14 furanmethanol C5H6O2 1.91 0.1 others alcohol furane
11.43 3.55 xylene* C8H10 0.48 0.34 OH
11.55 4.67 propanone, acetyloxy C5H8O3 0.04 0.15 others ketone
11.67 4.55 C1-furan C5H6O 0.05 0.21 ether furan
12.95 4.81 C1-cyclopentenone C6H8O 1.89 – cyclic ketone
13.18 4.77 ethanone, furanyl C6H6O2 0.91 2.2 ketone furanone
13.18 6.41 butyrolactone C4H6O2 0.17 – lactone
13.65 5.01 cyclopentanedione C5H6O2 0.13 0.45 cyclic ketone
14.33 4.51 C3-benzene C9H12 0.05 0.24 AH
14.93 3.79 C3-benzene C9H12 0.19 – AH
15.00 4.69 butanone, acetyloxy C6H10O3 0.39 – othres ketone
15.17 3.77 C3-benzene C9H12 0.11 0.12 AH
15.28 4.77 C1-furan C5H6O 0.14 0.23 ether furan
15.45 5.31 C1-cyclopentenone C6H8O 0.68 0.16 cyclic ketone
15.45 4.59 phenol* C6H6O 3.68 4.46 phenol
16.17 2.71 decane* C10H22 0.15 0.04 SH
16.33 4.97 cyclohexenedione C6H6O2 0.05 0.23 cyclic ketone
16.33 4.92 C2-cyclopentenone C7H10O 0.81 – cyclic ketone
16.50 5.49 C2-furanone, dihydroxy C6H8O2 0.21 – ketone furanone
17.27 4.47 C1-benzene, methoxy C8H10O 0.25 0.1 methoxy ether
17.50 5.11 C2-cyclopentenone C7H10O 0.87 0.06 cyclic ketone
17.50 5.15 C1-cyclopentadione C6H10O 1.23 0.8 cyclic ketone
17.73 4.56 C2-furan C6H8O 0.25 – ether furanone
18.08 5.17 C2-cyclopentenone C7H10O 0.14 1.52 cyclic ketone
18.20 3.83 C2-cyclopentenone C7H10O 0.13 1.2 cyclic ketone
18.67 3.86 C4-benzene C10H14 0.11 0.04 AH
18.67 4.71 C1-phenol C7H8O 1.65 0.06 phenol
18.90 4.95 C1-phenol C7H8O 0.07 0.38 phenol
19.02 4.71 C2-cyclopentenone C7H10O 0.18 0.04 cyclic ketone
19.13 4.79 C2-cyclohexenone C8H12O 0.05 0.48 cyclic ketone
19.13 5.37 acetophenone C8H8O 0.11 – acetophenone
19.60 4.66 C1-phenol C7H8O 1.99 0.33 phenol
19.60 4.54 C2-phenol C8H12O 0.11 1.69 phenol
19.95 5.14 phenol, 2-methoxy* C7H8O2 18.67 14.06 methoxy phenol
20.18 6.22 C1-pentanal C6H12O – 0.23 aldehyde
20.18 2.79 undecane* C11H24 0.02 1.54 SH
20.18 4.31 C2-phenol C8H10O 0.02 0.89 phenol
20.53 4.91 C2-phenol C8H10O 3.91 – phenol
21.00 4.96 C2-cycloptentenone, hydroxy C7H10O2 0.29 – cyclic ketone alcohol
21.67 4.65 C2-phenol C8H10O 1.19 0.22 phenol
1t
Ra / min 2tRb /min Name Formula
Acuri bark area / %
Baru endocarp
area / % Chemical class
21.93 4.56 C3-cyclopentanedione C8H12O2 0.07 – cyclic ketone
22.00 4.78 naphthalene, dihydroxy C10H10 0.73 – OH
22.28 4.77 C2-phenol C8H10O 0.15 0.28 phenol
22.93 4.70 phenol, 2,5 dimethyl* C8H10O 1.97 – phenol
23.17 4.97 C- phenol, methoxy C8H10O2 0.79 – methoxy phenol
23.33 5.05 C2-phenol C8H10O 0.1 1.24 phenol
23.33 5.10 C1-phenol, methoxy C8H10O2 0.88 – methoxy phenol
23.57 5.51 naphthalene* C10H8 0.05 1.26 OH
24.17 4.81 C2-benzofuran C10H10O 0.06 0.04 benzofuranone
24.27 3.89 C3-phenol C9H12O 0.75 – phenol
24.62 6.69 dianhydro-α-d-glucopyranose C6H8O4 0.11 3.66 anhydride
25.43 4.68 benzenediol C6H6O2 0.21 – phenol diol
25.55 5.20 dimethoxy toluene C9H12O2 0.19 – methoxy ether
25.55 4.83 C3-phenol C9H12O 0.69 0.18 phenol
26.25 3.92 C6-benzene C12H18 0.05 0.37 AH
26.25 4.67 phenol, 4-propyl* C9H12O 0.05 – phenol
26.25 4.85 C3-phenol C9H12O 0.11 0.17 phenol
26.48 5.16 dimethoxy toluene C9H12O2 0.05 0.28 methoxy ether
26.60 4.88 C1-naphthalene, dihydroxy C11H10 0.19 – OH
26.72 4.92 C3-phenol C9H10O 0.17 – phenol
26.78 4.91 phenol, 4-ethyl-2-methoxy* C9H12O2 8.01 0.05 methoxy phenol
26.78 5.51 dihydroxyacetophenone C8H10O2 0.18 – acethophenone
27.53 4.79 C1-benzenediol C7H8O2 0.14 3.1 phenol diol
27.53 2.99 tridecane* C13H28 0.31 0.12 SH
27.53 5.46 C1-naphthalene C11H10 0.19 0.08 AH
27.77 5.26 C1-phenol methoxy C8H10O2 0.09 0.22 methoxy phenol
27.83 5.42 methoxy vinyl phenol C9H10O2 4.78 – others phenol
28.12 4.83 C1-phenol methoxy C12H16 0.09 5.81 methoxy phenol
29.33 2.77 mequinol C7H8O2 0.29 0.64 methoxy phenol
29.33 4.84 eugenol* C10H12O2 1.54 3.22 methoxy phenol
29.63 5.18 phenol, 2,6-dimethoxy* C8H10O3 3.69 – methoxy phenol
29.87 4.05 C7-benzene C13H20 0.17 – SH
29.87 4.96 phenol, 2-methoxy-4-propyl* C10H14O2 0.79 1.01 methoxy phenol
30.80 3.04 tetradecane* C14H30 0.19 0.38 SH
31.00 5.04 C2-benzenediol C8H10O2 0.17 – phenol diol
31.62 5.60 C2-naphthalene C12H12 0.22 – AH
32.43 6.00 trimethoxy benzene C9H12O3 1.1 – methoxy ether
32.55 2.60 C6-cyclopentene C11H20 0.04 4.06 CH
32.55 5.53 phenol, methoxy, propenyl C10H12O2 5.98 – phenol methoxy
33.50 6.60 C6-cyclopentene C11H20 0.21 – CH
33.95 3.09 pentadecane* C15H32 0.16 0.5 SH
34.77 5.89 C1-benzene, trimethoxy C10H14O3 0.69 – methoxy ether
35.67 6.26 dimethoxy acetophenone C10H12O3 1.28 – methoxyacetophenone
36.75 3.16 hexadecane* C16H34 0.15 0.05 SH
38.38 6.29 phenol, dimethoxy, propenyl C11H14O3 0.05 0.34 methoxy phenol
38.97 3.36 trimethoxy benzene C9H12O 0.15 0.67 methoxy ether
39.55 3.22 heptadecane* C17H36 1.99 1.04 SH
40.25 3.87 phenoxyethanol C8H10O2 0.19 – others alcohol
42.12 3.28 octadecane* C18H38 0.15 0.05 SH
45.27 4.00 acetophenone, hydroxy C17H34O2 0.21 – acetophenone
1t
Ra / min 2tRb /min Name Formula
Acuri bark area / %
Baru endocarp
area / % Chemical class
46.20 4.23 hexadecanoic acid C19H38O2 1.36 – acid
46.83 4.01 nonadecanone C13H22O 0.05 0.05 ketone
46.83 3.34 eicosane* C20H42 0.08 0.05 SH
49.00 4.42 octadecadienoic acid, methyl ester* C19H32O2 0.11 – ester
49.23 3.49 heneicosane* C21H44 0.08 0.06 SH
49.35 4.32 octadecenoic acid, methyl ester* C19H34O2 0.19 0.04 ester
49.67 4.05 octadecanoic acid, methyl ester* C19H36O2 0.12 0.1 ester
50.28 4.62 oleic acid* C18H34O2 1.28 0.65 acid
51.45 3.54 docosane* C22H46 0.11 0.08 SH
53.55 3.62 tricosane* C23H48 0.12 0.09 SH
55.53 3.69 tetracosane* C24H50 0.12 0 SH
60.83 3.97 hexacosane* C26H54 0.14 – SH
a 1t
R = Retention time in the first dimension; b2tR = retention time in the second dimension; CH = cyclic hydrocarbon; AH = aromatic hydrocarbon; OH = others
hydrocarbon; SH = saturated hydrocarbon; *compared with standards in same conditions of analysis (GC×GC-TOF/MS).
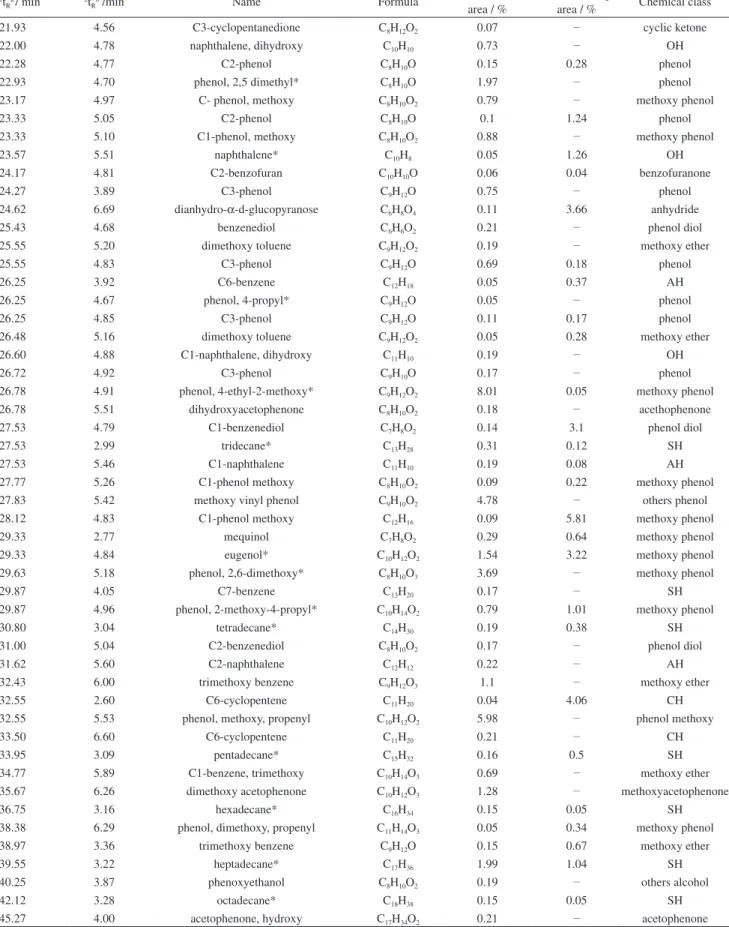
Table 2. Compounds of the bio-oils from acuri bark and baru endocarp tentatively identified by two-dimensional gas chromatography with time-of-flight mass spectrometric detector (cont.)
unsaturated hydrocarbons, aromatic hydrocarbons, cyclic hydrocarbons and others hydrocarbons).
In the bio-oil from bark of acuri, 84 compounds were tentatively identified, while 29 compounds were identified with standards, and classified as phenols, alcohols, acids, esters, ethers, aldehydes, ketones, anhydrides and hydrocarbons. Bio-oil from baru endocarp showed a lower complexity of compounds in relation to the acuri bark, with 48 compounds that were tentatively identified, and 23 that were compared with standards and classified as phenols, alcohols, aldehydes, anhydrides, ethers, acids, esters, ketones and hydrocarbons (Table 2). However, even though the bio-oil baru endocarp presented a lower complexity, several compounds were separated through the use of GC×GC, for example, separation of furfural and cyclopentenone; C1-cyclopentenone and phenol, cyclopentanone and propenediol, etc.
Twenty-three compounds of acuri bark bio-oil and 15 of baru endocarp bio-oil presented a contribution higher than 1% of the total area of the identified chromatographic peaks. These compounds are in bold format in Table 2. The sums of the area percent of all these compounds for the acuri bark and baru endocarp bio-oils were 79.86 and 81.56%, respectively. Using standards, 60.50% of the total area of the compounds (29 compounds) was confirmed for the bio-oil from acuri bark, while 41.23% (23 compounds) was verified for the bio-oil from baru endocarp.
The major compound in the bio-oil from acuri bark was phenol, 2-methoxy (guaiacol), with 18.67% of the total area of compounds. The second compound was phenol, 4-ethyl-2-methoxy, which contributed with 8.01% of the total area of compounds. Phenol, methoxypropenyl (5.98%), was the third major compound (Table 2). Guaiacol, which is among
the major components of peach pulp oil (area percentage above 2%),20 presented an area percentage of 3.32% for the bio-oil from pomegranate seeds,21 while for rice husk bio-oil, guaiacol is the major compound (14.14%).33
Phenols and ketones were major classes in the bio-oil from acuri bark regarding the area percentage: 63.46% (34 compounds) of phenols and 15.32% (27 compounds) of ketones (Table 2). For bio-oil from peach pit, it is reported the predominance of the ketone sand phenols.33 The large amount of phenolic compounds derives from the thermal degradation of lignin that takes place in the pyrolysis of biomass. Lignin is also the major responsible for the formation of residual coal during pyrolysis. On the other hand, ketones arise from the breaking of the molecules of cellulose and hemicellulose.45
Hydrocarbons and phenols were major classes in the bio-oil from baru endocarp in area percentage and number of compounds, with 43.28% (20 compounds) of hydrocarbons, and 41.86% (22 compounds) of phenols (Table 2). The major compound in the bio-oil from baru endocarp was toluene, which contributed with 33.19% of the total area of compounds. Guaiacol contributed with 14.06%, C1-phenol methoxy with 5.81%, and phenol with 4.46% of the total area of compounds (Table 2).
and aromatic hydrocarbons with smaller molecular chain, lower polarity, and therefore lower boiling point. Moreover, the major compound was the toluene, which is the final product in the path to obtain the products from lignin through the process of non-catalytic pylorysis.45 A large number of compounds, phenols, ketones, hydrocarbons, were tentatively identified by GC×GC-TOF/MS in the bio-oils from Kraft mill residues,46 from the residual cakes of the seeds of Crambe abyssinica,47 and from castor seed cake.48 Phenolic compounds are prevalent in the bio-oil from acuri, therefore one can consider the use of bio-oil as a source of such compounds for the chemical industry, after separation of the matrix phase. The same can be said for the bio-oil from baru, which can be considered as a source of aromatics, such as toluene.
Conclusions
To the best knowledge of the authors, this study presented the first qualitative analysis of the bio-oils from baru endocarp and acuri bark using GC×GC-TOF/MS. The two-dimensional technique showed to be suitable for these highly complex samples. However, the number of tentatively identified compounds was 71 and 113 for the bio-oils from baru endocarp and acuri bark, respectively. Using standards, 29 compounds (60.50% of the total area of the compounds) were confirmed for the bio-oil from acuri bark and 23 compounds (41.23%) for baru endocarp bio-oil. The diversity of phenols and hydrocarbons was higher for the acuri bark bio-oil. The major compound in baru endocarp bio-oil was phenol, 2-methoxy. For baru bark bio-oil, toluene was the major compound. The elucidation of the composition of baru endocarp and acuri bark pyrolysates shows that both bio-oils are potentially useful for the production of chemicals. Detailed information on the composition of these bio-oils was provided by GC×GC-TOF/MS analysis. This knowledge can help understanding the pyrolysis process in order to enhance the production of chemicals of interest.
Acknowledgments
T h e a u t h o r s t h a n k C o n s e l h o N a c i o n a l d e Desenvolvimento Científico e Tecnológico (CNPq), Coordenação de Aperfeiçoamento de Pessoal de Nível Superior (CAPES), and Fundação de Amparo a Pesquisa do estado do Rio Grande do Sul (FAPERGS).
References
1. Jenkins, B. M.; Baxter, L. L.; Miles Jr., T. R.; Miles, T. R.; Fuel Process. Technol. 1998, 54, 17.
2. Demirbas, A.; Energy Convers. Manage. 2001, 42, 1357. 3. Carrezza, L. R.; Avila, J. C. C.; Manual Tecnológico de
Aproveitamento Integral dos Frutos de Baru (Dipteryx allata), 2a ed.; Instituto Sociedade, População e Natureza (ISPN):
Brasilia, 2010.
4. Hiane, P. A.; Bogo, D.; Ramos, M. I. L.; Ramos Filho, M. M.; Cienc. Tecnol. Aliment. (Campinas, Braz.) 2003, 23, 206. 5. Wang, P.; Zhan, S.; Yu, H.; Xue, X.; Hong, N.; Bioresour.
Technol. 2010, 101, 3236.
6. Probstein, R. F.; Hicks, R. E.; Synthetic Fuels; Mc Graw-Hill Book Company: New York, USA, 1982.
7. Bridgwater, A. V.; Grassi, G.; Biomass Pyrolysis Liquids Upgrading and Utilization; Elsevier Applied Science: England, 1991.
8. McKendry, P.; Bioresour. Technol. 2002, 83, 37. 9. McKendry, P.; Bioresour. Technol. 2002, 83, 47. 10. Ji-lu, Z.; J. Anal. Appl. Pyrolysis 2007, 80, 30.
11. Özcimen, D.; Karaosmanoglu, F.; Renewable Energy 2004, 29, 779.
12. Miao, X.; Wu, Q.; Yang, C.; J. Anal. Appl. Pyrolysis 2004, 71, 855.
13. Mohan, D.; Pittman, C. U.; Steele, P. H.; Energy Fuels 2006, 20, 848.
14. Li, S.; Xu, S.; Liu, S.; Yang, C.; Lu, Q.; Fuel Process. Technol. 2004, 85, 1201.
15. Pütün, A. E.; Kockar, Ö. M.; Yorgun, S.; Gercel, H. F.; Andresen, J.; Snape, C. E.; Pütün, E.; Fuel Process. Technol. 1996, 46, 49.
16. Zabaniotou, A.; Stavropoulos, G.; Skoulou, V.; Bioresour. Technol. 2008, 99, 320.
17. Bridgwater, A. V.; Advances in Thermochemical Biomass Conversion, Blackie Academic and Professional; Chapman & Hall: Glasgow, 1993.
18. Ioannidou, O.; Zabaniotou, A.; Renewable Sustainable Energy Rev. 2007, 11, 1966.
19. Caglar, A.; Demirbas, A.; Energy Convers. Manage. 2000, 41, 1749.
20. Özbay, N.; Apaydın-Varol, E.; Burcu Uzun, B.; Pütün, A. E.; Energy 2008, 33, 1233.
21. Uçar, S.; Karagöz, J.; J. Anal. Appl. Pyrolysis 2009, 84, 151. 22. Park, H. J.; Dong, J. I.; Jeon, J. K.; Park, Y. K.; Yoo, K. S.; Kim,
S. S.; Kim, J.; Kim, S.; Chem. Eng. J. 2008, 143, 124. 23. Bridgwater, A. V.; Thermal Science 2004, 8, 21.
24. Goyal, H. B.; Seal, D.; Saxena, R. C.; Renewable Sustainable Energy Rev. 2008, 12, 504.
25. Jung, S. H.; Kang, B. S.; Kim, J. S.; J. Anal. Appl. Pyrolysis 2008, 82, 240.
26. Mullen, C. A.; Boateng, A. A.; Energy Fuels 2008, 22, 2104. 27. Şensöz, S.; Angın, D.; Bioresour. Technol. 2008, 99, 5498. 28. Mondello, L.; Tranchida, P. Q.; Dugo, P.; Dugo, G.; Mass
29. Araújo, R. C. S.; Pasa, V. M. D.; Marriott, P. J.; Cardeal, Z. L.; J. Anal. Appl. Pyrolysis 2010, 88, 91.
30. Marsman, J. H.; Wildschut, J.; Evers, P.; Koning, S.; Heeres, H. J.; J. Chromatogr. A 2008, 1188, 17.
31. Marsman, J. H.; Wildschut, J.; Mahfud, F.; Heeres, H. J.; J. Chromatogr. A 2007, 1150, 21.
32. Sfetsas, T.; Michailof, C.; Lappas, A.; Li, Q.; Kneale, B.; J. Chromatogr. A 2011, 1218, 3317.
33. Moraes, M. S. A.; Migliorini, M. V.; Damasceno, F. C.; Georges, F. G.; Almeida, S.; Zini, C. A.; Jacques, R. A.; Caramão, E. B.; J. Anal. Appl. Pyrolysis 2012, 98, 51.
34. Moraes, M. S. A.; Georges, F. G.; Almeida, S. R.; Damasceno, F. C.; Maciel, G. P. S.; Zini, C. A.; Jacques, R. A.; Caramão, E. B.; Fuel Process. Technol. 2012, 101, 35.
35. ASTM E1756-01, Standard Test Method for Determination of Total Solids in Biomass, American Society for Testing and Materials (ASTM): West Conshohocken, PA, USA, 2001. 36. ASTM E872-82, Standard Test Method for Volatile Matter in
the Analysis of Particulate Wood Fuels, American Society for Testing and Materials (ASTM): West Conshohocken, PA, USA, 2001.
37. ASTM E1755-01, Standard Test Method for Ash in Biomass, American Society for Testing and Materials (ASTM): West Conshohocken, PA, USA, 2007.
38. Oasmaa, A.; Peacocke, C.; Properties and Fuel Use of Biomass Derived Fast Pyrolysis Liquids: a Guide; Valtion teknillinen tutkimuslaitos: Vuorimiehentie, Finland, 2010.
39. Van den Dool, H.; Kratz, P. D.; J. Chromatogr. A 1963, 11, 463. 40. NIST, available at http://webbook.nist.gov/chemistry/, accessed
in March 2016.
41. von Mühlen, C.; Zini, C. A.; Caramão, E. B.; Marriott, P. J.; J. Chromatogr. A 2008, 1200, 34.
42. Weerachanchai, P.; Tangsathitkulchai, C.; Tangsathitkulchai, M.; Korean J. Chem. Eng. 2011, 28, 2262.
43. Bridgwater, A. V.; Biomass Bioenergy 2012, 38, 68.
44. Djokic, M. R.; Dijkmans, T.; Yildiz, G.; Prins, W.; Geem, K. M. V.; J. Chromatogr. A 2012, 1257, 134.
45. Thangalazhy-Gopakumar, S.; Adhikari, S.; Gupta, R. B.; Fernando, S. D.; Energy Fuels 2011, 25, 1191.
46. Faccini, S. C.; Dalla Vecchia, I.; Ribeiro, D.; Zini, C. A.; Caramão, E. B.; J. Braz. Chem. Soc. 2013, 24, 1085.
47. Onorevoli, B.; Machado, M. E.; Dariva, C.; Franceschi, E.; Krause, L.; Jaques, R.; Caramão, E. B.; Ind. Crops Prod. 2014, 52, 8.
48. Silva, R. V. S.; Casilli, A.; Sampaio, A. L.; Ávila, B. M. F.; Veloso, M. C. C.; Azevedo, D. A.; Romeiro, G. A.; J. Anal. Appl. Pyrolysis 2014, 106, 152.
Submitted: November 26, 2015
Published online: March 18, 2016