Article
Printed in Brazil - ©2016 Sociedade Brasileira de Química0103 - 5053 $6.00+0.00*e-mail: [email protected]
Electrochemical Investigations of Li
2Fe
0.8-xMn
0.2M
xSiO
4(M = Mg
2+
, Zn
2+) Cathodes
for Lithium Ion Batteries
Shu-Dan Li, Yun Zhao, Chen-Yi Wang and Kun Gao*
School of Chemistry and Materials Science, Shanxi Normal University, 041004 Linfen, China
The Mn2+ and Mg2+ (or Zn2+) co-doped Li
2Fe0.8-xMn0.2MxSiO4 (x = 0.05 and 0.1) are synthesized by a solid-state reaction route. Compared with the single doped Li2Fe0.8Mn0.2SiO4, the co-doped samples show improved cycling performance. The capacity retention can stay above 50% after 50 cycles, which is significantly higher than 30.4% for Li2Fe0.8Mn0.2SiO4. This phenomenon could be attributed to the increased structural stability caused by the incorporation of the electrochemically inactive M2+ ions. However, except for Li
2Fe0.75Mn0.2Mg0.05SiO4, the other samples show decreased capacities, especially in the case of the Mn/Zn co-doping. Further tests indicate that the promotion of Li+ diffusivity may be a key reason for the improved rate and cycling performances. By contrast, the incorporation of Zn2+ impaired the cell performances such as increased internal polarization, hindered charge transfer, decreased Li+ diffusivity. In this work, the Mg2+ with smaller radius seems to be a better choice as the co-doping element at Fe sites than Zn2+.
Keywords: chemically modified electrode, lithium battery, applied electrochemistry, composite and nanocomposite materials
Introduction
Compared with the other cathodes from the silicate
family, Li2FeSiO4 has its own characteristics, such as:
structural rearrangement, stable interface film, thermal regeneration. However, low electronic conductivity and slow lithium-ion diffusion are the biggest obstacles for the
commercial application of Li2FeSiO4. To date, numerous
approaches have been investigated to circumvent these main issues by improving the intrinsic and extrinsic
properties of bulk Li2FeSiO4, by e.g., cation doping, carbon
coating and optimized preparation technology, etc. Some
nano-Li2FeSiO4/C composites with novel shapes, such as
Li2FeSiO4/C/CNS,1 hierarchical shuttle-like Li2FeSiO4/C,2
rod like Li2FeSiO43 and nano-spherical Li2FeSiO4/C,4
can approach or even exceed the theoretical capacity of
166 mAh g-1. Especially, the Li
2FeSiO4/C/MWCNTs
(MWCNTs: multi walled carbon nanotubes) composites
reported by Peng et al.5 had a high discharge capacity of
206.8 mA h g-1 in the second cycle at 0.1 C, even at 20 C,
the electrode could maintain 82 mAh g-1 after 500 cycles.
Moreover, the porous Li2FeSiO4/C nano-composites
prepared by a simple P123 (EO20PO70EO20) assisted
sol-gel method, also delivered a first discharge capacity
of 230 mAh g-1 at 0.1 C corresponding to 1.39 mol Li+
inserted per molecular formula.6 These works indicate that
Li2FeSiO4 has a lot of potential as a promising cathode
material for Li-ion battery.
In the past few years, cation doping was considered as one of the most effective methods to improve electronic conductivity and ion mobility. Various doping elements
have been tried to improve the performance of Li2FeSiO4
materials. For example, Zhang et al.7 studied the impact of
different doping elements including Mg2+,7 Zn2+/Cu2+/Ni2+,8
Cr3+,9 on the electrochemical performance of Li
2FeSiO4, and
some improved results were observed. Among the related
reports, Mn2+ doping is of special concern, because Mn2+
ion can solve into the crystal structure of Li2FeSiO4, and
make up for the intrinsic disadvantage of low theoretical
capacity (166 mAh g-1). For example, Shao et al.10
prepared carbon-coated nanostructured Li2Fe0.5Mn0.5SiO4
via a combination of spray pyrolysis and wet ball milling method, which displayed a discharge capacity as high as
149 mAh g-1. Different from the above optimum Fe/Mn
ratio, Guo et al.11 pointed out that Li
2Fe0.9Mn0.1SiO4/C
synthesized by mechanical activation-solid-state reaction
had a distinguished discharge capacity of 158.1 mAh g-1
in the first cycle.10 Deng et al.12 also reported that the
Li2Fe0.5Mn0.5SiO4 prepared via citric acid assisted sol-gel
170 mAh g-1. Especially, Li
2Fe0.75Mn0.25SiO4/C reported by
Wang and co-workers13 using a modified sol-gel methods,
inserted more than 1.0 mol Li+per molecular formula,
and showed an initial discharge capacity of 201 mAh g-1.
However, all the Mn-doped samples presented worse cycling performance than pristine materials. About this,
Bini et al.14 pointed out that a significant cation disorder
could top up to 80%, based on the Li/Fe(Mn) anti-site defect, which should seriously influence the structural
stability of Li2Fe1-xMnxSiO4/C composites. Moreover,
Chen et al.15 also found out that the amorphization and
structural rearrangements of Li2Fe1-xMnxSiO4 during the
initial cycle and the redox processes of Mn species could be only involved in the first few cycles. Therefore, the structural stability and the efficiency of Mn species are the main problem facing the current ferromanganese lithium silicate materials.
Recently, the introduction of a second dopant has been proposed and widely studied in order to improve the
electrochemical response of cathode material. Huet al.16
compared the properties of single doped LiMn0.9Fe0.1PO4
and co-doped LiMn0.9Fe0.05Mg0.05PO4, and found that
the LiMn0.9Fe0.05Mg0.05PO4 sample has much higher
reversible capacity and rate capability as compared
to LiMn0.9Fe0.1PO4. Cui et al.16 synthesized zinc- and
PO4-doped LiMn2O4 via traditional solid state reaction. The
discharge capacity and cycling performance of the co-doped LiZn0.05Mn1.95O3.96(PO4)0.025 were found to be superior to
single doped LiZn0.05Mn1.95O3.99.
With the expectation to improve the cycling capability
of Li2Fe1-xMnxSiO4 system, we choose common divalent
cations (Mg2+ and Zn2+) combined with Mn2+ as the co-doping
elements at Fe sites and prepared Li2Fe0.8-xMn0.2MxSiO4
(M = Mg or Zn, x = 0.05, 0.1) cathodes by a solid state reaction. Their electrochemical properties were investigated and the possible synergistic mechanisms were discussed.
Experimental
The used metal salts: LiCH3COO.2H2O, FeC2O4.2H2O,
Mn(CH3COO)2.4H2O, ZnO and Mg(CH3COO)2.4H2O, were
purchased from Tianjin Guangfu Fine Chemical Research
Institute, and nano-SiO2 was provided from Henan Huanyu
Power Source Co., Ltd. To prepare cathode materials, the
stoichiometric amounts of SiO2 and metal salts were first
mixed together. To avoid the excessive impurities in the
final products, only 5 wt.% mass of glucose (C6H12O6.H2O)
as carbon source was introduced to the above mixture, and the mixture were ground to fine powder together with an agate mortar and pestle. The resulting intimate mixtures were first dehydrated at 200 °C for 1 h, and then calcined
at 700 °C for 10 h in a vacuum tube furnace keeping
–0.1 MPa vs. normal atmosphere. According to the ratio
of metal salts in the initial precursor, the obtained final products with about 1.6 wt.% carbon (determined by high frequency infrared carbon-sulfur determination, CS 600,
Germany Eltar), were named as Li2Fe0.8-xMn0.2M0.05SiO4 or
Li2Fe0.8-xMn0.2M0.1SiO4 (M = Mg or Zn).
The crystal structures were analyzed by powder X-ray
diffraction (Ultima IV, Rigaku) employing Cu Ka1 radiation
(λ = 0.154056 nm) in the two-theta range of 10-80°. The
morphologies and chemical distributions were observed using a field-emission scanning electron microscope (FESEM, JSM-7500F, Japan JEOL) equipped with an energy dispersive X-ray analyzer (EDX, Oxford Inca PentaFET ×3).
The mixture of Li2Fe0.8-xMn0.2MxSiO4 powder, acetylene
black and polyvinylidene fluoride with a weight ratio of 80:10:10 was used as the cathode. The dry strip cathodes were cut into the disks (16 mm in diameter) containing
6-8 mg active materials. Then, the Li2Fe0.8-xMn0.2MxSiO4/Li
coin cells were fabricated in an Ar-filled glove box. The cycling and rate performances were characterized on
a 5 V per 2 mA battery testing system (Land 2005A,
Wuhan Jinnuo Electronics Co., Ltd.) with cut-off voltage
of 1.5-4.5 V vs. Li+/Li at a constant current from 0.06 to
2 C. The electrochemical impedance spectra (EIS) of the cycled cells were obtained using an electrochemical workstation (CHI 604D, Shanghai CH Instruments, Inc.) in a range of 0.1-100 kHz at the amplitude of 5 mV. The cyclic voltammetry (CV) was also tested with CHI 604D
at a scanning rate of 1.0 mV s-1 at room temperature.
Capacity intermittent titration technique (CITT) proposed
by Tang et al.18 was used to investigate the Li-ion diffusion
coefficient (DLi+). The cell was first
galvanostatically-charged (5 mA g-1) to a certain cutoff voltage, then
potentiostatically-charged at this cutoff voltage until the
current tends to zero. Here, the set current is 0.05 mA g-1.
The whole charge voltage ranges (1.5-4.5 V) were divided into many small voltage regions and separated from one another by 0.1 V. When the charging was completed,
the tested cell was discharged with 10 mA g-1 current to
2.0 V. The above procedures were continuously repeated for five cycles.
Results and Discussion
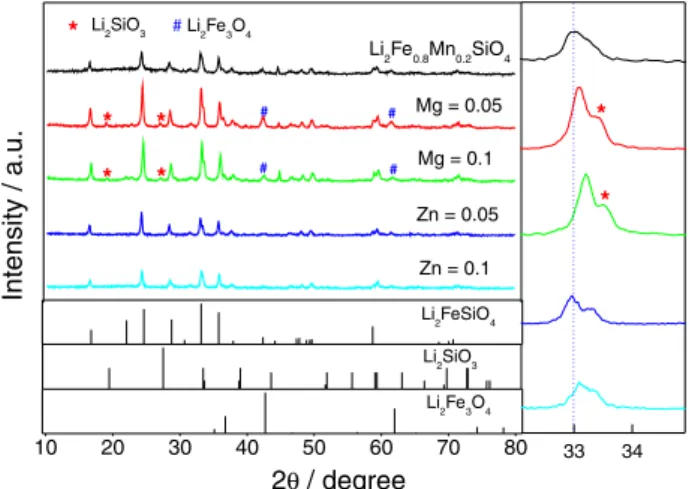
Figure 1 compares the X-ray diffraction (XRD) patterns
of the synthesized Li2Fe0.8-xMn0.2MxSiO4 samples. The
Li2Fe3O4 impurity can be easily detected, small Li2SiO3
alsoemerged in the Mn/Mg co-doped samples. The
indicating that small amounts of co-doping elements have
not changed Li2FeSiO4 architecture. However, the broad
peaks indicate that in neither case the crystallinity is good. The quality of XRD patterns does not allow a good Rietveld refinement, but the matching results of XRD patterns, especially in low angle region, suggest that the
obtained samples should be a mixed phases of P21/n and
Pmn21 co-existance.19 Furthermore, the co-doping of Mg2+
or Zn2+ caused some observable variations in the diffraction
peak positions. For example, the strongest diffraction peak
around 33° gradually shifted toward higher 2θ values with
the increase of Mg content from 0 to 0.1, which could be easily seen from the enlarged patterns located at the right
side of Figure 1. Recently, Dimesso et al.20 reported the
influence of different Mg-ion additions on the structure of
the olivine-structured LiCo1-xMgxPO4. Their results showed
a shift in the positions of the (311) and (121) reflections towards higher diffraction angles. By contrast, due to the
similar radius of Zn2+ (0.74 Å) and Fe2+ (0.76 Å), the Mn/
Zn co-doping did not cause changing in the position of
the reflection at 33°/2θ, and a shoulder peak always well
evident. The XRD results suggest that Mg2+ and Zn2+
have been successfully introduced into Li2FeSiO4 matrix
structure.10,21-23 Moreover, the XRD patterns do not show
any peak related to crystal carbon, which indicates the introduced carbon should be in amorphous form in the final samples.
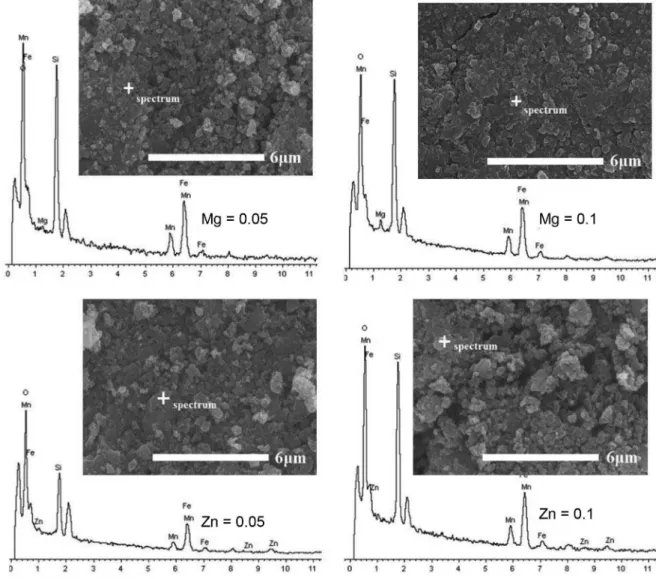
To clarify the surfacial characteristics of Li2Fe0.8-xMn0.2MxSiO4 samples, SEM (scanning electron
microscopy) observations were carried out in combination with EDX tests. As shown in Figure 2, there were no significant morphological differences between these SEM images. All samples exhibited agglomerated particles mainly arising from the employed solid-phase method.
However, based on the local view, the Mn/Zn co-doping seems to produce more serious agglomerates and less uniform particle size. The further EDX (energy dispersive X-ray) spot data in Table 1 show that the atomic ratio of Fe/Mn/M/Si/O in samples was very close to the designed
ratio of the Li2Fe0.8-xMn0.2MxSiO4 formula. It demonstrates
that the co-doped elements incorporate very well with Li2Fe0.8-xMn0.2MxSiO4 host materials.
Although Li2FeSiO4 capacity could be greatly improved
by Mn2+ doping, Li
2Fe0.8Mn0.2SiO4 has been demonstrated
experimentally with the 30-40% capacity loss after
50 charge-discharge cycles in many reports.10,12,24 A similar
observation can be seen in our experiments. As shown in
Figure 3b, the Li2Fe0.8Mn0.2SiO4/Li cell exhibited a serious
capacity loss and only maintained about 30.4% of discharge
capacity at 50th cycle (38.6 mAh g-1), as compared to that
at 1st cycle (127 mAh g-1). Moreover, it is necessary to
point out that the present Li2Fe0.8Mn0.2SiO4 performance
is lower than that in our previous report.25 This is because
that smaller carbon was introduced in the present series experiments in order to avoid more impurities resulting from excessive carbon, and highlight the effect of co-doping.
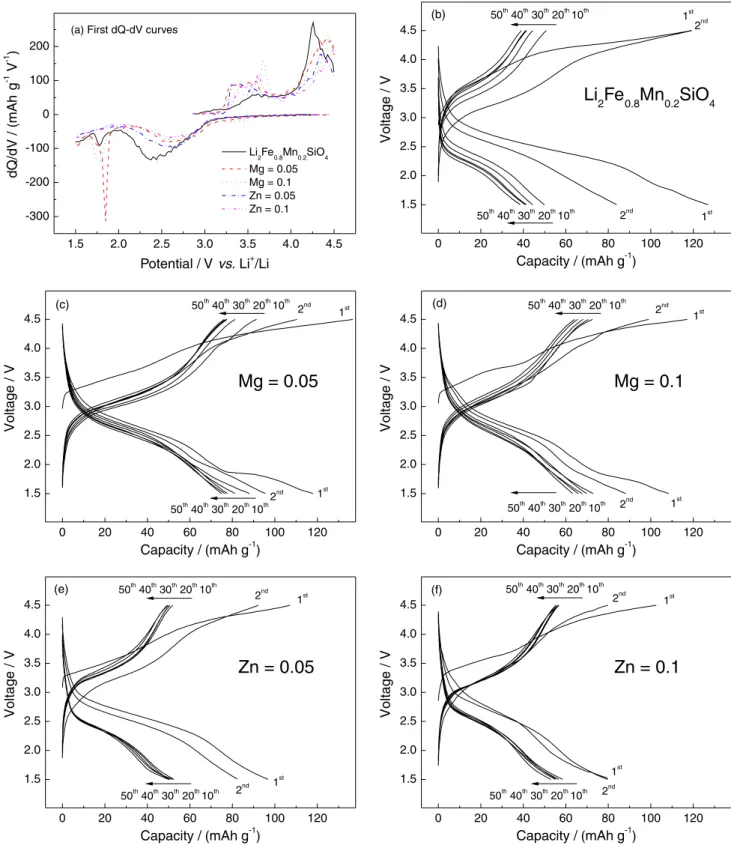
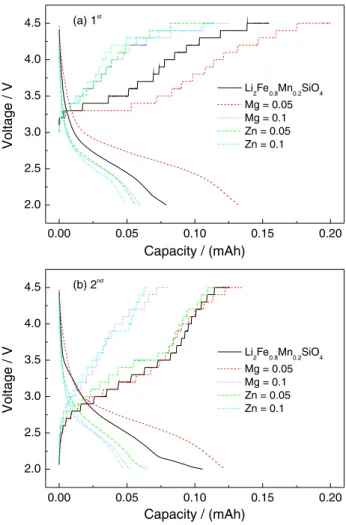
Based on the charge-discharge data in Figure 3, we can
summarize some key things as follow: (i) the initial charge
curves of all samples are obviously higher than those in the subsequent cycles, which means that the single-doping of
Mn2+ or the further co-doping of Mg2+ or Zn2+ do not change
the inherent characteristic of structural rearrangement of
Li2FeSiO4 material;26,27 (ii) the initial dQ-dV curves in
Figure 3a exhibit two clear voltage plateaus at about 3.5 and
4.4 V. After Mg2+ or Zn2+ co-doping, the area of oxidation
peak located at about 3.5 V increases. At the same time, a shift of reduction peak located at about 2.5 V towards the
right means less internal polarization. Novikova et al.28 also
observed similar phenomenon that the slope of the voltage plateau for the co-doped samples is lower than that of single-doped sample, and they attribute it to the improved
ionic conductivity; (iii) the initial discharge capacities of
the co-doped samples are lower than that of 127 mAh g-1
for the single-doped sample. For example, in the case of the Mn/Mg co-doped samples, when x is 0.05 and 0.1, the initial
discharge capacities are 118 and 108.5 mAh g-1, respectively.
As for the Mn/Zn co-doped samples, lower discharge
capacities of 96.8 and 79.6 mAh g-1 are observed. This result
can be interpreted as being due to the fact that the doped Mg2+
or Zn2+ in the crystal lattice cannot be oxidized to M3+ or M4+,
they usually stay electrochemically inactive.29 The fact that
the more M2+ co-doping causes the lower discharge capacities
is in agreement with the above inference. (iv) Cycling
performances have been greatly improved by co-doping. For
Figure 1. XRD patterns of Li2Fe0.8-xMn0.2MxSiO4 (M = Mg and Zn, x = 0, 0.05 and 0.1).
10 20 30 40 50 60 70 80 33 34
# #
# #
#Li
2Fe3O4
Li2Fe0.8Mn0.2SiO4
Zn = 0.1 Mg = 0.1
* *
* *
Zn = 0.05 Mg = 0.05
2 / degreeθ
* Li2SiO3
Intensit
y
/
a.u.
Li2Fe3O4
*
*
Li2SiO3
Li
2FeSiO4
10 20 30 40 50 60 70 80 33 34
# #
# #
#Li 2Fe3O4
Li2Fe0.8Mn0.2SiO4
Zn = 0.1 Mg = 0.1
* *
* *
Zn = 0.05 Mg = 0.05
2 / degreeθ
* Li2SiO3
Intensit
y
/
a.u.
Li2Fe3O4
*
*
Li2SiO3 Li
example, Li2Fe0.8-xMn0.2MgxSiO4 samples show the discharge
capacities of 74.9 and 63.2 mAh g-1 after 50 cycles, when x
is 0.05 and 0.1, and the corresponding capacity retentions are 63.5 and 58.2%, as compared to their initial discharge capacities, respectively. Similarly, capacity retention is 53.6
and 69.5% for Li2Fe0.8-xMn0.2ZnxSiO4 samples, in spite of
their lower discharge capacities of 51.9 and 55.3 mAh g-1
at 50th cycle. We think that the inactive M2+ could have the
buttressing effect on crystal lattice when Li-ions are extracted
from host cathodes.30 Therefore, the co-doped materials have
more resistance to amorphisation than Li2Fe0.8Mn0.2SiO4.
However, along this inference, Li2Fe0.8-xMn0.2MgxSiO4
samples show the opposite result. The capacity retention
of x = 0.1 is only 58.2%, less than 63.5% of x= 0.05. A
similar phenomenon was explained by Huang et al.31that the
existence of too many doping ions in the crystal lattice may induce large changes to the structure and cause the phase
instability. (v) Among all samples, Li2Fe0.75Mn0.2Mg0.05SiO4
shows the most excellent performance in charge-discharge capacity and cycling property.
Figure 2. SEM-EDX spot images of original magnification 10,000× of Li2Fe0.8-xMn0.2MxSiO4 (M = Mg and Zn, x = 0.05 and 0.1).
Table 1. EDX spot data of Li2Fe0.8-xMn0.2MxSiO4 (M = Mg and Zn, x = 0.05 and 0.1)
Sample Atomic / %
Fe K Mn K M2+ K Si K O K
Li2Fe0.75Mn0.2Mg0.05SiO4 12.22 3.39 0.88 16.69 66.82
Li2Fe0.7Mn0.2Mg0.1SiO4 11.74 3.25 1.77 16.22 67.02
Li2Fe0.75Mn0.2Zn0.05SiO4 12.62 3.32 0.83 16.71 66.52
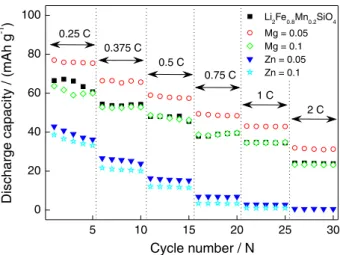
Due to low Li+ diffusivity and poor electronic
conductivity of silicate cathodes, Li2MSiO4 materials
usually have a major drawback to their capacity performances, especially at high rates. As shown in
Figure 4, all Li2Fe0.8-xMn0.2MxSiO4/Li cells present poor rate
performances in the current range from 0.25 to 2 C. Among
these samples, only Li2Fe0.75Mn0.2Mg0.05SiO4/Li cell has an
improved rate performance, whose discharge capacity is
78.1, 69.7, 58.2, 49.8, 40.7 and 35.6 mAh g-1 at the current
rates of 0.25, 0.375, 0.5, 0.75, 1.0, 2.0 C, respectively.
1.5 2.0 2.5 3.0 3.5 4.0 4.5
-300 -200 -100 0 100 200
(a) First dQ-dV curves
dQ/dV / mAh( g -1 V -1 )
Potential / Vvs.Li+/Li
Li
2Fe0.8Mn0.2SiO4 Mg = 0.05 Mg = 0.1 Zn = 0.05 Zn = 0.1
0 20 40 60 80 100 120
1.5 2.0 2.5 3.0 3.5 4.0 4.5 (b) 1st 2nd 50th 40th 30th 20th 10th 50th 40th 30th 20th 10th 2nd V o lt a g e / V
Capacity / (mAh g-1)
Li
2Fe
0.8Mn
0.2SiO
41st
0 20 40 60 80 100 120
1.5 2.0 2.5 3.0 3.5 4.0 4.5 (c) 1st 2nd 50th 40th 30th 20th 10th 50th40th30th20th10th 2nd
V o lt a g e / V
Capacity / (mAh g-1)
Mg = 0.05
1st
0 20 40 60 80 100 120
1.5 2.0 2.5 3.0 3.5 4.0 4.5 (d) 1st 2nd 50th40th30th20th10th
50th40th30th20th10th 2nd
V o lt a g e / V
Capacity / (mAh g-1)
Capacity / (mAh g-1)
Mg = 0.1
1st
0 20 40 60 80 100 120
1.5 2.0 2.5 3.0 3.5 4.0 4.5 (e) 1st 2nd 50th40th30th20th10th 50th40th30th20th10th 2nd
V o lt a g e / V
Capacity / (mAh g-1)
Zn = 0.05
1st
0 20 40 60 80 100 120
1.5 2.0 2.5 3.0 3.5 4.0 4.5 (f) 1st 2nd 50th40th30th20th10th
50th 40th 30th 20th 10th 2nd V o lt a g e / V
Zn = 0.1
1st
Figure 3. Typical initial dQ/dV and charge-discharge curves of Li2Fe0.8-xMn0.2MxSiO4/Li cells (M = Mg and Zn, x = 0, 0.05 and 0.1).
1.5 2.0 2.5 3.0 3.5 4.0 4.5
-300 -200 -100 0 100 200
(a) First dQ-dV curves
dQ/dV / mAh( g -1 V -1 )
Potential / Vvs.Li+/Li Li
2Fe0.8Mn0.2SiO4
Mg = 0.05 Mg = 0.1 Zn = 0.05 Zn = 0.1
0 20 40 60 80 100 120
1.5 2.0 2.5 3.0 3.5 4.0 4.5 (b) 1st 2nd 50th 40th 30th 20th 10th 50th 40th 30th 20th 10th 2nd V o lt a g e / V
Capacity / (mAh g-1)
Li
2Fe
0.8Mn
0.2SiO
4 1st0 20 40 60 80 100 120
1.5 2.0 2.5 3.0 3.5 4.0 4.5 (c) 1st 2nd 50th 40th 30th 20th 10th 50th40th30th20th10th 2nd
V o lt a g e / V
Capacity / (mAh g-1)
Mg = 0.05
1st0 20 40 60 80 100 120
1.5 2.0 2.5 3.0 3.5 4.0 4.5 (d) 1st 2nd 50th40th30th20th10th
50th40th30th20th10th 2nd
V o lt a g e / V
Capacity / (mAh g-1)
Capacity / (mAh g-1)
Mg = 0.1
1st0 20 40 60 80 100 120
1.5 2.0 2.5 3.0 3.5 4.0 4.5 (e) 1st 2nd 50th40th30th20th10th 50th40th30th20th10th 2nd
V o lt a g e / V
Capacity / (mAh g-1)
Zn = 0.05
1st0 20 40 60 80 100 120
1.5 2.0 2.5 3.0 3.5 4.0 4.5 (f) 1st 2nd 50th40th30th20th10th
50th 40th 30th 20th 10th 2nd V o lt a g e / V
However, when Mg2+ content increases to 0.1, the sample
has a similar performance to that of Li2Fe0.8Mn0.2SiO4. By
contrast, both the Mn/Zn co-doped samples presented worse
rate performances, especially Li2Fe0.7Mn0.2Zn0.1SiO4 even
does not work at 2.0 C.
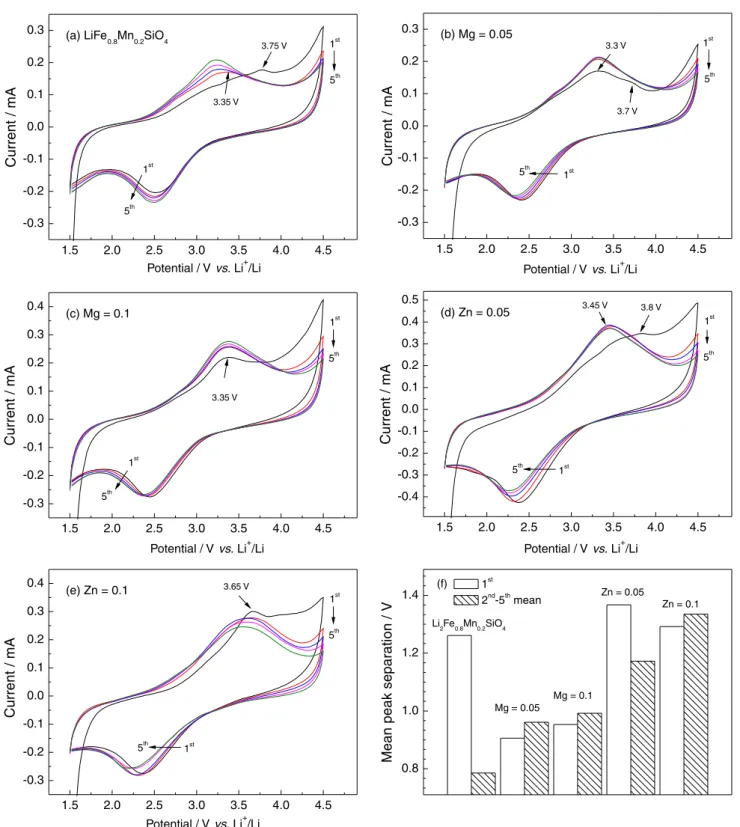
Figure 5 depicts the CV curves of Li2Fe0.8-xMn0.2MxSiO4/Li
cells, conducted at a scan rate of 1.0 mV s-1 to elucidate
the redox chemistry in a better way. All the CV profiles are similar. A strong reduction peak with good repeatability appears at about 2.4 V in the cathodic scan, while the anodic scan exhibits two broad oxidation peaks, in which the lower voltage oxidation peak (LOP) at about 3.4 V can
be attributed to the dominating Fe2+/Fe3+ redox process
on cycling,6,32 it is located at a slightly higher potential
(3.6-3.8 V) in the first cycle. In view of Wang et al.33 the CV
curves of Li2MnSiO4/Li cells showed two oxidation peaks
located at 4.4 and 4.8 V corresponding to the Mn2+/Mn3+
and Mn3+/Mn4+ redox couples during the initial charge,
respectively. Then they moved obviously to the lower voltages in the subsequent cycles. Therefore, the higher voltage oxidation peak (HOP, > 4.2 V) in our experiment
can be mainly associated with the Mn2+/Mn3+ redox couple
except for the initial charge. Possibly, there may be a few
Fe3+/Fe4+ reactions occurred at local crystal structure.
In the case of Li2Fe0.8Mn0.2SiO4, the oxidation peak
(> 4.2 V) of the second scan is significantly lower than that of the first cycle, as shown in Figure 5a. This observation just
matches up with the conclusion suggested by Chen et al.15
that the redox processes of Mn species only can be involved in the first few charge-discharge cycles. As for the Mn/Mg co-doped samples (Figures 5b and 5c), we can notice three
changes: (i) during the first lithium de-intercalation process,
the Mn/Mg co-doped samples have lower first LOP than the
other samples. When x= 0.05, LOP presents a significant
peak at 3.3 V accompanied with a weak transition peak
at 3.7 V. However, when x = 0.1, the LOP always stays at about 3.35 V. By contrast, the corresponding LOP locate
at 3.75 V for Li2Fe0.8Mn0.2SiO4, 3.8 and 3.65 V for the Mn/
Zn co-doped samples, respectively. This fact indicates that, the Mg-substituted system has a smaller inner polarization, which usually means an easier lithium de-intercalation from
host cathode. Here, the lower HOP suggests that Mg2+ doping
could reduce the energy barrier for lithium migration; (ii) the
intensity of HOP (> 4.2 V) only showed a slight decline with
increasing cycles, suggesting that the incorporation of Mg2+
may be better to improve the oxidation from M3+ to M4+; (iii)
CV profiles of Li2Fe0.8-xMn0.2MgxSiO4 samples have a better
reproducibility in the test range of 1st-5th cycle, implying
the better electrode stability. By contrast, the Mn/Zn co-doped samples have extremely similar CV characteristics to
Li2Fe0.8Mn0.2SiO4 sample except for some slight differences
in redox peak position and response current intensity. Notice that the HOP intensity (> 4.2 V) is smaller and decreases
rapidly; this suggests that the incorporation of Zn2+ could
impair the oxidation from M3+ to M4+.
Then, we calculated the intervals between the oxidation peak and the reduction peak during the first five CV cycles, which have been compared in Figure 5f. Because the oxidation peaks of HOP (> 4.2 V) is incomplete, limited by the voltage upper limit of 4.5 V, all the data come from the oxidation peak around 3.4 V and the reduction peak around 2.4 V. Moreover, the mean peak separation were
used in the 2nd-5th CV cycles, the single difference was used
at the first CV when considering structural rearrangement.
This indicates that the introduction of Mg2+ can help to
lessen the inner polarization during the initial structural
rearrangement process. In the subsequent CV (2nd-5th),
the single doped sample (Li2Fe0.8Mn0.2SiO4) presents the
smallest value (0.7748 V), while the peak intervals after M2+
co-doping have different growth. Especially, in either case, the Mn/Zn co-doped samples show noticeable increases
in polarization. The fact that more M2+ doping leads to
the greater polarization suggests that the incorporation
of electrochemically inactive M2+ ions could impede the
extraction of Li-ions at LOP to some extent.29 This result
seems to be contradictory with cycling performances, because smaller resistance usually means better cell performance. However, note that CV data only present
the mean peak intervals of 2nd-5th scan, thus taking them
as evidence to explain long-cycling performance seems to be insufficient. In addition, the absence of HOP (> 4.2 V) might also bring certain errors in CV results.
Figure 6 shows XRD patterns and EIS spectra of the
cycled Li2Fe0.8-xMn0.2MxSiO4 samples. In Figure 6a, all
the XRD patterns are similar and appear no sharp peaks. This proved a transformation from crystal structure into
amorphous phase occurred after 50 cycles. Different from prior CV results presented in the first few cycles, the co-doped samples did not show a long-life advantage in structural stability. The Nyquist plots shown in Figure 6b are composed of a semicircle at middle frequency and a slope line at low frequency. The sloped line is related to the
Li+ diffusion in the electrode material, and the semicircle
is connected with the interfacial impedance (Ri) including
charge-transfer impedance (Rct) and solid electrolyte
interphase impedance (RSEI).34 The spectra can be fitted by
the equivalent circuit in our previous work.25 The obtained
Ri values were 278 Ω for Li2Fe0.8Mn0.2SiO4, 289 and 404 Ω
for the Mg co-doped samples, 626 and 667 Ω for the Zn
co-doped samples, respectively. This result indicates that
1.5 2.0 2.5 3.0 3.5 4.0 4.5 -0.3 -0.2 -0.1 0.0 0.1 0.2 0.3
Potential / Vvs. Li+/Li
5th 1st 3.75 V 5th C u rr e n t / m A 1st
(a) LiFe0.8Mn0.2SiO4
3.35 V
1.5 2.0 2.5 3.0 3.5 4.0 4.5 -0.3 -0.2 -0.1 0.0 0.1 0.2 0.3
Potential / Vvs. Li+/Li
5th 1st 3.7 V 5th C u rr e nt / m A 1st
(b) Mg = 0.05
3.3 V
1.5 2.0 2.5 3.0 3.5 4.0 4.5 -0.3 -0.2 -0.1 0.0 0.1 0.2 0.3 0.4
Potential / Vvs. Li+/Li
5th 1st 5th C u rr e nt / m A 1st
(c) Mg = 0.1
3.35 V
1.5 2.0 2.5 3.0 3.5 4.0 4.5 -0.4 -0.3 -0.2 -0.1 0.0 0.1 0.2 0.3 0.4 0.5
Potential / Vvs. Li+/Li
3.45 V
5th 1st
5th C u rr e n t / m A 1st
(d) Zn = 0.05 3.8 V
1.5 2.0 2.5 3.0 3.5 4.0 4.5 -0.3 -0.2 -0.1 0.0 0.1 0.2 0.3 0.4 5th 1st 5th C u rr e nt / m A
Potential / Vvs. Li+/Li
1st
(e) Zn = 0.1 3.65 V
0.8 1.0 1.2 1.4
Zn = 0.1 Zn = 0.05
Mg = 0.1 Mg = 0.05
Li2Fe0.8Mn0.2SiO4
M e a n p e a k s e p a ra ti o n / V 1st 2nd-5thmean (f)
Figure 5. The first five CV profiles (a-e) and mean peak separation; (f) of Li2Fe0.8-xMn0.2MxSiO4/Li cells (M = Mg and Zn, x = 0, 0.05 and 0.1).
1.5 2.0 2.5 3.0 3.5 4.0 4.5
-0.3 -0.2 -0.1 0.0 0.1 0.2 0.3
Potential / Vvs. Li+/Li
5th 1st 3.75 V 5th C u rr e n t / m A 1st
(a) LiFe0.8Mn0.2SiO4
3.35 V
1.5 2.0 2.5 3.0 3.5 4.0 4.5
-0.3 -0.2 -0.1 0.0 0.1 0.2 0.3
Potential / Vvs. Li+/Li
5th 1st 3.7 V 5th C u rr e nt / m A 1st
(b) Mg = 0.05
3.3 V
1.5 2.0 2.5 3.0 3.5 4.0 4.5
-0.3 -0.2 -0.1 0.0 0.1 0.2 0.3 0.4
Potential / Vvs. Li+/Li
5th 1st 5th C u rr e nt / m A 1st
(c) Mg = 0.1
3.35 V
1.5 2.0 2.5 3.0 3.5 4.0 4.5
-0.4 -0.3 -0.2 -0.1 0.0 0.1 0.2 0.3 0.4 0.5
Potential / Vvs. Li+/Li
3.45 V
5th 1st
5th C u rr e n t / m A 1st
(d) Zn = 0.05 3.8 V
1.5 2.0 2.5 3.0 3.5 4.0 4.5
-0.3 -0.2 -0.1 0.0 0.1 0.2 0.3 0.4 5th 1st 5th C u rr e nt / m A
Potential / Vvs. Li+/Li
1st
(e) Zn = 0.1 3.65 V
0.8 1.0 1.2 1.4
Zn = 0.1 Zn = 0.05
Mg = 0.1 Mg = 0.05
Li2Fe0.8Mn0.2SiO4
M e a n p e a k s e p a ra ti o n / V 1st
2nd-5thmean
the co-dopping lead to bigger Ri values, especially for the
incorporation of Zn2+. Therefore, the above XRD and EIS
results cannot give sufficient reasons for the improved
performance of Li2Fe0.75Mn0.2Mg0.05SiO4. To further
reveal this issue, we carried out CITT measurements of Li2Fe0.8-xMn0.2MxSiO4/Li cells.
The CITT technique was used to determine DLi+ values.
Figure 7 compares the obtained CITT curves with various stair-step shapes. It can be seen that the voltage increases gradually in galvano-charge step and the current decreases gradually in the potentio-charge step. According to the
reports,35 the following equation can be derived from the
spherical diffusion model.
(1)
where q is the ratio of Qp and Qg, tG is the galvano-charge
time (s), r is the mean crystallite size, αj is constant.
Therefore, the equation gives the analytical solution
associating q value with the DLi+. We can get the desired
data from the CITT curves in Figure 7, and then select the equations fitted by linear least-square fits according to for
different ranges of q value to calculate DLi+ values.36
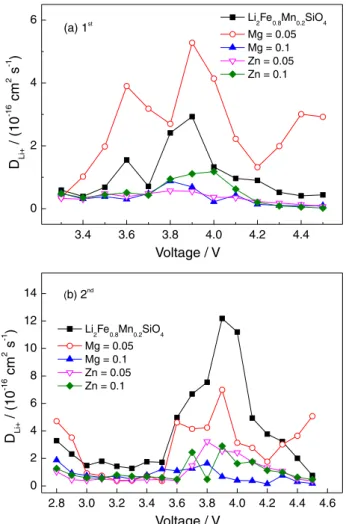
The obtained DLi+ values are compared in Figure 8.
It can be seen that the DLi+ values varied non-linearly
with the charge voltage as a wavy shape, all the DLi+
values are almost in the same order of magnitude (10-16).
Although the curve shapes are similar, the DLi+ values of
Li2Fe0.75Mn0.2Mg0.05SiO4 in the first cycle are higher than that
of Li2Fe0.8Mn0.2SiO4 sample, especially when the voltage is
higher than 4.2 V. This superiority is still retained during the second charging, in spite of the reversed results in the
range of 2.8-4.2 V. The higher DLi+ values mean better Li
diffusivity, so it proves that the incorporation of Mg2+ can
promote the extraction/insertion of Li+ in the corresponding
range. Also, note that the most DLi+ values at the same
voltage in the second charging are higher than that in the
first charging. However, for the Li2Fe0.75Mn0.2Mg0.05SiO4
sample, the obtained DLi+ data in the first and second
cycle are comparable. Recently, Araujo et al.37 pointed
out that the DLi+ values of Li2FeSiO4 at room temperature
Figure 7. The first two CITT curves of Li2Fe0.8-xMn0.2MxSiO4/Li cells (M = Mg and Zn, x = 0, 0.05 and 0.1).
10 20 30 40 50 60 70 80
2 / degreeθ
Zn = 0.05
Zn = 0.1 Mg = 0.1 Mg = 0.05
In
te
n
s
it
y
/
a
.u
.
Li2Fe0.8Mn0.2SiO4 (a)
0 500 1000 1500 2000 2500
0 250 500 750 1000
0 200 400 600 800 0
100 200
(b) Li2Fe0.8Mn0.2SiO4
Mg = 0.05 Mg = 0.1 Zn = 0.05 Zn = 0.1
-Z
''
/
Ω
Z' /Ω
Figure 6. XRD patterns (a) of Li2Fe0.8-xMn0.2MxSiO4 after 50 cycles; (b) EIS spectra of the cycled cells.
10 20 30 40 50 60 70 80
2 / degreeθ
Zn = 0.05
Zn = 0.1 Mg = 0.1 Mg = 0.05
In
te
n
s
it
y
/
a
.u
.
Li2Fe0.8Mn0.2SiO4
(a)
0 500 1000 1500 2000 2500
0 250 500 750 1000
0 200 400 600 800 0
100 200
(b) Li2Fe0.8Mn0.2SiO4
Mg = 0.05 Mg = 0.1 Zn = 0.05 Zn = 0.1
-Z
''
/
Ω
was only about 10-20-10-17 cm2 s-1, less than other with
cathode materials (10-13-10-7 cm2 s-1), therefore the kinetics
of diffusion performance need to be improved. In our
experiment, the Mg2+ co-doping showed some positive
effects on Li+ mobility, especially above 4.2 V range, this
may be one reason for its improved cell performances. It is need to point out that, because this study only compares the
DLi+ values of the first two charging, so the corresponding
data might not reflect the real potential of electrodes for their long cycling.
Conclusions
In this study, Li2Fe0.8-xMn0.2MxSiO4 (M = Mg and Zn,
x = 0, 0.05 and 0.1) show very distinct cell performances. Firstly, the incorporation of the electrochemically inactive
M2+ ions can serve to strengthen crystal structure and
improve the cycling performance significantly. However, note that the capacities show a serious loss with cycling
for the Mn/Zn co-doped samples. Secondly, the Mg2+
co-doping can bring more benefits, such as the increased capacity (x = 0.05) and the improved rate performance.
Thirdly, the XRD and EIS results showed that co-doping leads to the enlarged interfacial resistance and amorphous crystal structure after 50 cycles, but the CV and CITT
results suggest that the Mg2+ co-doping should improve
Li-ion diffusion behavior at least in the first several cycles, especially above 4.2 V range. In conclusion, by comparing
the Mg2+ and Zn2+ co-doped samples, the Mg2+ with smaller
radius seems to be a better choice in this work. The study on
the Fe-site co-doping of Li2FeSiO4 including more elements
will be performed in the future.
Acknowledgments
This work was financially supported by National Natural Science Foundation of China (NSFC) (No. 21003087) and Natural Science Foundation of Shanxi Province (No. 2014011017-4) and National Student Innovation Training Program of China (No. 201510118002) and Students Innovation Training Program of Shanxi Province (No. 2015152).
References
1. Yang, J. L.; Kang, X. C.; Hu, L.; Gong, X.; He, D. P.; Peng, T.; Mu, S. C.; J. Alloys Compd.2013, 572, 158.
2. Yang, J. L.; Kang, X. C.; He, D. P.; Peng, T.; Hu, L.; Mu, S. C.;
J. Alloys Compd. 2013, 242, 171.
3. Devaraju, M. K.; Tomai, T.; Honma, I.; Electrochim. Acta2013,
109, 75.
4. Qu, L.; Fang, S. H.; Zhang, Z. X.; Yang, L.; Hirano, S. I.; Mater. Lett. 2013, 108, 1.
5. Peng, G.; Zhang, L. L.; Yang, X. L.; Duan, S.; Liang, G.; Huang, Y. H.; J. Alloys Compd. 2013, 570, 1.
6. Wu, X. Z.; Jiang, X.; Huo, Q. S.; Zhang, Y. X.; Electrochim. Acta2012, 80, 50.
7. Zhang, S.; Deng, C.; Fu, B. L.; Yang, S. Y.; Ma, L.;
J. Electroanal. Chem.2010, 644, 150.
8. Deng, C.; Zhang, S.; Yang, S. Y.; Fu, B. L.; Ma, L.; J. Power
Sources 2011, 196, 386.
9. Zhang, S.; Deng, C.; Fu, B. L.; Yang, S. Y.; Ma, L.; Electrochim. Acta2010, 55, 8482.
10. Shao, B.; Abe, Y.; Taniguchi, I.; Powder Technol. 2013,
235, 1.
11. Guo, H. J.; Cao, X.; Li, X. Q.; Li, L. M.; Li, X. H.; Wang, Z. X.; Peng, W. J.; Li, Q. H.; Electrochim. Acta 2010, 55, 8036. 12. Deng, C.; Zhang, S.; Yang, S. Y.; J. Alloys Compd. 2009, 487,
L18.
13. He, X. G.; Yang, G. L.; Sun, L. Q.; Xie, H. M.; Wang, R. S.;
Chem. J. Chinese U. 2010, 31, 2148.
14. Bini, M.; Ferrarin, S.; Capsoni, D.; Spreafico, C.; Tealdi, C.; Mustarelli, P.; J. Solid State Chem. 2013, 200, 70.
15. Chen, R. C.; Heinzmann, R.; Mangold, S.; Chakravadhanula, V. S. K.; Hahn, H.; Indris, S.; J. Phys. Chem. C2013, 117, 884. 16. Hu, C.; Yi, H.; Fang, H.; Yang, B.; Yao, Y.; Ma, W.; Dai, Y.;
Electrochem. Commun. 2010, 12, 1784.
17. Cui, P.; Liang, Y. S.; Solid State Ionics2013, 249-250, 129. 18. Tang, X. C.; Li, L. Q.; Huang, B. Y.; He, Y. H.; Solid State Ionics
2006, 177, 687.
19. Sirisopanaporn, C.; Dominko, R.; Masquelier, C.; Armstrong, A. R.; Maliad, G.; Bruce, P. G.; J. Mater. Chem.2011, 21, 17823. 20. Dimesso, L.; Spanheimer, C.; Jaegermann, W.; J. Alloys
Compd.2014, 582, 69.
21. Dong, Y. Z.; Zhao, Y. M.; Duan, H.; J. Electroanal. Chem.
2011, 660, 14.
22. Dimesso, L.; Spanheimer, C.; Jaegermann, W.; J. Power
Sources2013, 243, 668.
23. Muraliganth, T.; Manthiram, A.; J. Phys. Chem. C2010, 114, 15530.
24. Gong, Z. L.; Li, Y. X.; Yang, Y.; Electrochem. Solid-State
Lett.2006, 9, A542.
25. Gao, K.; Ionics 2014, 20, 809.
26. Liivat, A.; Solid State Ionics2012, 228, 19.
27. Eames, C.; Armstrong, A. R.; Bruce, P. G.; Islam, M. S.;
Chem. Mater.2012, 24, 2155.
28. Novikova, S.; Yaroslavtsev, S.; Rusakov, V.; Kulova, T.; Skundin, A.; Yaroslavtsev, A.; Electrochim. Acta2014, 122, 180.
29. Reddy, M. V.; Jie, T. W.; Jafta, C. J.; Ozoemena, K. I.; Mathed, M. K.; Nairf, A. S.; Peng, S. S.; Idris, M. S.; Balakrishna, G.; Ezema, F. I.; Chowdari, B. V. R.; Electrochim. Acta2014, 128, 192.
30. Singh, G.; Gupta, S. L.; Prasad, R.; Auluck, S.; Gupta, R.; Sil, A.; J. Phys. Chem. Solids 2009, 70, 1200.
31. Huang, J. S.; Yang, L.; Liu, K. Y.; Tang, Y. F.; J. Power Sources
2010, 195, 5013.
32. Singh, S.; Mitra, S.; Electrochim. Acta2014, 123, 378. 33. Wang, F.; Wang, Y. M.; Sun, D. M.; Wang, L.; Yang, J.; Jia,
H. P.; Electrochim. Acta2014, 119, 131.
34. Nytén, A.; Stjerndahl, M.; Rensmo, H.; Siegbahn, H.; Armand, M.; Gustafsson, T.; Edstrom, K.; Thomas, J. O.;
J. Mater. Chem.2006, 16, 3483.
35. Tang, X. C.; Pan, C. Y.; He, L. P.; Li, L. Q.; Chen, Z. Z.;
Electrochim. Acta 2004, 49, 3113.
36. Tang, X. C.; Song, X. W.; Shen, P. Z.; Jia, D. Z.; Electrochim.
Acta 2005, 50, 5581.
37. Araujo, R. B.; Scheicher, R. H.; de Almeida, J. S.; Ferreira da Silva, A.; Ahuja, R.; Solid State Commun.2013, 173, 9.
Submitted: January 7, 2016