www.scielo.br/aabc
Voltammetric characteristics of miconazole and its
cathodic stripping voltammetric determination
FRANCISCO C. PEREIRA, NELSON R. STRADIOTTO and MARIA VALNICE B. ZANONI
Instituto de Química, Universidade Estadual Paulista, Cx. Postal 355, 14801-970 Araraquara, SP, Brazil
Manuscript received on July 13, 2001; accepted for publication on February 26, 2002; presented byFernando Galembeck
ABSTRACT
Miconazole is reduced at mercury electrode above pH 6 involving organometallic compound formation, responsible for an anomalous polarographic behavior. The electrodic process presents a large contribution of the adsorption effects. The drug can be determined by cathodic stripping voltammetry from 8.0×10⁻⁸ to 1,5×10⁻⁶ mol L−1 in Britton-Robinson buffer pH 8.0, when pre-accumulated for 30 s at an accu-mulation potential of 0 V. A relative standard deviation of 3.8% was obtained for ten measurements of 1.0×10⁻⁷ mol L−1miconazole in B-R buffer pH 8.0 and a limit detection of 1,7×10⁻⁸ mol L−1was determined using 60 s of deposition time and scan rate of 100 mV s−1. The proposed method is simple, pre-cise and it was applied successfully for the determination of the miconazole in pure form and in commercial formulations, showing mean recoveries of 99.7–98.4%.
Key words:miconazole, voltammetry, electroanalysis, determination.
INTRODUCTION
Miconazole, 1-[2-(2,4-diclorofenil)-2-(2,4-dicloro-fenil)metoxietil-1H-imidazol, is an imidazole anti-fungal agent and antibacterial drug (Bennett 1996, Hoogeheide and Wycka 1982). The drug is ad-ministered locally or intravenously in cases of local or systemic mycotic infections. As a well estab-lished and useful drug it has generated significant analytical interest, several methods have been de-scribed for its determination in pharmaceutical for-mulations or biological fluids. The main methods employed are based on spectrophotometry (Cavrini et al. 1981, Goger and Gokcen 1999, Bonazzi et al. 1998, Kashaba et al. 2000, Erk and Altun 2001) and chromatography (Kobylinka et al. 1996, Indrayanto et al. 1999, Pietra et al.1996, Pietra et al. 1992,
Correspondence to: Maria Valnice Boldrin Zanoni E-mail: [email protected]
Cavrini et al. 1982). While all of these methods proved to be useful for certain studies, most of them are associated with specific procedures, requiring many steps and solvent extractions, lack of speci-ficity and low molar extinction coefficient.
the drug.
The present work describes the electrochemi-cal behavior of miconazole at mercury electrode in order to obtain an adsorptive stripping voltammetric method for determining the drug in aqueous solution and pharmaceutical formulations.
MATERIALS AND METHODS
Apparatus: Voltammetric experiments were per-formed with a Metrohm Polarecord E 506 linked to a compatible microcomputer, through a Microquim-ica interface. The multimode electrode Metrohm stand 663 VA was used in both the hanging mercury electrode (HMDE) and dropping mercury electrode (DME). The three electrode system was completed means of an Ag/AgCl (3 mol L−1 KCl) reference electrode and a glassy carbon auxiliary electrode.
Reagents: Suprapur grade reagents supplied by Merck and desmineralized water from a Milli-Q sys-tem (Milli-pore) were used in the preparation of all solutions. Britton-Robinson (B-R) buffer used as supporting electrolyte was prepared by mixing ap-propriate amounts of 0.2 mol L-1sodium hydroxide to orthophosphoric acid, acetic acid and boric acid (0.04 mol L-1in each) solution.
Procedure:Miconazole stock solution (1.0×10⁻² or 1.0×10⁻⁴mol L−1) were prepared from the dried and pure substance (kindly supplied by Bayer S.A.) by dissolution in methanol. An aliquot of the mi-conazole standard solution to be investigated was added by micropipette to 20 mL of deaerated B-R buffer at the appropriate pH. The differential pulse mode was used with a pulse amplitude of 50 mV, a drop time of 0.8 s, unless stated otherwise. The cathodic stripping voltammograms were obtained using a step of accumulation at –0.2 V for 30 s by stirring unless otherwise stated. Following 15 s af-ter stopping the stirring, a cathodic voltammogram was recorded, with a 100 mV s–1 scan rate in the linear scan mode.
aliquot of this formulation after evaporation of the organic solvent under a stream of nitrogen was di-luted with 10 mL of methanol. Aliquots of 20µL of this solution was transferred directly into the voltam-metric cell containing 20 mL of phosphate buffer pH 8.0 and the voltammetric curve recorded as above procedure. For tablets, commercial samples of Dak-tarin were prepared in a simple way. A weighed quantity of the powder equivalent to 10 mg of the studied drug was dissolved into 10 mL of methanol and aliquots of 20µL of this stock solution was di-rectly added to the voltammetric cell before electro-chemical measurements.
Analysis of dosage forms by spectrophotomet-ric method were carried out after complexation of miconazole with bromocresol green dye, following the procedure proposed in the literature by (Cavrini et al. 1981).
RESULTS AND DISCUSSION
Differential Pulse Polarography
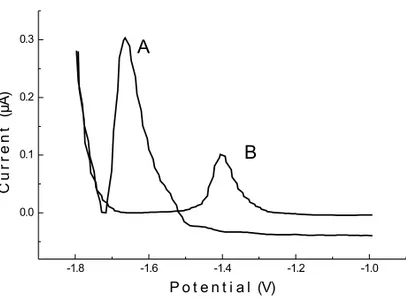
Miconazole contains electroreducible carbon-chlo-ride bonds that provide the basis for its voltam-metric determination. In hydroalcoholic solution; 0.04 mol L−1 Britton-Robinson buffer/methanol (1:1), miconazole is readily reduced in the pH range 8.0-12.0, as is shown in Fig. 1. The cathodic peak located at relatively high negative electrode poten-tial (pH = 8.0), Fig. 1, Curve B) shifts towards more negative values increasing the pH values up to−1.40 V at pH 12.0. The height of the peak de-creases continuously above pH 8, being only about one-third of its original height at pH 12.0. Analy-ses of the shapes of the differential-pulse peaks have shown peak half-width values of about 91 mV, sug-gesting a reduction process involving one electron transfer (Bond 1980).
-1.8 -1.6 -1.4 -1.2 -1.0 0.0
0.1 0.2 0.3
A
B
C
ur
r
ent
(µ
A
)
P o t e n t i a l (V)
Fig. 1 – Differential pulse polarograms obtained for 5.0×10⁻⁴mol L–1of
miconazole in pH 8.0 (Curve A) in pH 12.0 (Curve B).
that adsorption is involved in the electrode process (Zuman 1969). The above results were confirmed by means of the calibration curve obtained from 0.05 mM to 0.5 mM of miconazol. The relation-ship between ip versus concentration has shown a behavior unsuitable as analytical method. Although a linear relationship is obtained the curve does not cross the origin, following the equation: ip(µA)= –0.655 + 2465 C (C = concentration mol L–1); R= 0.992, n=7. The recorded differential pulse polaro-graphic are also distorted at higher concentrations than 2.0×10⁻⁴mol L–1, exhibiting anomalous base-line and non-symmetrical polarographic curves, in-dicating that strong adsorption are present in the electrodic process (Bond 1980).
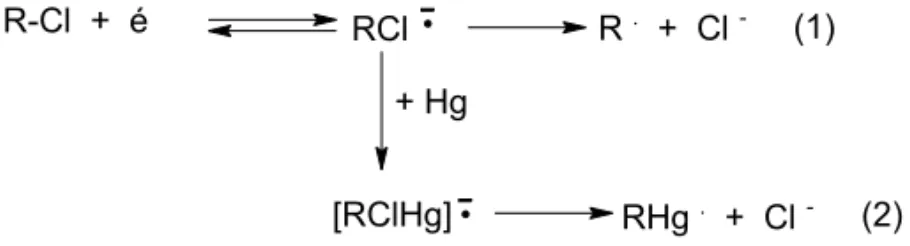
This behavior is confirmed by cyclic voltam-metric investigation. The reduction of 1.0×10⁻³ mol L–1of miconazole solution in B-R buffer pH 8.0 shows a cathodic peak at−1.7V and an anodic peak resulting from re-oxidation of the reduction product at reverse potential scan. The difference between the cathodic and the anodic peak potential is almost zero, indicating the occurrence of a reduction pro-cess complicated by strong adsorption of reagent and product (Laviron 1974). The influence of scan
rate(ν)on both peaks height was investigated from 10-500 mV s–1. On plotting ip vsν, a linear rela-tionship was observed for both cathodic and anodic peak, which is indicative of an adsorption-controlled process involving the reagent and product generated. Multi cyclic voltammograms repeated at the same mercury drop, do not show any alteration on the height of the cathodic or anodic peak. These results confirm that the generated product on electrode sur-face is strongly adsorbed on mercury as a stable film, (Laviron 1974).
pro-scans. However, it is possible to conclude that dif-ferential pulse polarography or cyclic voltammetry can not be selected for analytical purposes.
Cathodic Stripping Voltammetry
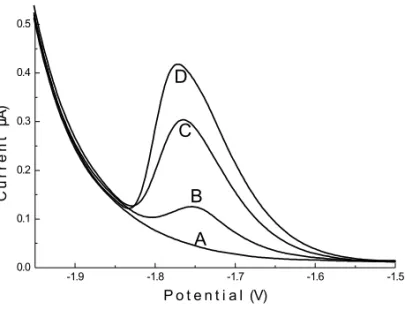
The possibility of determining miconazole by strip-ping voltammetry was considered since the adsorp-tion process detected in the electrochemical reduc-tion could be used as an effective preconcentrareduc-tion step prior to the voltammetric reduction of the drug. Linear voltammetric studies showed that mi-conazole is rapidly accumulated on an HMDE from a stirred solution, as shown the linear adsorptive stripping voltammograms obtained for 1.0×10⁻⁶ mol L–1 miconazole in B-R buffer pH 8.0 (Fig. 2). The height of the peak was shown to be directly pro-portional to the scan rate within the range 10−200 mV s–1, indicating that the reduction is that of an adsorbed species (Smyth and Vos 1992). On using a scan rate higher than 200 mV s–1 the peak shape was distorted, so a scan rate of 100 mV s–1was used for further work.
In order to investigate the effect of pH values on the peak height and peak potential, the stripping voltammetric response was studied for 1.0×10⁻⁶ mol L–1in B-R buffer between 7.0
−12. The peak potential is constant at pH<8.0 and shifts linearly towards less negative values at higher pH values. But, the peak height decreases linearly with pH in-creasing as is shown in Fig. 3. So, a value of pH 8.0 was chosen as giving the best results.
The influence of deposition potential on the peak current of 1×10⁻⁶mol L–1 miconazole was studied by changing potentials between 0 and −1.2 V. Taking into consideration that higher peak currents are obtained at an accumulation potential of 0 V, this value was chosen as best accumulation potential to pre-concentrate the drug.
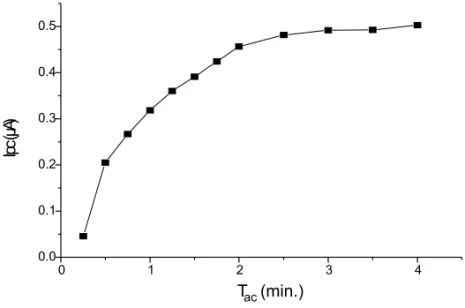
The peak current is plotted as a function of ac-cumulation time in Fig. 4. The peak current in-creases as the deposition time inin-creases up to 60 s,
(pure sample) was studied from 8.3×10 to 1.5×10⁻⁶mol L–1using accumulation times of 30 s and 100 s, and the respective curves are shown in Fig. 5. The response was linear in all the range studied for 30 s of accumulation time, but the curve is linear only up to 4.2×10⁻⁷mol L–1when accumulation time of 100 s was used. An accumulation time of 30 s are recommended as optimum conditions for the determination of the drug in concentration above 4.2×10⁻⁷mol L–1.
Repetitive measurements of 1.0×10⁻⁷mol L–1 miconazole in B-R buffer pH 8.0 using accumula-tion time and accumulaaccumula-tion potential of 30 s and 0 V respectively, permitted the evaluation of the preci-sion of the method. The experiment was repeated ten times, the relative standard deviation calculated for 1.0×10⁻⁷mol L–1 was found to be 3.8%. A detection limit of 1.7×10⁻⁸ mol L–1 was deter-mined using 60 s of deposition time and scan rate of 100 mV s–1. In order to check the accuracy of the developed method, we carried out a recovery study (n=3) for samples containing 4.2×10⁻⁷mol L–1, an average recovery of 99% with a relative standard deviation of 1.6% was obtained.
-1.9 -1.8 -1.7 -1.6 -1.5 0.0
0.1 0.2 0.3 0.4 0.5
D
C
B
A
C
u
rre
n
t
µ
A
)
P o t e n t i a l (V)
Fig. 2 – Cathodic Stripping voltammograms obtained for 1.0×10⁻⁶mol L–1of miconazole in B-R buffer pH 8.0. Accumulation potential (Eac) = 0 V, Scan rate = 100 mV s–1, using
accumulation time (tac) of: Curve A = 0 s, curve B = 15 s, curve C = 30 s and curve D = 60 s.
7 8 9 10 11
0.15 0.20 0.25 0.30 0.35 0.40
P
eak
C
ur
re
nt
(
µΑ
)
pH
Fig. 3 – Influence of the solution of pH variation on peak current intensity obtained from cathodic stripping voltammograms of 1.0×10⁻⁶mol L–1 mi-conazole. Eac= 0 V, tac= 60 s andν= 100 mV s–1.
in the literature, (Cavrini et al. 1981). The results obtained for the same commercial sample nomi-nally containing 1% of miconazole show a mean 100 and 99.0%, showing good agreement between both methods.
The proposed stripping voltammetric method proved to have an adequate precision and accuracy
0 1 2 3 4 0.0
0.1 0.2 0.3
Ip
c
(µ
A)
Tac(min.)
Fig. 4 – Influence of accumulation time on peak current intensity for 1×10⁻⁶ mol L–1of miconazole in B-R buffer pH 8.0. Eac= 0 V andν= 100 mV s–1.
0.0 0.2 0.4 0.6 0.8 1.0 1.2 1.4 1.6
0.00 0.05 0.10 0.15 0.20 0.25 0.30 0.35 0.40 0.45 0.50 0.55
C
u
rre
n
t
(µ
A
)
M i c o n a z o l e ( M ) x 1.0x10⁻⁶
Fig. 5 – Calibration curves obtained for miconazole in B-R buffer pH 8.0. Eac= 0 V, ν= 100mV s-1, using accumulation time of 30 s(
•)and 100 s().
ACKNOWLEDGMENTS
The authors thank the financial support from FAPESP, CAPES and CNPq.
RESUMO
Miconazol é reduzido no eletrodo de mercúrio em valor
de pH acima de 6,0 envolvendo formação de composto
organometálico, responsável por um comportamento
po-larográfico anômalo. O processo eletródico apresenta
uma larga contribuição de efeitos de adsorção. A droga
pode ser determinada por voltametria de redissolução
catódica de 8,0×10⁻⁸a 1,5×10⁻⁶mol L–1em tampão Britton-Robinson pH 8,0 quando pré-acumulada por 30 s
em potencial de acúmulo de 0 V. Um desvio padrão
R-Cl + é RCl (1)
+ Hg
[RClHg] (2)
R. + Cl
-RHg. + Cl
-Fig. 6 – Reduction scheme of clotrimazole on mercury electrode.
TABLE I
Analysis of miconazole in pharmaceutical formulations by voltammetric method.
Samples Label concentration Concentration found by Comparison
(mol L−1) the proposed method (%)±SD (mol L−1)
Daktarin 2.0×10⁻⁷ 2.0×10⁻⁷ 100±0.002 Daktarin 4.0×10⁻⁷ 4.0×10⁻⁷ 100±0.002 Daktarin 1.0×10⁻⁶ 9.9×10⁻⁷ 99.1±0.008 Vodol 6.0×10⁻⁷ 5.9×10⁻⁷ 98.6±0.004 Vodol 8.0×10⁻⁷ 7.9×10⁻⁷ 98.4±0.002 Vodol 1.0×10⁻⁶ 9.8×10⁻⁶ 98.1±0.001
TABLE II
Analysis of miconazole in pharmaceutical formulations by spectrophotometric method (Cavrini et al. 1981).
Samples Label concentration Concentration found by Comparison
(mol L−1) the official method (%)±SD (mol L−1)
Daktarin 1.3×10⁻⁵ 1.3
×10−5 100
±0.002
Vodol 1.3×10⁻⁵ 1.2×10⁻⁵ 99.0±0.003
L–1de miconazol em tampão B-R pH 8,0 e um limite de
detecção de 1,7×10⁻⁸mol L–1foi determinado usando 60 s de tempo de deposição e velocidade de varredura de
100 mV s–1. O método proposto é simples, preciso e foi aplicado com sucesso para a determinação de miconazol
na forma pura e em formulações comerciais, mostrando
médias de recuperação de 99,7−98,4%.
Palavras-chave: miconazol, voltametria, eletroanálise,
determinação.
REFERENCES
Baizer MM and Lund H.1985. Organic
electrochem-istry. Marcel Dekker, New York: 1985, 259-270 p.
Bennett JE.1996. Fármacos antimicrobianos.
Good-man & GilGood-man (Ed), As bases farmacológicas da te-rapêutica, 9aed., Rio de Janeiro: Guanabara,
864-875 p.
Bonazzi D, Cavrini V and Gatti R.1998.
su-Cavrini V, Di Pietra AM and Raggi MA.1981.
Colori-metric Determination of Miconazole-Nitrate in Phar-maceutical Preparations. Pharm Acta Helv 56: 163-165.
Cavrini V, Pietra AM and Raggi MA.1982.
High-pressure liquid chromatographic analysis of imida-zole antifungals in commercial dosage forms. Int J Pharm 10: 119-124.
Erk N and Altun ML.2001. Spectrophotometric
res-olution of metronidazole and imidazole nitrate in ovules using ratio spectra derivative spectrophotom-etry. J Pharmaceut Biomed Anal 15: 115-122.
Goger NG and Gokcen L.1999. Quantitative
deter-mination of miconazole in creams by second order derivative spectrophotometric. Anal Lett 32: 2595-2602.
Hoogeheide JJG and Wycka BE.1982. Analytical
pro-files of drugs substances, v. 2, New York: Academic Press, 225-255 p.
Indrayanto G, Widjaja S and Sutiono S.1999.
Si-multaneous determination of betamethasone valerate and miconazole nitrate in cream, and its validation. J Liquid Chromat 22: 143-152.
Anal 22: 363-376.
Kobylinka M, Kobylinka K and Sobik B.1996. High
Performance Liquid Chromatographic Analysis for the determination of miconazole in human plasma using solid-phase extraction. J Chromat B Biomed Sci Appli 685: 191-195.
Laviron E.1974. Adsorption, autoinhibition and
au-tocatalysis in polarographic and in linear potential sweep voltammetry. J Electroanal Chem 52: 35-39.
Pereira FC, Stradiotto NR and Zanoni MVB.2001.
Electrochemical Redution and Cathodic Stripping Voltammetric Determination of Clotrimazole. J Braz Chem Soc 12: 202-207.
Pietra AM, Andrisano V, Gatti R and Cavrini V.
1992. HPLC analysis of imidazole antimicotic drugs in pharmaceutical formulations. J Pharm Biomed Anal 10: 873-879.
Pietra AM, Andrisano V, Gatti R and Cavrini V.
1996. J Pharm Biomed Anal 14: 1191-1199.
Smyth MR and Vos JG.1992. Analytical voltammetry,
vol. XXVII, Amsterdam: Elsevier, 250 p.
Willems GJ, Jottier WI and Ranter CJ.1981.
Po-larographic investigation of Mn, Fe, Co, Ni and Zn with miconazole. Analysis 9: 327-332.
Zuman P.1969. Elucidation of organic electrode process.