Recent Results of Source Function Imaging from AGS through CERN SPS to RHIC
Roy A. Lacey
Dept of Chemistry, SUNY Stony Brook, Stony Brook, NY 11794, USA
Received on 19 January, 2007
Recent femtoscopic measurements involving the use of an imaging technique and a newly developed moment analysis are presented and discussed. We show that this new paradigm allows robust investigation of reaction dynamics for which the sound speedcs=0 during an extended hadronization period. Source functions extracted
for charged pions produced in Au+Au and Pb+Pb collisions show non-Gaussian tails for a broad selection of collision energies. The ratio of the RMS radii of these source functions in the out and side directions are found to be greater than 1, suggesting a finite emission time for pions.
Keywords: Correlation; Interferometry; Intensity interferometry; Cartesian harmonics
I. INTRODUCTION
Lattice calculations of the thermodynamical functions of quantum chromodynamics (QCD) indicate a rapid transition from a confined hadronic phase to a chirally symmetric de-confined quark gluon plasma (QGP), for a critical tempera-tureTc∼170 MeV [1]. The creation and study of this QGP is one of the most important goals of current ultra-relativistic heavy ion research [2]. Central to this endeavor, is the ques-tion of whether or not the QGP phase transiques-tion is first or-der (∆T =0), 2ndorder, or a rapid crossover reflecting an in-crease in the entropy density associated with the change from hadronic (dH) to quark and gluon (dQ) degrees of freedom. Currently, lattice calculations seem to favor a rapid crossover [3, 4] i.e.∆T=0 for the transition.
An emitting system which undergoes a sharp first order QGP phase transition is predicted to show a larger space-time extent, than that for a purely hadronic system [5, 6]. Here, the rationale is that the transition to the QGP “softens” the equa-tion of state (ie. the sound speedcs∼0) in the transition re-gion, and this delays the expansion and considerably prolongs the lifetime of the system. That is, matter-flow through this soft region of energy densities during the expansion phase, will temporarily slow down and could even stall under suit-able conditions.
To explore this prolonged lifetime, it has been common practice to measure the widths of emission source functions (assumed to be Gaussian) in the out- side- and long-direction (Rout,Rside andRlong) of the Bertsch-Pratt coordinate system [7–10]. For such extractions, the Coulomb effects on the cor-relation function are usually assumed to be separable [11] as well. The ratioRout/Rside>1, is expected for systems which undergo a strong first order QGP phase transition [5, 6]. This is clearly illustrated in Fig. 1, where the values obtained from a hydrodynamical model calculation [6] are plotted as a func-tion of energy density (in units ofTcsc;sis the entropy den-sity). These rather large ratios (especially those in Fig. 1a and c) have served as a major motivating factor for experimental searches of a prolonged lifetime at several accelerator facili-ties [7–10, 12–14].
An interesting aspect of Fig. 1 is the strong dependence of Rout/Rside on the width of the transition region (i.e. ∆T = 0). A comparison of Figs. 1a and b shows that this ratio is
1 10 100
ε0/Tcsc
0 1 2 3 4 5
R
out
/R
side
0 1 2 3 4 5 6
R
out
/R
side
1 10 100
ε0/Tcsc 0
2 4 6 8 10 12
Rout
/R
side
0.1 1 10
ε0/Tcsc 0
2 4 6 8 10
Rout
/R
side
T=0.7Tc
T=0.9Tc
T=Tc
∆T=0
∆T=0.1Tc
dQ/dH = 3
dQ/dH = 37/3
∆T=0
∆T=0.1Tc
Fig. 16
εH ε Q
εH
εQ
(a)
(b)
(c)
(d)
FIG. 1: Rout/Rsideas a function of the initial energy density (in units
ofTcsc) for an expanding fireball. (a,b) are fordQ/dH=37/3, (c,d)
fordQ/dH=3. The thick lines in (a,c) are for∆T =0, in (b,d) for
∆T=0.1Tc. Thin lines show results for an ideal gas case. Solid lines
show results forT=0.7Tc, dotted forT=0.9Tc, dashed forT=Tc.
The figure is taken from Ref. [6].
considerably reduced (by as much as a factor of four) when the calculations are performed for∆T =0.1Tc. Thus, the space-time extent of the emitting system is rather sensitive to the reaction dynamics and whether or not the transition is a cross over. It has also been suggested that the shape of the emission source function can provide signals for a second order phase transition and whether or not particle emission occurs near to the critical end point in the QCD phase diagram [15].
II. REACTION DYNAMICS AT RHIC
Experimental evidence for the creation of locally equili-brated nuclear matter at unprecedented energy densities at RHIC, is strong [16–23]. Jet suppression studies indicate that the constituents of this matter interact with unexpected strength and this matter is almost opaque to high energy par-tons [24, 25].
.05 .1
V
2/n
q
FIG. 2: (Color online)v2vs.pT(left panel) andKET(middle panel). The scaled results in the right panel is obtained vianqscaling of the data
shown in the middle panel. Results are shown for several particle species produced in minimum bias Au+Au collisions at√sNN=200 GeV
[26].
of perfect fluid hydrodynamics for the scaling of the elliptic flow coefficientv2with eccentricityε, system size and trans-verse kinetic energy KET [28–30]; they also indicate the pre-dictions of valence quark number (nq) scaling [31–33]. The result of such scaling is illustrated in Fig. 2c; it shows that, when plotted as a function of the transverse kinetic energy KET and scaled by the number of valence quarks nq of a hadron (nq=2 for mesons andnq=3 for baryons),v2shows a universal dependence for a broad range of particle species [26, 27, 34]. This has been interpreted as evidence that hydro-dynamic expansion of the QGP occurs during a phase char-acterized by (i) a rather low viscosity to entropy ratioη/s [20, 22, 23, 34] and (ii) independent quasi-particles which ex-hibit the quantum numbers of quarks [31–36].
The scaledv2 values shown in Fig. 2c allow an estimate of cs because the magnitude of v2/ε depends on the sound speed [30]. One such estimate [26, 27] givescs∼0.35±0.05; a value which suggests an effective equation of state (EOS) which is softer than that for the high temperature QGP [3]. It however, does not reflect a strong first order phase transition in whichcs∼0 during an extended hadronization period. This sound speed is also compatible with the fact thatv2(pT)is ob-served to saturate in Au+Au collisions for the collision energy range√sNN=60−200 GeV [37].
Femtoscopic measurements involving the use of the Bowler-Sinyukov 3D HBT analysis method [in Bertsch-Pratt coordinates], have been used to probe for long-range emis-sions from a possible long-lived source [7–10, 12–14]. The observed RMS-widths for each dimension of the emission sourceRlong,RsideandRout, show no evidence for such emis-sions. That is,Rout/Rside∼1.0. It is somewhat paradoxical that these observations have been interpreted as a femtoscopic puzzle [7] – “the HBT puzzle” – despite the fact that they clearly reflect a rich and complex set of thermodynamic tra-jectories for whichcs =0 (or∆T =0) during an extended hadronization period.
FIG. 3: (Color online)η/svs(T−Tc)/Tcfor several substances as
indicated. The calculated values for the meson-gas have an associ-ated error of∼50% [38]. The lattice QCD valueTc=170 MeV [4]
is assumed for nuclear matter. The lines are drawn to guide the eye.
a less pronounced minimum is found at a value slightly above Tc. The valueη/sis smallest in the vicinity ofTcbecause this corresponds to the most difficult condition for the transport of momentum [40].
Given these observations, one expects a broad range of tra-jectories in the(T,µB)plane for nuclear matter, to showη/s minima with a possible cusp at the critical point (µB is the baryon chemical potential). The exact location of this point is of course not known, and only coarse estimates of where it might lie are available. The open triangles in the figure show calculated values forη/salong theµB=0,nB=0 trajectory. ForT <Tctheη/svalues for the meson-gas show an increase for decreasing values ofT. ForT greater thanTc, the lattice results [41] indicate an increase of η/s withT, albeit with large error bars.
These trends suggest a minimum for η/s, in the vicinity ofTc, whose value is close to the conjectured absolute lower boundη/s=1/4π. Consequently, it is tempting to speculate that it is the minimum expected when the hot and dense QCD matter produced in RHIC collisions follow decay trajectories which are close to the QCD critical end point (CEP). Such trajectories could be readily followed if the CEP acts as an at-tractor for thermodynamic trajectories of the decaying matter [42, 43].
The above insights on the reaction dynamics of hot and dense QCD matter, strongly suggest that full utility of the fem-toscopic probe requires detailed measurements and theoretical investigations of both the shape and the space-time character of emission source functions. Here, it should be stressed that a good understanding of the space-time evolution of the QGP is crucial. This is because, in contrast to other signals, it is de-rived from the influence of the equation of state on the collec-tive dynamical evolution of the system. This is less clear-cut for many other proposed signals [44, 45].
III. SOURCE IMAGING: A FEMTOSCOPIC PARADIGM SHIFT
A. 1D source functions via imaging
An initial strategy has been to extract the “full” distribution of the 1D emission source function [46]. The 1D Koonin-Pratt equation [47]:
C(q)−1=4π
drr2K0(q,r)S(r), (1) relates this source functionS(r)(i.e. the probability of emit-ting a pair of particles at a separationrin the pair center of mass (PCMS) frame) to the 1D correlation functionC(q). The angle-averaged kernelK0(q,r)encodes the the final state in-teraction (FSI) which is given in terms of the final state wave functionΦq(r), asK0(q,r) = 12
d(cos(θq,r))(|Φq(r)|2−1),
whereθq,ris the angle betweenqandr[48].
The model-independent imaging technique of Brown and Danielewicz [48, 49] is used to invert Eq. 1 to obtainS(r). In brief, it utilizes a numerical calculation of the two particle wave function (including FSI) to produce an inversion matrix
q (MeV)
C(q)
Data
Restored C(q) Fit
3D HBT Au+Au (0<cen<20%)
0.20<kT<0.36 GeV/c
π
+π
+& π
-π
-Imaging source Spheroid Fit src
3D HBT source angle-averaged
r (fm)
S(r) (fm
-3 )
4
π
r
2 S(r) (fm -1 )
(a)
(b)
(c) 1 1.05 1.1 1.15 1.2
0 5 10 15 20 25 30 35 40 45 50
10-6
10-3
10-1
0 5 10 15 20 25 30 35 40
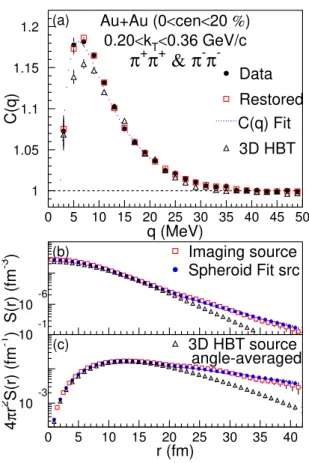
FIG. 4: (Color online) (upper, a) (filled circles) Correlation function, C(q) forπ+π+andπ−π−pairs; (open squares) restored correlation from imaging technique; (dotted line) direct correlation fitting; (open triangles) 1D angle-averaged correlation of 3D correlation function. (lower) 1D source function (b) S(r) and (c) 4πr2S(r): (open squares) imaging; (filled circles) spheroid fit to correlation function; (open tri-angles) angle-averaging of 3D-Gaussian source function. The figure is reproduced from Ref. [46].
that operates on the measured correlation function to give the associated source function. A detailed description of the pro-cedure for robust measurement of the correlation functions is given in these proceedings [50].
The open squares in Fig. 4(b) show the 1D source image ob-tained from the correlation function (filled circles) presented in Fig. 4(a). The open squares in Fig. 4(a) show the cor-responding restored correlation function obtained via Eq. 1 with the extracted source function as input. Their consistency serves as a good cross check of the imaging procedure.
the 3D Gaussian fitting procedure by construction is sensitive only to the main component ofS(r), and thus would not be capable of resolving fine structure at small-q/large-r.
The radial probabilities (4πr2S(r)) are also compared in Fig.4(c); they show that the differences are actually quite large. They are clearly related to the long-range contribution to the emission source function.
B. 1D source function via correlation function fitting
Another approach for 1D source function extraction is to perform direct fits to the correlation function. This involves the determination of a set of values for an assumed source function shape, which reproduce the observed correlation function when the resulting source function is inserted into Eq. 1. The filled circles in Figs. 4(b,c) show the source func-tion obtained from such a fit for a Spheroidal shape [48],
S(r) =λReff×e −4rR22
Terfi( r
2Reff)
8πR2TR0r
,forR0>RT, (2)
where Reff =1/
(1/R2
T−1/R20), RT is the radius of the Spheroid in two perpendicular spatial dimensions andR0=
a×RT is the radius in the third spatial dimension; a is a scale factor. The long axis of the Spheroid is assumed to be oriented in the out direction of the Bertsch-Pratt coordinate system. The fraction of pion pairs which contribute to the sourceλ, is given by the integral of the normalized source function over the full range ofr. The source function shown in Figs. 4(b) and 4(c), indicates remarkably good agreement with that obtained via the imaging technique, confirming a long-range contribution to the emission source function.
C. Origin of the long-range contributions to the 1D source function
Extraction of the detailed shape of the 1D source function is made ambiguous by the observation that several assumed shapes gave equally good fits which reproduced the observed correlation function. Nonetheless, one can ask whether or not a simple kinematic transformation from the longitudinal co-moving system (LCMS) to the PCMS can account for the ob-served tail? Here, the point is that instantaneous freeze-out of a source withRout/Rside∼1 in the LCMS would give a max-imum kinematic boost so thatRout∼γ×Rside in the PCMS (γis the Lorentz factor). Another possibility could be that the particle emission source is comprised of a central core and a halo of long-lived resonances. For such emissions, the pairing between particles from the core and secondary particles from the halo is expected to dominate the long-range emissions [51] and possibly give rise to a tail in the source function.
Both of these possibilities have been checked [46]; the in-dications are that the observations can not be explained solely by either one. However, further detailed 3D imaging measure-ments were deemed necessary to quantitatively pin down the
origin of the tail in the source function and to determine its possible relationship to the reaction dynamics.
IV. 3D SOURCE IMAGING
In order to develop a clearer picture of the reaction dynam-ics across beam energies, an ambitious [ongoing] program was developed to measure 3D source functions in heavy ion collisions from AGS through CERN SPS to RHIC energies. This program exploits the cartesian harmonic decomposition technique of Danielewicz and Pratt [52, 53] in conjunction with imaging and fitting, to extract the pair separation distri-butions in the out-, side- and long-directions. Model com-parisons to these distributions are expected to give invaluable insights on the reaction dynamics.
A. Cartesian harmonic decomposition of the 3D correlation function
Following Danielewicz and Pratt [52], the 3D correlation function can be expressed in terms of correlation moments as:
C(q)−1=R(q) =
∑
l α1
∑
...αlRlα
1...αl(q)A
l
α1...αl(Ωq), (3)
where l=0,1,2, . . ., αi=x,y,z, Alα1...αl(Ωq) are cartesian
harmonic basis elements (Ωq is solid angle inq space) and Rlα
1...αl(q)are cartesian correlation moments given by
Rlα
1...αl(q) =
(2l+1)!! l!
dΩ q 4π A
l
α1...αl(Ωq)R(q). (4)
In Eqs. 3 and 4, the coordinate axes are oriented so that z is parallel to the beam (i.e. the long direction), x is orthogo-nal to z and points along the total momentum of the pair in the LCMS frame (the out direction), and y points in the side direction orthogonal to both x and z.
The correlation moments, for each orderl, can be calcu-lated from the measured 3D correlation function with Eq. 4. Another approach is to truncate Eq. 3 so that it includes only non-vanishing moments and hence, can be expressed in terms of independent moments. For instance, up to orderl=4, there are 6 independent moments:R0,R2x2,R2y2,R4x4,R4y4andR4x2y2. Here, R2x2, R2y2, etc is used as a shorthand notation forR2xx, R2
yy, etc. The independent moments can then be extracted as a function ofqby fitting the truncated series to the experimental 3D correlation function with the moments as the parameters of the fit. Moments have been so obtained up to orderl=8, depending on available statistics. The higher order moments (l≥4) are generally found to be small or zero especially for the lower collision beam energies.
Figures 5 - 8 show representative comparisons between the 1D correlation functions,C(q), and thel=0 momentC(q)0≡
E895 Au+Au √s=3.8 AGeV
qinv (MeV/c)
C
0 (q)
π-π
l=0 moment
C0
C(qinv)
0<cen<20%
0.00<pT<0.20 GeV/c -0.35<yL-y0<0.35
0.9 0.95 1 1.05 1.1 1.15 1.2 1.25 1.3
0 10 20 30 40 50 60 70
FIG. 5: 1D correlation function C(q) (open stars) andl=0 moment C(q)0=R0(q) +1 (solid stars) for lowp
T mid-rapidityπ−π−pairs
from central Au+Au collisions at√s=3.8 GeV.
NA49 Pb+Pb √s=8.9GeV(±)
q (MeV/c) π-π
l=0 moment
1+R0(q)
1D C(q)
0<cen<7% 0.00<pT<0.20 GeV/c
-0.35<yL.-y0<0.35
0.9 0.95 1 1.05 1.1 1.15 1.2 1.25 1.3
0 10 20 30 40 50 60 70
FIG. 6: 1D correlation function C(q) (open stars) andl=0 moment C(q)0=R0(q) +1 (solid stars) for lowp
Tmid-rapidityπ−π−pairs
from central Pb+Pb collisions at√s=8.9 GeV.
y0is CM rapidity. For RHIC measurements|y|<0.35. The
pT and centrality selections are as indicated in each figure. Thel=0 moments are in good agreement with the 1D cor-relation functions; such agreement is expected in the absence of significant pathology, especially those related to the angu-lar acceptance. Therefore, they attest to the reliability of the
NA49 Pb+Pb √s=17.3GeV(±)
q (MeV/c) π-π
l=0 moment
1+R0(q)
1D C(q)
0<cen<7% 0.00<pT<0.20 GeV/c
-0.35<yL.-y0<0.35
0.9 0.95 1 1.05 1.1 1.15 1.2 1.25 1.3
0 10 20 30 40 50 60 70
FIG. 7: Same as Fig.6 but for√s=17.3 GeV. Result are averaged over runs with +ve and -ve magnetic fields.
PHENIX Preliminary
FIG. 8: (Color online) 1D correlation function C(q) (open stars) and l=0 momentC(q)0=R0(q)+1 (solid stars) for lowp
Tmid-rapidity
π−π−pairs from central Au+Au collisions at√s=200 GeV.
technique used for their extraction. Similarly good agreement was found for all other beam energies and analysis cuts.
Correlation moments for l=2 and l =4 are shown for
Au+Au collisions obtained at RHIC, in Fig. 9. Thel =2
moments show an anti-correlation for Cx22(q)≡R2x2(q) and
the emitting source is more extended in the out (x) direc-tion and less so in the side (y) and long (z) direcdirec-tions, when compared to the angle averageC0(q) (also see discussion on imaged moments). It is noteworthy that only two of thesel=2 correlation moments are actually independent, i.e. C2
x2(q) +Cy22(q) +Cz22(q) =0.
The bottom panel of Fig. 9 shows that rather sizable sig-nals are obtained forl=4. Here, it isCx2y24 correlation mo-ment which shows an anti-correlation. Momo-ments were also obtained forl=6. Since they were all found to be small, they do not have a significant influence on the shape of the source function.
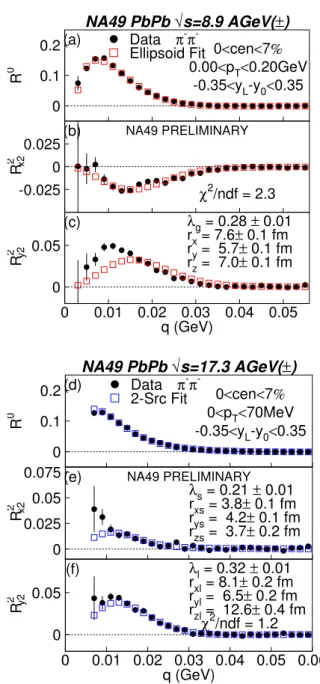
Figure 10 shows correlation moments for Pb+Pb collisions obtained at SPS energies. The top and bottom panels show results for√s=8.9 and 17.3 GeV respectively. In each case, the rapidity and centrality selections are the same, but thepT selections are different as indicated. The open squares in the figure represent the result of a simultaneous fit to the indepen-dent moments with assumed shapes for the source function as discussed below. Within errors, the magnitudes of the higher order moments were found to be insignificant.
TheR2x2(q)andR2y2(q)correlation moments in the top pan-els of Fig. 10 indicate an emission source which is more ex-tended in the out and long directions (compared toR0(q)). By contrast, theR2x2andR2y2(q)correlation moments in the bot-tom panels indicate positive correlations and hence an emis-sion source with big extenemis-sion (compared toR0(q)) in the long direction. In part, this difference is related to a different kine-matic factor for the twopT selections.
The correlation moments shown in Figs. 9 and 10 pro-vide the basis for quantitative extraction of the pair separa-tion distribusepara-tions in the out-, side- and long-direcsepara-tions. This is achieved either by fitting the moments or by imaging them.
B. Moment Fitting
As discussed earlier, the 3D correlation function can be rep-resented as a sum of independent cartesian moments. Thus, a straight forward procedure for source function extraction is to assume a shape and perform a simultaneous fit to all of the measured independent moments. The open squares in the top panel of Fig. 10 show the results of such a fit with an assump-tion of a 3D Gaussian source funcassump-tion (termed ellipsoid since there is no requirement that all three radii are the same). The fit parameters are indicated in panel (c). Overall, the moments are reasonably well represented by an ellipsoid for√s=8.9 GeV. However, a clear deviation is apparent forR2y2. A similar fit performed for the moments obtained for√s=17.3 GeV show even larger non Gaussian deviations.
The bottom panels of Fig. 10 show the results of a fit which assumes a linear combination of two Gaussians for the source function. The fit parameters are indicated in the figure. The two-source shape yields a much better representation of the data for√s=17.3 GeV. The parameters obtained from these and the earlier fits, can be used to generate source functions in the out-, side- and long-directions for comparison with mod-els.
PHENIX Preliminary
PHENIX Preliminary
FIG. 9: l=2 (top panels) andl=4 (bottom panels) correlation moments for mid-rapidity (low pT)π−π− pairs from 0-30%
cen-tral Au+Au collisions at√s=200 GeV. Note the change in notation; Clα1...αl(q)≡Rlα1...αl(q).
C. Moment Imaging
A complimentary approach for obtaining the source func-tion distribufunc-tions is that of imaging. In this case, both the
3D correlation function C(q) and source function S(r) are
ex-panded in a series of cartesian harmonic basis with correlation
momentsRlα
1...αl(q)and source moments S
l
respec-NA49 PbPb √s=8.9 AGeV(±)
q (GeV)
R
0
R
2 x2
R
2 y2
π-π
-0<cen<7% 0.00<pT<0.20GeV
-0.35<yL-y0<0.35 (a)
(b)
(c)
NA49 PRELIMINARY Data
Ellipsoid Fit
λg = 0.28 ± 0.01 rx = 7.6± 0.1 fm ry = 5.7± 0.1 fm rz = 7.0± 0.1 fm
χ2
/ndf = 2.3 0
0.1 0.2
-0.025 0 0.025
0 0.05
0 0.01 0.02 0.03 0.04 0.05
NA49 PbPb √s=17.3 AGeV(±)
q (GeV)
R
0
R
2 x2
R
2 y2
π-π
-0<cen<7% 0<pT<70MeV -0.35<yL-y0<0.35 (d)
(e)
(f)
NA49 PRELIMINARY Data
2-Src Fit
λs = 0.21 ± 0.01 rxs = 3.8± 0.1 fm rys = 4.2± 0.1 fm rzs = 3.7± 0.2 fm
λl = 0.32 ± 0.01 rxl = 8.1± 0.2 fm ryl = 6.5± 0.2 fm rzl = 12.6± 0.4 fm
χ2
/ndf = 1.2 0
0.1 0.2
0 0.025 0.05 0.075
0 0.05
0 0.01 0.02 0.03 0.04 0.05 0.06
FIG. 10: (Color online)l=2 correlation moments for mid-rapidity, lowpTπ−π−pairs from central Pb+Pb collisions for√s=8.9 GeV
(top panels) and√s=17.3 GeV. The open squares represent the re-sult of a simultaneous fit of the moments with an an assumed shape for the 3D source function (see text).
tively. Substitution into the 3D Koonin-Pratt equation
C(q)−1=
drK(q,r)S(r), (5)
gives [52];
Rlα1...αl(q) =4π
drr2Kl(q,r)Slα1...αl(q), (6)
which relates the correlation moments Rlα1...αl(q) to source
momentsSlα1...αl(q). Eq. 6 is similar to the 1D Koonin-Pratt
equation (cf. Eq. 1) but pertains to moments describing
dif-ferent ranks of angular anisotropyl.
The mathematical structure of Eq.6 is similar to that of
Eq. 1. Therefore, the same 1D Imaging technique
(de-scribe earlier) can be used to invert each correlation
mo-ment Rl
α1...αl(q)to extract the corresponding source moment
Sl
α1...αl(q). Subsequently, the total 3D source function is
cal-culated by combining the source moments for each l as in
equation (4)
S(r) =
∑
l α1
∑
...αlSlα1...α
l(r)A
l
α1...αl(Ωr). (7)
NA49π -π
Pb+Pb √s=±17.3GeV
r (fm) q (GeV)
S
0 (r) fm
-3
C
0 (q)
Data Restored 0<cen<7% 0.00<pT<0.20 GeV/c
-0.35<yL-y0<0.35 χ2/ndf = 1.2
0.95 1 1.05 1.1 1.15 1.2 1.25 1.3
0 0.01 0.02 0.03 0.04 0.05 0.06 0.07
10-8 10-7 10-6 10-5 10-4
0 10 20 30 40 50 60
FIG. 11: (Color online) l=0 momentC0(q) =R0(q) +1 (top panel) and imaged source momentS0(r) (bottom panel) for mid-rapidity lowpTπ−π−pairs from central Pb+Pb collisions (√s=17.3 GeV).
The open squares in the top panel represent the correlation moment restored from the imaged source momentS0(r).
Figure 11 shows the imagedl=0 moment S0 for the
in-put l=0 momentC0(q) =R0(q) +1 for mid-rapidity low pT
π−π− pairs from central Pb+Pb collisions (bottom panel).
This source image looks essentially exponential-like. Insert-ing the extracted image into the 1D Koonin-Pratt equation (Eq. 1) yields the restored moment shown as open squares in the top panel. The good agreement between the input and re-stored correlation moments serves as a consistency check of the imaging procedure.
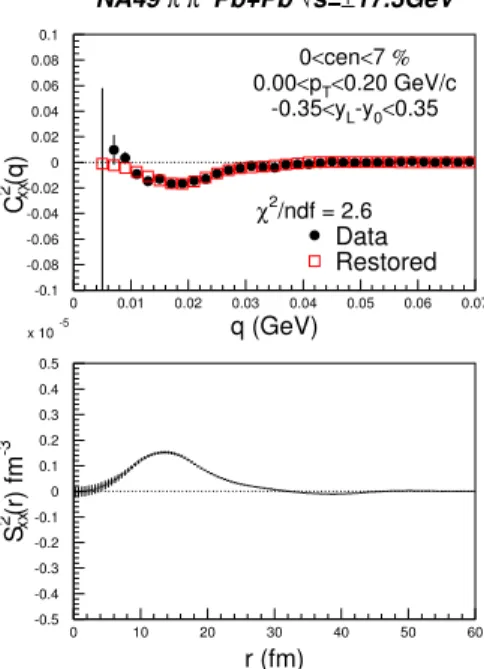
The sources images for thel=2 momentsR2xxandR2yyare
shown in Figs. 12 and 13. They show that the anti-correlation
exhibited byR2xxresults in a positivel=2 source moment
con-tributionS2xx. That is, the negative contribution ofR2xxplusR0
causes the overall correlation function to be narrower in thex
direction compared to the angle-average correlation function.
A narrower correlation function inx gives a broader source
NA49π-π
Pb+Pb √s=±17.3GeV
r (fm) q (GeV)
S
2 (r) fmxx
-3
C
2 (q)xx
Data Restored 0<cen<7% 0.00<pT<0.20 GeV/c
-0.35<yL-y0<0.35
χ2/ndf = 2.6
-0.1 -0.08 -0.06 -0.04 -0.02 0 0.02 0.04 0.06 0.08 0.1
0 0.01 0.02 0.03 0.04 0.05 0.06 0.07
-0.5 -0.4 -0.3 -0.2 -0.1 0 0.1 0.2 0.3 0.4 0.5 x 10⁻⁵
0 10 20 30 40 50 60
FIG. 12: (Color online) Same as Fig. 11 but for the l=2 moment C2xx(q) =R2xx(q). Open squares in top panel represent correlation
moment restored from imaged source momentS2xx(r).
Figure 13 shows an opposite effect for the image for the R2yy correlation moment. Here, the positive contribution of this correlation moment results in a negative contribution of thel=2 source momentS2yy. The positive contribution ofR2yy plusR0 causes the overall correlation function to be broader in theydirection compared to the angle-average correlation function. The resulting narrower source function (iny) reflects the negative contribution ofS2yytoS0.
As discussed earlier, the imaged moments are combined to give the resulting pair separation distributions in the out-, side-and long-directions.
D. Extracted source functions
As discussed in the previous section,
S(r) =
∑
l α1
∑
...αlSlα1...α
l(r)A l
α1...αl(Ωr).
Therefore, the net source functions in thex(out-), y(side-) and z(long-) directions are simply given by the sum of the 1D sourceS0and the corresponding higherlcontributionsS2ii where i= x, y, z. Figs. 14 - 16 show the source functions extracted for Pb+Pb and Au+Au collisions for the collision energies indicated. For the Pb+Pb collisions, source moments were found to be significant only for the multi-polaritiesl=0 andl=2 for 0<pT<70 MeV/c. For Au+Au (.2<pT< .36
GeV/c) significant source moments were also obtained forl= 4.
In Figs. 14 and 15 the results obtained from source imaging and fits to the correlation moments are shown. Clear indica-tions for non-Gaussian contribuindica-tions to these source funcindica-tions
NA49π
-π
Pb+Pb √s=±17.3GeV
r (fm) q (GeV)
S
2 (r) fmyy
-3
C
2 (q)yy
Data Restored 0<cen<7% 0.00<pT<0.20 GeV/c
-0.35<yL-y0<0.35 χ2/ndf = 2.3
-0.1 -0.075 -0.05 -0.025 0 0.025 0.05 0.075 0.1 0.125 0.15
0 0.01 0.02 0.03 0.04 0.05 0.06 0.07
-0.5 -0.4 -0.3 -0.2 -0.1 0 0.1 0.2 0.3 0.4 0.5 x 10⁻⁵
0 10 20 30 40 50 60
FIG. 13: (Color online) Same as Fig. 12 but for the l=2 moment Cyy2(q) =R2yy(q). Open squares in top panel represent correlation
moment restored from imaged source momentS2yy(r).
NA49 Pb+Pb √s=8.9AGeV(±)
r (fm)
S(r) (x 10
-7 fm -3 )
π
-π
-S0 + S x22
S0 + S y22
S0 + S z22
(a)
(b)
(c)
NA49 PRELIMINARY
Σ Image Mom.
Σ 2-Src Fit Mom.
Σ Gaussian Fit Mom.
0<cen<7%
0<pT<70 MeV/c
-0.35<yL-y0<0.35
1 10 102 103 1 10 102 1 10 102
0 5 10 15 20 25 30 35 40 45
FIG. 14: (Color online) Total source function in (a)x(out) (b)y (side) (c)z(long) direction for lowpTmid-rapidityπ−π−pairs from
central Pb+Pb collisions at√s=8.9 GeV. Source image and fits are indicated.
are apparent. A detailed analysis of these source functions is still ongoing. However, a number of observations can be drawn. First, the ratio of the RMS radii of the source functions in thexandydirections are 1.3±0.1 and and 1.2±0.1 respec-tively. This deviation from unity points to a finite pion emis-sion time. Here, it is important to emphasize that the rather low selection 0<pT <70 MeV/c, ensures that the Lorentz
direc-NA49 Pb+Pb √s=17.3AGeV(±)
r (fm)
S(r) (x 10
-7 fm -3 )
π-π
-S0 + S x22
S0 + S y22
S0 + S z22
(d)
(e)
(f)
NA49 PRELIMINARY
Σ Image Mom.
Σ 2-Src Fit Mom.
Σ Gaussian Fit Mom.
0<cen<7%
0<pT<70 MeV/c
-0.35<yL-y0<0.35
1 10
102
103
1 10
102
1 10
102
0 5 10 15 20 25 30 35 40 45
FIG. 15: (Color online) Same as Fig.14 but for√s=17.3 GeV.
Run4 Emc+ToF Au+Au √s=200AGeV
r (fm)
S(r) (x 10
-5 fm -3 )
π+π+& π-π
-S0 + S xx2 + S x44
S0 + S yy2 + S y44
S0 + S zz2 + S z44
Σ Imaged Moments
Therminator Src Function 10-2
10-1 1
10-2 10-1 1
10-2 10-1 1
0 10 20 30 40 50 60
FIG. 16: (Color online) Source images for thex(out) (a)y(side) (b) andz(long) (c) directions for.2<pT< .35 GeV/c mid-rapidity
π−π−pairs from central Au+Au collisions at√s=200 GeV. Model calculations from the Therminator code are also indicated.
tion due to kinematic transformation from the LCMS to the PCMS is negligible.
Another important observation is that the RMS pair separa-tion in thezdirection (cf. Figs. 14(c) and 15(f)) are 11 fm and 12 fm respectively. These dimensions are much larger than the Lorentz-contracted nuclear diameters of 3 fm at√s=8.9 GeV and 1.5 fm at√s=17.3 GeV. In fact, they can be taken as the RMS pair separation resulting from the longitudinal spread of nuclear matter created by the passage of the two nu-clei. Since the latter are moving with almost the speed of light, one can infer a lower bound “break-up” time for the created nuclear matter. This is estimated to be∼8 fm/c at√s=8.9 GeV and∼10 fm/c at√s=17.3 GeV.
Figure 16 show representative source images extracted for Au+Au collisions at√s=200 GeV. For comparison, source functions obtained from initial calculations performed with the Therminator simulation code [54] are also plotted. The filled and open circles show the results from calculationswith andwithoutresonance emissions turned on. Fig. 16b shows that the calculations which include resonance emissions can account for an apparent tail in the distribution for they(side) direction. However, Fig. 16a suggests that such resonance contributions are not sufficient to account for an apparent ex-tension in thex(out) direction. An extensive effort to map out the source functions for different models and model parame-ters is currently underway. It is expected that a comparison between the results of such calculations and data will provide tighter constraints for the space-time evolution for collision systems spanning the AGS - SPS - RHIC bombarding energy range.
V. CONCLUSIONS
In summary, we have presented and discussed several tech-niques for femtoscopic measurements spanning collision en-ergies from the AGS to RHIC. These methods of analysis pro-vide a robust technique for detailed investigations of the re-action dynamics. Initial results from an ambitious program to measure a “full” femtoscopic excitation function, indicate that the emission source functions are decidedly non-Gaussian for a broad range of collision energies, and particle emission times can be reliably measured.
[1] F. Karsch et al., Phys. Lett. B478, 447 (2000). [2] QM2005, Nucl. Phys. A774, 1c (2006). [3] F. Karsch (2006), hep-lat/0601013.
[4] F. Karsch, E. Laermann, and A. Peikert, Nucl. Phys. B605, 579 (2001), hep-lat/0012023.
[5] S. Pratt, Phys. Rev. Lett.53, 1219 (1984).
[6] D. H. Rischke et al., Nucl. Phys. A608, 479 (1996). [7] M. A. Lisa et al., Annu. Rev. Nucl. Part. Sci.55, 357 (2005). [8] C. Adler et al., Phys. Rev. Lett.87, 082301 (2001).
[9] K. Adcox et al., Phys. Rev. Lett.88, 192302 (2002). [10] J. Adams et al., Phys. Rev. Lett.91, 262301 (2003). [11] Y. Sinyukov et al., Phys. Lett. B432, 248 (1998). [12] R. Ganz et al. (The NA49) (1998), nucl-ex/9808006. [13] I. G. Bearden et al. (NA44) (2003), nucl-ex/0305014. [14] S. S. Adler et al., Phys. Rev. Lett.93, 152302 (2004).
[15] T. Csorgo, S. Hegyi, T. Novak, and W. A. Zajc (2005), nucl-th/0512060.
nucl-ex/0410003.
[17] J. Adams et al., Nucl. Phys. A 757, 102 (2005), nucl-ex/0501009.
[18] B. B. Back et al., Nucl. Phys. A 757, 28 (2005), nucl-ex/0410022.
[19] I. Arsene et al., Nucl. Phys. A757, 1 (2005), nucl-ex/0410020. [20] M. Gyulassy et al., Nucl. Phys. A 750, 30 (2005),
nucl-th/0405013.
[21] B. M¨uller (2004), nucl-th/0404015.
[22] E. V. Shuryak, Nucl. Phys. A750, 64 (2005), hep-ph/0405066. [23] U. Heinz et al., Nucl. Phys. A702, 269 (2002).
[24] C. Adler et al. (STAR), Phys. Rev. Lett.90, 082302 (2003), nucl-ex/0210033.
[25] S. S. Adler et al. (PHENIX), Phys. Rev. Lett. 97, 052321 (2006), nucl-ex/0507004.
[26] A. Adare (PHENIX) (2006), nucl-ex/0608033.
[27] M. Issah and A. Taranenko (PHENIX) (2006), nucl-ex/0604011.
[28] M. Csan´ad et al. (2005), nucl-th/0512078. [29] M. Csanad et al. (2006), nucl-th/0605044. [30] R. S. Bhalerao et al., Phys. Lett. B627, 49 (2005). [31] S. A. Voloshin, Nucl. Phys. A715, 379 (2003). [32] R. J. Fries et al., Phys. Rev. C68, 044902 (2003). [33] V. Greco et al., Phys. Rev. C68, 034904 (2003). [34] R. A. Lacey and A. Taranenko (2006), nucl-ex/0610029. [35] N. Xu, Nucl. Phys. A751, 109 (2005).
[36] B. Muller and J. L. Nagle (2006), nucl-th/0602029. [37] S. S. Adler et al., Phys. Rev. Lett.94, 232302 (2005).
[38] J.-W. Chen and E. Nakano (2006), hep-ph/0604138.
[39] P. Kovtun, D. T. Son, and A. O. Starinets, Phys. Rev. Lett.94, 111601 (2005), hep-th/0405231.
[40] L. P. Csernai, J. I. Kapusta, and L. D. McLerran, Phys. Rev. Lett.97, 152303 (2006), nucl-th/0604032.
[41] A. Nakamura and S. Sakai, Phys. Rev. Lett.94, 072305 (2005), hep-lat/0406009.
[42] C. Nonaka and M. Asakawa, Phys. Rev. C71, 044904 (2005), nucl-th/0410078.
[43] B. Kampfer, M. Bluhm, R. Schulze, D. Seipt, and U. Heinz (2005), hep-ph/0509146.
[44] J. I. Kapusta, P. Lichard, and D. Seibert, Phys. Rev. D44, 2774 (1991).
[45] C. Gerschel and J. Hufner, Nucl. Phys. A544, 513c (1992). [46] S. S. Adler et al. (PHENIX) (2006), nucl-ex/0605032. [47] S. E. Koonin, Phys. Lett. B70, 43 (1977).
[48] D. A. Brown et al., Phys. Rev. C64, 014902 (2001). [49] D. A. Brown et al., Phys. Lett. B398, 252 (1997). [50] P. Chung et al., These proceedings (2006). [51] S. Nickerson et al., Phys. Rev. C57, 3251 (1998).
[52] P. Danielewicz and S. Pratt, Phys. Lett. B618, 60 (2005), nucl-th/0501003.
[53] P. Chung, W. Holzmann, R. Lacey, J. Alexander, and P. Danielewicz, AIP Conf. Proc.828, 499 (2006).