Elayne Marques Silva
Probabilistic Assessment of Serviceability of
Silva, Elayne Marques.
S586p Probabilistic assessment of serviceability of FRP-reinforced concrete beams [manuscrito] / Elayne Marques Silva. - 2017.
xvi, 105 f., enc.: il.
Orientadora: Sofia Maria Carrato Diniz. Coorientadora: Sidnea Eliane Campos Ribeiro
Dissertação (mestrado) Universidade Federal de Minas Gerais, Escola de Engenharia.
Apêndices: 86-105.
Bibliografia: f. 82-85.
1. Engenharia de estruturas - Teses. 2. Confiabilidade (Engenharia)- Teses. 3. Momentos de inércia - Teses. 4. Método de Monte Carlo – Teses. 5. Plástico reforçado por fibras - Teses. I. Diniz, Sofia Maria Carrato. II. Ribeiro, Sidnea Eliane Campos. III. Universidade Federal de Minas Gerais. Escola de Engenharia. IV. Título.
FEDERAL UNIVERSITY OF MINAS GERAIS STRUCTURAL ENGINEERING DEPARTMENT
“PROBABILISTIC ASSESSMENT OF SERVICEABILITY OF FRP-REINFORCED
CONCRETE BEAMS”
Elayne Marques Silva
Dissertation presented to the Graduate Program in Structural Engineering of the Structural Engineering Department of the Federal University of Minas Gerais, being part of the requirements for the “Master in Structural Engineering” degree.
Examination committee:
_____________________________________________ Prof. Sofia Maria Carrato Diniz – (Advisor)
DEEs – Structural Engineering Department – UFMG
_____________________________________________ Prof. Sidnea Eliane Campos Ribeiro – (Co-advisor)
DEMC – Department of Materials and Construction - UFMG
_____________________________________________ Prof. José Márcio Fonseca Calixto
DEEs – Structural Engineering Department – UFMG
_____________________________________________ Prof. Sebastião Salvador Real Pereira
DEEs – Structural Engineering Department – UFMG
1.
ACKNOWLEDGEMENTS
I would like to thank God for giving me the strength and knowledge to carry out this research. I would like to thank my advisor Prof. Sofia Maria Carrato Diniz for believing in me and for her guidance in this research. I am so grateful to Sofia for sharing her vast and invaluable research experience and directing me in all stages of this work. My deep gratitude to my co- advisor, Prof. Sidnea Eliane Campos Ribeiro, for her interest in my work.
2.
ABSTRACT
Reinforced concrete (RC) structures are often subjected to deicing salts or in a marine environment; as such, a major problem in the durability of these structures is the corrosion of reinforcing steel. In this light, Fiber Reinforced Polymers (FRP), as noncorrosive materials, provide a promising prospect for use as reinforcement in concrete construction. FRP reinforcement may offer not only greater durability but also higher resistance and, consequently, potential gains throughout the lifecycle of the structure. Although the use of FRP bars as structural reinforcement shows great promise in terms of durability, the characteristics of this material led to new challenges in the design of FRP-RC components. Due to differences between the mechanical properties of steel and FRP, the reliability of FRP-reinforced concrete (RC) beams shall be assessed. While a reasonable body of knowledge has been gathered regarding the reliability of FRP-RC beams with respect to ultimate limit states, the same is not true for serviceability of such beams. Since FRP is characterized by higher
values of strength and lower Young’s modulus compared to steel, this implies that the design of FRP-RC structures will be influenced almost exclusively by serviceability limit states. In this study, a contribution to the development of semiprobabilistic design recommendations for FRP-RC beams, with respect to the serviceability limit state, is reported. Numerous equations have been proposed for computing the effective moment of inertia of FRP-RC members. This research also aims to select an equation for the calculation of the effective moment of inertia for FRP-RC beams assessed in this study. Since most of the variables involved in the problem (mechanical properties of concrete and FRP, geometric characteristics, model error, loads, etc.) are random, serviceability is established in probabilistic terms. In this context, Monte Carlo simulation is used in the probabilistic description of beam deflections, and in the computation of the probability of failure of designed beams with respect to the limit state of excessive deflections. Large probabilities of failure are found for this serviceability limit state according to current design recommendations. Suggestions are presented on simple, but effective ways to circumvent this limitation.
3.
TABLE OF CONTENTS
ACKNOWLEDGEMENTS ... i
ABSTRACT ... ii
TABLE OF CONTENTS ... iii
LIST OF FIGURES ... vii
LIST OF TABLES ... ix
ACRONYMS ... xi
NOTATION ... xii
1. INTRODUCTION ... 1
1.1 STATEMENT OF THE PROBLEM ... 1
1.2 OBJECTIVES ... 3
1.3 ORGANIZATION ... 4
2. MECHANICAL PROPERTIES OF MATERIALS ... 6
2.1 CONCRETE ... 6
2.2 FIBER-REINFORCED POLYMERS (FRP) ... 8
2.2.1 Tensile behavior of FRP bars ... 8
2.2.2 Compressive behavior of FRP bars ... 10
2.2.3 Shear behavior of FRP bars ... 10
2.2.4 Density ... 10
2.2.5 Creep rupture of FRP bars ... 11
3. DESIGN CONSIDERATIONS FOR FRP-REINFORCED CONCRETE BEAMS ... 12
3.1 GENERAL DESIGN CONSIDERATIONS ... 12
3.2 ACI-440 recommendations for flexural design ... 13
3.2.1 Strength reduction factors ... 16
3.2.2 Minimum FRP reinforcement ... 17
3.2.3 Design material properties ... 18
3.2.4 Serviceability ... 19
3.2.4.1 Calculation of deflection (direct method) ... 20
3.2.4.1.1 Immediate deflection ... 20
3.2.4.1.2 Long-term deflection ... 23
3.3 SUMMARY OF THE CHAPTER ... 24
4. DEFLECTIONS OF FRP-RC BEAMS ... 26
4.1 GENERAL CONSIDERATIONS ... 26
4.2 EQUATIONS FOR THE EFFECTIVE MOMENT OF INERTIA ... 27
4.2.1 Benmokrane et al. (1996) ... 27
4.2.2 Brown and Bartholomew (1996) ... 27
4.2.3 Toutanji and Saafi (2000) ... 27
4.2.4 Rizkalla and Mufti (2001) ... 28
4.2.5 Yost et al. (2003) ... 28
4.2.6 Bischoff and Scanlon (2007) ... 29
4.2.7 Bischoff and Gross (2011) ... 29
4.3 SUMMARY OF THE CHAPTER ... 30
5. RELIABILITY BASICS ... 32
5.2 METHODS OF RELIABILITY ANALYSIS ... 33
5.2.1 Basic problem ... 33
5.2.2 Margin of safety ... 34
5.3 PERFORMANCE FUNCTION ... 36
5.4 MONTE CARLO SIMULATION ... 37
5.5 SAMPLING ERROR ... 38
5.6 SUMMARY OF THE CHAPTER ... 39
6. RELIABILITY ANALYSIS OF SERVICEABILITY OF FRP-RC BEAMS ... 40
6.1 DESIGNED BEAMS ... 41
6.2 DETERMINISTIC RELATIONSHIP FOR PERFORMANCE VERIFICATION OF GFRP-RC BEAMS ... 42
6.2.1 Allowable deflection... 43
6.2.2 Total deflection ... 44
6.2.2.1 Immediate deflection of FRP-RC beams ... 44
6.2.2.2 Long-term deflection of FRP-RC beams ... 45
6.3 STATISTICS OF THE BASIC VARIABLES ... 48
6.3.1 Compressive strength, modulus of elasticity of concrete, and cracking moment .. ... 48
6.3.2 Mechanical properties of FRP bars ... 50
6.3.3 Cross section geometry ... 51
6.3.4 Model error ... 51
6.3.5 Loading ... 51
6.4 STATISTICS OF THE BASIC VARIABLES: SUMMARY ... 52
6.6 PROBABILISTIC SIMULATION OF DEFLECTIONS OF FRP-RC BEAMS ... 57
6.7 PERFORMANCE FUNCTION ... 66
6.8 PROBABILITY OF FAILURE AND RELIABILITY INDEX ... 70
6.9 SUMMARY OF THE CHAPTER ... 75
7. SUMMARY, CONCLUSIONS AND SUGGESTIONS FOR FURTHER RESEARCH 76 7.1 SUMMARY ... 76
7.2 CONCLUSIONS ... 78
7.3 SUGGESTIONS FOR FURTHER RESEARCH ... 80
REFERENCES ... 82
APPENDIX 1 – FRPSERV PROGRAM ... 86
APPENDIX 2 – WORKED EXAMPLE: RELIABILITY ASSESSMENT OF C30-P2-R2-UR BEAM ... 95
LIST OF FIGURES
Figure 1.1 - Examples of FRP reinforcing bars. ... 2
Figure 2.1 - Stress-strain diagram to different strengths of concrete. ... 7
Figure 2.2 - Stress-strain curves of typical reinforcing bars... 9
Figure 4.1 - Equivalent moment of inertia values for calculating deflection. ... 30
Figure 5.1 - Probability density functions fX (x) and fY (y). ... 33
Figure 5.2 - Probability density function of safety margin M. ... 35
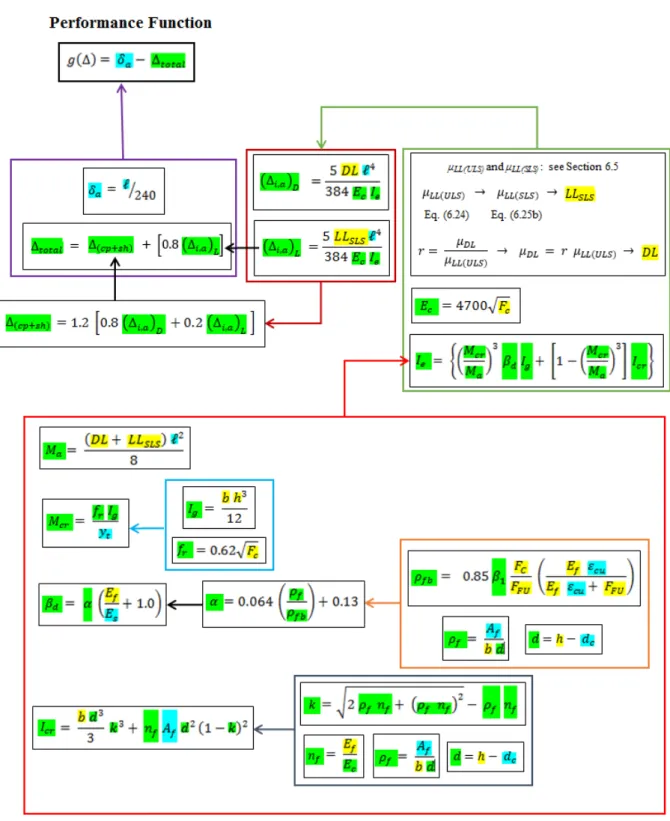
Figure 6.1 - Flowchart of the deterministic procedure for computation of beam total deflection. ... 47
Figure 6.2 - Flowchart of Monte Carlo simulation procedure. ... 58
Figure 6.3 - Histogram of deflections: C30-P1-R5-UR beam. ... 63
Figure 6.4 - Histogram of deflections: C30-P3-R5-UR beam. ... 63
Figure 6.5 Histogram of deflections: C50-P1-R1-OR beam. ... 64
Figure 6.6 - Histogram of deflections: C50-P3-R1-TR beam. ... 64
Figure 6.7 - Histogram of deflections: C70-P2-R2-UR beam. ... 65
Figure 6.8 - Histogram of deflections: C70-P2-R2-OR beam. ... 65
Figure 6.9 - Histogram of the margin of safety: C30-P1-R2-OR beam. ... 66
Figure 6.10 - Histogram of the margin of safety: C30-P3-R2-UR beam. ... 67
Figure 6.11 - Histogram of the margin of safety: C50-P2-R5-OR beam. ... 67
5.
LIST OF TABLES
Table 2.1 - Usual tensile properties of reinforcing bars. ... 9
Table 2.2 - Tensile strength of FRP bars ... 10
Table 2.3 - Typical densities of reinforcing bars. ... 11
Table 3.1 - Environmental reduction factor for various fibers and exposure conditions ... 18
Table 3.2 - Time-dependent factor for sustained loads. ... 24
Table 6.1 - Details of the designed beams. ... 42
Table 6.2 - Maximum permissible calculated deflections. ... 43
Table 6.3 - Statistics of the model error (mean and COV) associated to predicted immediate deflections at service of GFRP-RC beams according to different proposals. ... 45
Table 6.4 - Statistics of loads... 52
Table 6.5 - Statistics of the basic variables. ... 52
Table 6.6 - Design moment, Md, mean dead load, μDL, mean live load at ultimate state,μLL(ULS), and at service, μLL(SLS), of GFRP-RC beams. ... 56
Table 6.7- Statistics of the total deflection of GFRP-RC beams (r = 0.5). ... 60
Table 6.8 - Statistics of the total deflection of GFRP-RC beams (r = 1.0). ... 61
Table 6.9 - Statistics of the total deflection of GFRP-RC beams (r = 2.0). ... 62
6.
ACRONYMS
ACI – American Concrete Institute; AFRP – aramid FRP;
COV – coefficient of variation; CFRP- carbon FRP;
FRP – Fiber-Reinforced Polymers; FRP-RC – FRP-reinforced concrete; GFRP – glass FRP;
7.
NOTATION
a - depth of equivalent rectangular stress block; Af - total area of FRP reinforcement;
Af,min- minimum area of FRP reinforcement;
A’s - area of compression reinforcement;
b - width of rectangular cross section; c - depth of the neutral axis;
CE - environmental reduction factor for various fiber types and exposure conditions;
d - distance from extreme compression fiber to centroid of tension reinforcement;
dc - thickness of concrete cover measured from extreme tension fiber to center of bar or wire location closest thereto;
dFRP - diameter of FRP bar;
ds - thickness of stirrups;
DL - random variable “dead load”; Ec - modulus of elasticity of concrete;
Ef - design modulus of elasticity of FRP;
EFRP - random variable “modulus of elasticity of FRP”;
Ef,ave - average modulus of elasticity of FRP;
fc - concrete compressive strength in situ;
f’c - specified compressive strength of concrete;
ff - stress in FRP reinforcement in tension;
ffu - design tensile strength of FRP, considering reductions for service environment;
ffu, ave - mean tensile strength of FRP bar;
f*fu - guaranteed tensile strength of FRP bar;
FC - random variable “compressive strength of concrete”;
FFU - random variable “tensile strength of FRP bar”;
fr - modulus of rupture of concrete;
h - depth of rectangular cross section; Icr - cracked moment of inertia;
Ie - effective moment of inertia;
Ig - gross moment of inertia;
IT - moment of inertia of uncracked section transformed to concrete;
I’e - equivalent moment of inertia;
k - ratio of depth of neutral axis to reinforcement depth;
- span of beam;
L1 - first layer of reinforcement; L2 - second layer of reinforcement;
LLSLS- random variable “live load” (serviceability analysis);
Mcr - cracking moment;
Md - design moment;
MDn - design moment due to dead load;
MLn - design moment due to live load;
Mn - nominal moment capacity;
Mu - factored moment at section;
nf - ratio of the modulus of elasticity of FRP bars to the modulus of elasticity of concrete; number of failures;
ns - sample size (number of simulations);
pserv - service load;
PF - probability of failure;
Ps - probability of nonfailure;
r - ratio mean dead load to mean live load; Rd - design strength;
s - standard deviation; Sd - design strength;
Un – unfactored nominal load;
V - coefficient of variation;
Greek letters
α1 - ratio of average concrete stress to concrete strength;
α - bond dependent coefficient;
αc - reduction factor of concrete compressive strength;
δa- allowable deflection;
β1 - ratio of the depth of the equivalent rectangular stress block to the depth of the neutral axis;
β - reliability index;
βd - reduction coefficient used in calculating effective moment of inertia;
γ - correction factor used in calculating equivalent moment of inertia;
γD - amplification factor of dead load;
γL - amplification factor of live load;
Δ(cp + sh) - additional deflection due to creep and shrinkage under sustained loads;
Δb- random variable “beam width”;
Δc - random variable “concrete cover”;
Δh - random variable “beam depth”;
Δi,a - adjusted immediate deflection;
Δ(i,a)D- adjusted immediate deflection due to dead loads;
Δ(i,a)L- immediate deflection due to live loads;
Δi(sus) - immediate deflection due to sustained loads;
εc - concrete compressive strain at failure;
εcu - ultimate strain in concrete;
εfu - design rupture strain of FRP reinforcement;
ε*fu - guaranteed rupture strain of FRP reinforcement;
ηs - stiffness reduction coefficient;
η - model error;
λ - multiplier for additional long-term deflection;
λr- modification factor used in calculating modulus of rupture of concrete;
µ - mean;
μc- average compressive strength of concrete;
µDL - mean dead load;
µLL(SLS) - mean of live loads in the serviceability limit state;
µLL(ULS) - mean of live loads in the ultimate limit state;
μυ- mean nominal load;
ξ - time-dependent factor for sustained loads;
ρf - FRP reinforcement ratio;
ρfb - FRP reinforcement balanced ratio;
ρ’ - ratio of steel compression reinforcement;
1
1.
INTRODUCTION
1.1
STATEMENT OF THE PROBLEM
Reinforced concrete (RC) structures are often subjected to deicing salts or in a marine environment; as such, a major problem in the durability of these structures is the corrosion of reinforcing steel. In this light, Fiber Reinforced Polymers (FRP), as noncorrosive materials, provide a promising prospect for use as reinforcement in concrete construction.
The use of FRP as internal reinforcement arose from the need to mitigate the corrosion of reinforcing steel. The expansion of the highway systems in the 1950s in United States and the need to provide year-round maintenance, made it common to apply deicing salts on highway bridges during the winter. As a result, reinforcing steel in these structures experienced extensive corrosion, and this problem became a source of concern (ACI 440, 2006). Due to growing interest on high performance materials in recent years, FRP bars have emerged as an alternative to tackling the problem of corrosion.
Figure 1.1 - Examples of FRP reinforcing bars (ACI 440, 2015).
FRP reinforcement may offer not only greater durability but also higher resistance and, consequently, potential gains throughout the life-cycle of the structure. Moreover, the specific advantages of this material may be combined in innovative systems, such as FRP reinforced concrete (FRP-RC) beams and slabs.
Although the use of FRP bars as structural reinforcement shows great promise in terms of durability, the characteristics of this material led to new challenges in the design of FRP-RC components. Design of RC beams usually results in under-reinforced beams, where the failure mode is governed by the yielding of steel, while in the design of FRP-RC beams the concrete crushing is the most desirable failure mode (Nanni, 1993). Design recommendations of steel reinforced members are commonly based on limit state design principles, i.e. the member is designed based on its required strength and then checked for serviceability criteria. But in many instances, serviceability criteria may control the flexural design of FRP-RC members (ACI 440, 2006).
Deflections of RC beams have traditionally been computed using an elastic deflection equation that includes an effective moment of inertia (Ie), originally introduced by Branson (1965) for steel reinforced concrete (Bischoff and Gross, 2011b). However, it has been
Numerous equations have been proposed by many investigators for computing the effective moment of inertia of FRP-RC members.
Due to differences between the mechanical properties of steel and FRP, the reliability of the FRP-RC beams shall be analyzed. While a reasonable body of knowledge has been gathered regarding the reliability of FRP-RC beams with respect to ultimate limit states (ACI 440, 2006; Ribeiro and Diniz, 2013; Shield et al., 2011), the same is not true for serviceability of
FRP-RC beams. In this light, this investigation aims to contribute to the development of semi-probabilistic design recommendations for FRP-RC beams with respect to serviceability limit states (excessive deflections).
The basic problem of reliability of structural engineering systems may be cast essentially as a
supply versus demand problem; in other words, as the determination of the capacity (supply)
of an engineering system to meet certain requirements (demand) (Ang and Tang, 1990). In this work, the basic problem is formulated from the total deflection of FRP-RC beams (demand) to meet an acceptable deflection limit established in accordance to the use of the structure, i.e. the allowable deflection (supply). Since most of the variables involved in the problem (mechanical properties of concrete and FRP, geometric characteristics, model error, loads, etc.) are random, serviceability of FRP-RC beams is established in probabilistic terms. In this context, a Monte Carlo simulation procedure is implemented for the probabilistic description of the beam deflections, and the computation of the probability of failure of designed beams with respect to the limit state of excessive deflections. Due to the lack of Brazilian recommendations for FRP-RC member design, the beams assessed in this study are designed according to ACI 440 (2006) design recommendations.
1.2
OBJECTIVES
The main goal of this work is to contribute to the development of semi-probabilistic design recommendations for FRP-RC beams with respect to serviceability limit states (excessive deflections). To this end, the probabilistic assessment of deflections of FRP-RC beams designed according to ACI 440 (2006) is performed.
selection of a deterministic equation for calculation of the effective moment of inertia of FRP-RC beams;
implementation of a computational procedure using Monte Carlo simulation for the probabilistic description of deflections of FRP-RC beams;
probabilistic assessment of serviceability (excessive deflections) of FRP-RC beams designed according to ACI 440 (2006).
1.3
ORGANIZATION
This study is divided into 7 chapters and 2 appendices.
Chapter 1 contains a brief description of FRP composites and the research significance; the objectives of this study are stated, and a description of subsequent chapters is given at the end of the chapter.
Chapter 2 highlights some of the main mechanical properties of concrete and of FRP bars, as related to serviceability checking of FRP-RC beams.
Chapter 3 summarizes ACI 440 (2006) provisions for flexural design of FRP-RC members, for both ultimate strength and serviceability.
Chapter 4 details general considerations regarding deflections of FRP-RC beams. This includes the calculation of the total deflection, and consequently the calculation of the immediate and long-term deflections. Special attention is given to equations used in the computation of the effective moment of inertia of FRP-RC beams.
Chapter 5 presents a brief review of basic reliability concepts (margin of safety, reliability index, probability of failure, performance function, and Monte Carlo simulation).
serviceability of such beams (excessive deflections) is presented and the corresponding reliability levels are assessed.
Chapter 7 summarizes the main steps along the development of the research presented herein, the main conclusions and recommendations for further researches.
Appendix 1 presents the FRPSERV program for the reliability analysis of serviceability of FRP-RC beams. Monte Carlo simulation is used in order to obtain the statistics of deflections of FRP-RC beams and the corresponding probabilities of failure (and reliability indexes) with respect to the limit state of excessive deflections. This computacional procedure is implemented in the Matlab software, version 7.0.1 (and Statistics toolbox).
2
2.
MECHANICAL PROPERTIES OF MATERIALS
In this chapter, the main mechanical properties of concrete and of FRP bars related to FRP-RC beam deflections are presented.
2.1
CONCRETE
In this study, three specified concrete compressive strengths - 30 and 50 MPa (representing normal strength concrete) and 70 MPa (representing high-strength concrete) - will be evaluated in the probabilistic assessment of deflections of FRP-RC beams.
The use of the high-strength concrete has become very common not only bridges, tunnels or dams, but also in buildings. According to ACI 440 (2006), the high tensile strength of FRP is most efficiently used when paired with high-strength concrete and may increase the stiffness of the cracked region.
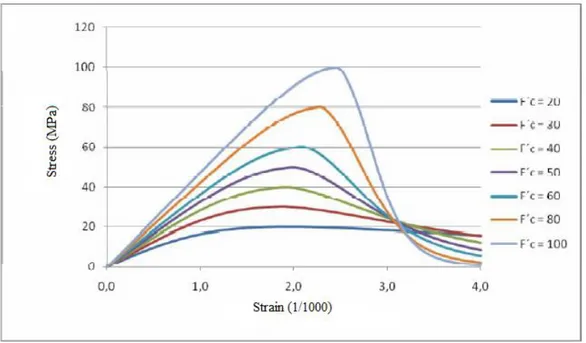
Stress-strain diagram of high-strength concrete is different from that presented by normal strength concrete. The curves shown in Figure 2.1 represent stress-strain diagrams of concrete for different strengths, according to the relationship suggested by Thorenfeldt et al. (1987).
Figure 2.1 - Stress-strain diagram to different strengths of concrete.
From Figure 2.1, it can be observed that:
maximum strength occurs at a strain between 0.002 and 0.003. ACI 318 (2014) assumes that the concrete has a maximum strain (εcu) equal to 0.003;
initial slope of the curves (initial modulus of elasticity) increases with increased compressive strength of the concrete;
the ascending part of the stress-strain curve is similar to a parabola with vertex at the maximum stress. As the concrete strength increases, the ascending part tends to be linear;
the higher the concrete strength, the greater the strain at the maximum stress;
the higher the concrete strength, the lower the maximum strain.
'
4700 c
c f
E (2.1)
where:
f’c = specified compressive strength of concrete (MPa).
Modulus of rupture, fr, for concrete shall be calculated by (ACI 318, 2014):
'
62 .
0 r c
r f
f (2.2)
where λris the modification factor to reflect the reduced mechanical properties of lightweight concrete relative to normal weight concrete of the same compressive strength. For normal weight concrete, λris equal to 1.0.
2.2
FIBER-REINFORCED POLYMERS (FRP)
Mechanical properties of FRP composites can vary significantly from one product to another depending on factors, such as volume and fiber type, resin type, fiber orientation, geometric characteristics, manufacturing process, and quality control during manufacture (ACI 440, 2006). Some of the main mechanical properties of FRP bars are detailed in the following sections.
2.2.1 Tensile behavior of FRP bars
Table 2.1 - Usual tensile properties of reinforcing bars* (ACI 440, 2006).
Properties Steel GFRP CFRP AFRP
Nominal yield stress (MPa) 276 to 517 N/A N/A N/A
Tensile strength (MPa) 483 to 690 483 to 1600 600 to 3690 1720 to 2540
Elastic modulus (GPa) 200.0 35.0 to 51.0 120.0 to 580.0 41.0 to 125.0
Yield strain, % 0.14 to 0.25 N/A N/A N/A
Rupture strain, % 6.0 to 12.0 1.2 to 3.1 0.5 to 1.7 1.9 to 4.4 * Typical values for fiber volume fraction ranging from 0.5 to 0.7.
N/A: Not applicable.
FRP bars do not exhibit any plastic behavior (yielding) before rupture, and is characterized by a linear-elastic stress-strain relationship up to rupture (ACI 440, 2006). Figure 2.2 shows stress-strain diagrams for steel, GFRP, AFRP, and CFRP bars. While steel presents ductile behavior, FRP exhibits brittle behavior in which the rupture of the bars occurs without any sensitive change in deformation, as can be observed in the diagram.
Figure 2.2 - Stress-strain curves of typical reinforcing bars (Fico, 2007).
The tensile strength and stiffness of a FRP bar are dependent on several factors; strength and stiffness variations can occur in bars with different fiber-volume ratios, even in bars with the same diameter, appearance and components. The rate of curing, the manufacturing process, and the manufacturing quality control also affect the mechanical characteristics of the bar (Wu, 1990).
Table 2.2 - Tensile strength of FRP bars.
Metric conversion
Nominal diameter (mm)
Area (mm2)
Minimum tensile strength (MPa)
GFRP CFRP
No. 6 6.4 31.6 760 1450
No. 10 9.5 71 760 1310
No. 13 12.7 129 690 1170
No. 16 15.9 199 655 1100
No. 19 19.1 284 620 1100
No. 22 22.2 387 586 N/A
No. 25 25.4 510 550 N/A
No. 29 28.7 645 517 N/A
No. 32 32.3 819 480 N/A
* N/A: Not applicable.
2.2.2 Compressive behavior of FRP bars
FRP bars with higher tensile strengths usually have higher compressive strengths, except in the case of AFRP, where the fibers present nonlinear behavior in compression at a relatively low level of stress. However, the compressive strength of FRP bars is less than the tensile strength (ACI 440, 2006). Results obtained in studies conducted by Mallick (1988) and Wu (1990) are discussed in ACI 440 (2006). It was found that the compressive strength is approximately 55, 78, and 20% of the tensile strength for GFRP, CFRP, and AFRP, respectively. For this reason, the use of FRP is not recommended to resist compression.
2.2.3 Shear behavior of FRP bars
According to ACI 440 (2006), FRP bars exhibits little shear strength and this is governed by the polymer matrix.
2.2.4 Density
Table 2.3 - Typical densities of reinforcing bars (g/cm³) (ACI 440, 2006).
Steel GFRP CFRP AFRP
7.90 1.25 to 2.10 1.50 to 1.60 1.25 to 1.40 *Typical values for fiber volume fraction ranging from 0.5 to 0.7.
2.2.5 Creep rupture of FRP bars
FRP reinforcing bars can exhibit creep rupture (or static fatigue) when subjected to a constant load over time after a time period called endurance time. The creep rupture endurance time can decrease under adverse environmental conditions such as high temperature, ultraviolet radiation exposure, high alkalinity, wet and dry cycles, or freezing-and-thawing cycles. As the ratio of the sustained tensile stress to the short-term strength of the FRP bar increases, endurance time decreases. Glass fibers are the most susceptible to creep rupture, whereas carbon fibers are the least susceptible to creep rupture (ACI 440, 2006).
2.3
SUMMARY OF THE CHAPTER
In this chapter, some of the main mechanical properties of concrete and FRP bars have been presented. High longitudinal tensile strength and lightweight when compared to steel are some of the advantages of FRP bars. On the other hand, FRP bars have little shear strength, present lower modulus of elasticity than the steel, no yielding before brittle rupture, and should not be used to resist compressive stresses. Additionally, ACI 440 (2006) points out
that the use of high-strength concrete allows for better use of high-strength properties of FRP
3
3.
DESIGN
CONSIDERATIONS
FOR
FRP-REINFORCED CONCRETE BEAMS
In this chapter, some of the existing design recommendations for FRP-RC members are listed, and the ACI 440 (2006) procedures for flexural design of FRP-RC beams are reviewed.
3.1
GENERAL DESIGN CONSIDERATIONS
Countries and regions, such as the United States (ACI 440, 2015), Japan (Japan Society of Civil Engineers, 1997), Canada (CAN/ CSA-S6-06, CAN/ CSA-S806-12), and Europe (fib
2007, 2010) established design-related documents for FRP-reinforced and externally reinforced concrete members (ACI 440, 2015).
Existing recommendations for FRP-reinforced concrete members are analogous to the design of steel-reinforced concrete members. Modifications are influenced by the mechanical properties of FRP bars, and empirical equations are based on experimental results (Ribeiro, 2009).
In Brazil, no document exists addressing utilization of FRP in RC construction; therefore, ACI 440 recommendations will be used for FRP-RC beams in this work. ACI 440 (2006) approach for flexural design of FRP-reinforced concrete members is detailed in the following section.
3.2
ACI-440 recommendations for flexural design
ACI 440 (2006) design recommendations for FRP-RC structures are based on limit state design and are similar to the design recommendations for steel-reinforced concrete members. In limit state design principles, a FRP-reinforced concrete member is designed to meet ultimate limit state requirements and then checked for serviceability criteria. Steel-reinforced concrete beams are usually under-reinforced to ensure yielding of steel before the crushing of concrete (ductile failure), providing ductility to the member. If FRP reinforcement ruptures, failure of FRP-RC beams is sudden (Nanni, 1993; Jaeger et al., 1997; GangaRao and Vijay,
1997; Theriault and Benmokrane, 1998). Both failure modes (FRP rupture and concrete crushing) are fragile but acceptable if strength and serviceability criteria are met. Because FRP does not yield, ACI 440 (2006) recommendations prescribes a higher margin of safety than that used in traditional steel-reinforced concrete design to compensate for the lack of ductility. Thus, the member should possess a higher strength reserve.
Calculation of the strength of cross sections should be based on the following assumptions (ACI 440, 2006):
(i) strain in the concrete and FRP reinforcement is proportional to the distance from neutral axis;
(ii) the maximum usable compressive strain in the concrete is assumed to be 0.003; (iii) the tensile strength of concrete is ignored;
(iv) the tensile behavior of the FRP reinforcement is linearly elastic until failure; and (v) perfect bond exists between concrete and FRP reinforcement.
ϕMn≥ Mu (3.1) where:
ϕ= strength reduction factor;
Mn = nominal moment capacity;
Mu = factored moment at section, result of increased load. (Coefficients of increased loads of ACI 440 – 2006 recommendations are the same as those prescribed in ACI 318 – 2014.) The nominal flexural strength of FRP-RC beams can be determined based on strain compatibility, internal force equilibrium, and failure mode. Failure mode (FRP rupture and concrete crushing) can be determined by comparing the FRP reinforcement ratio to the balanced reinforcement ratio (i.e., a ratio where concrete crushing and FRP rupture occur simultaneously). Because the nonductile behavior of FRP reinforcement, the balanced ratio of FRP reinforcement is computed using its design tensile strength. The FRP reinforcement ratio and the balanced FRP reinforcement ratio can be computed by Eqs. (3.2) and (3.3), respectively: d b Af f (3.2) where:
ρf = FRP reinforcement ratio;
Af = total area of FRP reinforcement;
b = width of rectangular cross section;
d = distance from extreme compression fiber to centroid of tension reinforcement.
fu cu f cu f fu c fb f E E f f
0.85 1 ' (3.3)
where:
β1 = factor taken as 0.85 for concrete strength (f’c) up to and including 27.6 MPa. For strengths above 27.6 MPa, this factor is reduced continuously at a rate of 0.05 per each 6.9 MPa of strength in excess of 27.6 MPa, but is not taken less than 0.65;
f’c = specified compressive strength of concrete (MPa);
ffu = design tensile strength of FRP, considering reductions for service environment (MPa);
Ef = design modulus of elasticity of FRP defined as mean modulus of sample test specimens;
εcu = ultimate strain in concrete.
If the reinforcement ratio is less than the balanced ratio (ρf < ρfb), failure mode is governed by FRP rupture. Otherwise (ρf > ρfb), concrete crushing governs the failure mode. When ρf > ρfb, failure mode of the structure is initiated by concrete crushing and stress distribution in the concrete can be given by ACI 318 rectangular stress block. Based on the equilibrium of forces and strain compatibility, the nominal flexural strength can be calculated by:
2 a d f A
Mn f f (3.4)
where a is the depth of equivalent rectangular stress block given by:
b f f A a c f f ' 85 . 0 (3.5)
and the stress in FRP reinforcement in tension, ff , is computed by:
a a d E
ff f cu 1 (MPa) (3.6)
Substituting Eq. (3.5) into Eq. (3.6), ff can be obtained by:
fu cu f cu f f c cu f
f E E f
f E
f
5 . 0 85 . 0 4 ) ( ' 1 2 (3.7)
2 '
59 . 0
1 bd
f f f M c f f f f n
(3.8)
When ρf < ρfb, the failure of the member is initiated by rupture of FRP bar, and ACI 318 stress block is not applicable because the maximum concrete strain (0.003) may not be reached. In this case, an equivalent stress block would need to be used that approximates the stress distribution in the concrete at the particular strain level reached. This analysis incorporates two unknowns: the concrete compressive strain at failure, εc, and the depth of the neutral axis,
c. In addition, the rectangular stress block factors, α1 and β1, are unknown. The factor α1 is the ratio of the average concrete stress to the concrete strength; factor β1 is given by the ratio of the depth of the equivalent rectangular stress block to the depth of the neutral axis. The analysis involving all these unknowns is complex. Nominal flexural strength can be calculated by the following equation:
2 1c d f A
Mn f fu (3.9)
For a given section, the product (β1 c) in Eq. (3.9) varies depending on material properties and FRP reinforcement ratio. The maximum value for this product is equal to (β1 cb) and is reached when the maximum concrete strain (0.003) is attained. Nominal flexural strength of the member can be calculated by a simplified and conservative mode by Eqs. (3.10) and (3.11) as follows:
2 1 b fu f n c d f A
M (3.10)
d c
fu cu
cu
b
(3.11)
3.2.1 Strength reduction factors
The strength reduction factors suggested by ACI 440 (2006) are given by:
ϕ = 0.55 for ρf≤ ρfb (3.12a)
fb f
0.30.25 for ρfb< ρf < 1.4ρfb (3.12b)
ϕ = 0.65 for ρf≥ 1.4ρfb (3.12c)
where ρf and ρfb are computed by Eqs. (3.2) and (3.3).
The reduction factor equal to 0.55 represents under-reinforced concrete beams where failure mode is governed by FRP rupture; 0.65 for over-reinforced beams where concrete crushing governs the failure mode; and the reduction factor given by Eq. (3.12b) represents beams in a transition zone.
3.2.2 Minimum FRP reinforcement
ACI 440 (2006) prescribes a minimum amount of reinforcement that should be adopted if failure of a member is controlled by FRP rupture, i.e., when ρf < ρfb. The minimum reinforcement area for FRP-reinforced members is given by:
d b f d b f
f A
fu fu
c f
360 9
.
4 '
min
, (psi) (3.13)
where:
Af,min= minimum area of FRP reinforcement;
f’c = specified compressive strength of concrete;
ffu = design tensile strength of FRP, considering reductions for service environment;
b = width of rectangular cross section;
If concrete crushing governs the failure mode (ρf > ρfb) the minimum reinforcement area of FRP is achieved.
3.2.3 Design material properties
The material properties values of FRP bars provided by the manufacturer, such as tensile strength, should be taken as initial values because they do not include the effects of long-term exposure to the environment. This exposure can reduce the strength capacity of FRP bars; therefore, it is necessary to consider in design equations the reduction of the values of the material properties according to the type and level of environmental exposure (ACI 440, 2006).
In order to account for the effects of the environmental exposure, ACI 440 (2006) reduces the tensile strength of FRP bars according to the following expression:
ffu = CE f*fu (3.14)
where:
ffu = design tensile strength of FRP, considering reductions for service environment;
CE = environmental reduction factor for various fiber types and exposure conditions, given in Table 3.1;
f*fu = guaranteed tensile strength of FRP bar.
Table 3.1 - Environmental reduction factor for various fibers and exposure conditions (ACI 440, 2006).
Exposure condition Fiber type Environmental
reduction fator CE
Concrete not exposed to earth and weather
Carbon 1.0
Glass 0.8
Aramid 0.9
Concrete exposed to earth and weather
Carbon 0.9
Glass 0.7
Aramid 0.8
ACI 440 (2006) recommendations also define a reduced design rupture strain that should be used in the design process Eq. (3.15):
εfu= CE ε*fu (3.15)
where:
εfu = design rupture strain of FRP reinforcement;
ε*fu = guaranteed rupture strain of FRP reinforcement.
3.2.4 Serviceability
Serviceability can be defined as satisfactory performance under service load conditions; with deflection calculations being one of the main tasks in a serviceability analysis. FRP-reinforced concrete members have a relatively small stiffness after cracking. Consequently, permissible deflections under service loads can control the design (ACI 440, 2006). Moreover, FRP bars are characterized by higher values of strength and lower modulus of elasticity compared to steel, and this implies that the design of FRP-RC structures will be influenced almost exclusively by the serviceability limit state (Mota et al., 2006; Tegola, 1998). According to
ACI 440 (2006), FRP-reinforced cross sections designed for failure by concrete crushing (more desirable failure mode) satisfies serviceability criteria for deflection.
The serviceability provisions given in existing recommendations for steel-reinforced members need to be modified for FRP-RC members due to differences in properties between steel and FRP, such as lower stiffness, bond strength, and corrosion resistance. At the same longitudinal reinforcement ratio, the replacement of steel with FRP, would typically result in larger deflections (Gao et al., 1998; Tighiouart et al., 1998).
The direct method of deflection control, as presented in ACI 440 (2006) recommendations, is described in the following section.
3.2.4.1Calculation of deflection (direct method)
According ACI 440 (2006), the control of deflection by direct method is given by comparison of the computed deflections with acceptable limits (allowable deflections) set as part of the design criteria for the project.
3.2.4.1.1 Immediate deflection
Immediate deflection (calculated under service loads) of an FRP one-way flexural member can be calculated using the effective moment of inertia (Ie) of the FRP-RC beam and the usual structural analysis techniques.
When maximum moment (Ma) of a beam is less than cracking moment (Mcr), i.e., Ma < Mcr, the section is uncracked and the effective moment of inertia (Ie) is taken to be equal to the gross moment of inertia (Ig). Otherwise, when Ma > Mcr, cracking occurs, causing a reduction in the stiffness of the beam. In this case, the effective moment of inertia, Ie, is based on the cracked moment of inertia (Icr). Thus, separation between behavior of the cracked and the uncracked section is defined by the cracking moment, Mcr. Ig is calculated according to the cross section geometry, while Icr can be calculated using an elastic analysis. The concept that involves the elastic analysis to calculate Icr of FRP-RC is similar to the analysis used for steel-reinforced concrete, where concrete in tension is ignored (ACI 440, 2006). The elastic analysis is given by Eq. (3.16) to (3.18):
t g r cr
y I f
M (3.16)
where:
fr = modulus of rupture of concrete (MPa), defined by Eq. (2.2);
Ig = gross moment of inertia;
2 2 3 3 ) 1 (
3 k n A d k
d b
Icr f f (3.17)
and k is given by:
f f f
f f
f n n n
k 2 ( )2 (3.18)
where:
b = width of rectangular cross section;
d = distance from extreme compression fiber to centroid of tension reinforcement; k = ratio of depth of neutral axis to reinforcement depth;
nf = ratio of the modulus of elasticity of FRP bars (Ef) to the modulus of elasticity of concrete (Ec),
c f f
E E
n ;
Af = total area of FRP reinforcement;
ρf = FRP reinforcement ratio, defined by Eq. (3.2).
The overall flexural stiffness EcI of a flexural member that has experienced cracking at service varies between EcIg and EcIcr, depending on magnitude of the applied moment. Branson (1965) derived an equation to express transition from Ig to Icr. This equation is adopted by ACI 318 (2014) to calculate the effective moment of inertia Ie for steel-reinforced beams and is given by the following equation (ACI 440, 2006):
g cr a cr g a cr
e I I
M M I M M I 3 3 1 (3.19) where:
Mcr = cracking moment;
Ma = maximum moment in the beam;
Ig = gross moment of inertia;
This equation was based on the behavior of steel-reinforced beams at service load levels and reflects two different phenomena: the variation of stiffness (EI) along the member and the
effect of concrete tension stiffening (ACI 440, 2006). Branson’s equation, however, has been found to overestimate the effective moment of inertia of FRP-RC beams, especially for lightly reinforced beams, implying a lesser degree of tension stiffening than in comparable steel-reinforced beams (Nawy and Neuwerth, 1977; Benmokrane et al., 1996; Toutanji and Saafi,
2000). According to ACI 440 (2006), this reduced tension stiffening may be attributed to the lower modulus of elasticity and different bond stress levels for the FRP reinforcement as compared with those of steel.
Gao et al. (1998) proposed a modified equation for the effective moment of inertia to account
for reduced tension stiffening in FRP-RC beams. This equation is recommended by ACI 440 (2006) and is given by:
g cr a cr g d a cr
e I I
M M I M M I 3 3 1 (3.20)
where βd is a reduction coefficient related to the reduced tension stiffening exhibited by FRP-RC members.
Research has demonstrated that the degree of tension stiffening is affected by the amount and stiffness of the flexural reinforcement and by the relative reinforcement ratio (ratio of ρf to ρfb) (Toutanji and Saafi, 2000; Yost et al., 2003). Based on an evaluation of experimental results
from several studies, ACI 440 (2006) recommends the following relationship forβd:
0 . 1 5 1 fb f d (3.21) where:
ρf = FRP reinforcement ratio, defined by Eq. (3.2);
ρfb = FRP reinforcement balanced ratio, defined by Eq. (3.3).
lower than Mcr, then the calculated deflection should be based on Ig. In cases where Ma is slightly less than Mcr, the section can be considered as cracked because factors such as shrinkage and temperature may cause the section to crack even if Ma < Mcr; and Ma = Mcr must be assumed.
Several researchers have proposed other equations of computing the effective moment of inertia for FRP-RC beams. Some of these equations are presented in Chapter 4.
3.2.4.1.2 Long-term deflection
Long-term increase in deflection is a function of member geometry (reinforcement area and member size), load characteristics (age of concrete when loading is applied, and magnitude and duration of sustained loading), and material properties (modulus of elasticity of concrete and FRP reinforcement, creep and shrinkage of concrete, formation of new cracks, and widening of existing cracks) (ACI 440, 2006).
Study performed by Brown (1997) shows that data on time-dependent deflections of FRP-RC members due to creep and shrinkage indicate that the time-versus-deflection curves of FRP-reinforced and steel-FRP-reinforced members have the same basic shape, indicating that the same fundamental approach for estimating the long-term deflection can be used.
Long-term deflection due to creep and shrinkage, Δ(cp + sh), for steel-reinforced concrete beams can be computed according to the following equations (ACI 440, 2006):
Δ(cp + sh) =λ (Δi)sus (3.22) and the factor λ is given by:
' 50 1
(3.23)
where:
Δi(sus) = immediate deflection due to sustained loads;
ρ’ = ratio of steel compression reinforcement, given by
d b
A's '
, where A’s is the area of compression reinforcement, b is the width of rectangular cross section, and d is the distance
from extreme compression fiber to centroid of tension reinforcement.
Table 3.2 - Time-dependent factor for sustained loads (ACI 318, 2014).
Sustained load duration (months)
Time-dependent factor (ξ)
3 1.0
6 1.2
12 1.4
60 or more 2.0
ACI 440 (2006) recommendations defines that for FRP-RC beams the factor λ reduces to ξ because the compression reinforcement is not considered for FRP-RC members (ρ’f = 0). Therefore, long-term deflections for FRP-RC beams are computed by:
Δ(cp + sh) = ξ (Δi)sus (3.24) Brown (1997) observed that the long-term deflection of FRP-RC beams with no compression reinforcement with a sustained load over a period of 6 months was 60 to 90% of the initial deflection. The measured additional long-term deflection was only 50 to 75% of the deflection suggested by Eqs. (3.22) and (3.23). Other studies performed by Vijay et al. (1998)
and Arockiasamy et al. (1998) found similar results for both GFRP and CFRP beams (ACI
440, 2006).
Based on these results, ACI 440 (2006) recommends a modification factor of 0.6 in Eq. (3.24). Therefore, for typical applications, the calculation of the long-term deflection of FRP-RC beams can be determined from Eq. (3.25):
Δ(cp + sh) = 0.6 ξ (Δi)sus (3.25)
3.3
SUMMARY OF THE CHAPTER
4
4.
DEFLECTIONS OF FRP-RC BEAMS
This chapter begins with general considerations on deflections of FRP-RC beams. The approach used in the calculation of the total deflection (sum of immediate and long-term deflection) is presented. Particular attention is given to the equations for the calculation of the effective moment of inertia of FRP-RC beams.
4.1
GENERAL CONSIDERATIONS
Deflections of FRP-RC beams tend to be greater in magnitude compared to deflections in traditional steel-reinforced beams because of the lower stiffness associated with commercially available FRP reinforcement (ACI 440, 2006). Because of the variable stiffness, brittle-elastic nature, and particular bond features of FRP reinforcement, deflections of FRP-RC members are more sensitive to the variables affecting deflection than steel-reinforced members of identical size and reinforcement layout (ACI 440, 2006).
As seen in Section 3.2.4, ACI 440 (2006) recommendations establish that control of deflections are made by the direct method, detailed in Section 3.2.4.1.
The total deflection is given by the sum of the long-term deflection due to all sustained loads and the immediate deflection due to any additional live loads. The calculation procedure for the long-term deflection for FRP-RC beams was described in Section 3.2.4.1.2. Although ACI 440 (2006) recommends the equation proposed by Gao et al. (1998) [Eq. (3.20)] for the
calculation of the effective moment of inertia to be used in the estimation of the immediate deflection of FRP-RC beams, that document also reminds that other equations for the same purpose have been proposed. Most of the proposed equations involve changes in the original
4.2
EQUATIONS FOR THE EFFECTIVE MOMENT OF
INERTIA
4.2.1 Benmokrane et al. (1996)
To calibrate the original Branson’s equation for FRP-RC beams [Eq. (3.19)], Benmokrane et al. (1996) proposed α and β coefficients derived from experimental programs. According to
that study, the effective moment of inertia Ie can be computed by Eq. (4.1):
g cr a cr g a cr
e I I
M M I M M I 3 3 1 (4.1)
In this equation, α and β coefficients are taken as 0.84 and 7, respectively.
4.2.2 Brown and Bartholomew (1996)
Brown and Bartholomew (1996) have suggested a variation of Branson’s equation that consists of changing the exponent value in Eq. (3.19) to five, thus resulting in the following equation for the calculation of the effective moment of inertia Ie:
g cr a cr g a cr
e I I
M M I M M I 5 5 1 (4.2)
4.2.3 Toutanji and Saafi (2000)
Toutanji and Saafi (2000) proposed a different variation of the Branson’s equation related to the order of the exponent in the original equation. While Brown and Bartholomew (1996) suggested that the value of the exponent of Ie is equal to 5 [Eq. (4.2)], Toutanji and Saafi defines that this exponent depends on both the FRP modulus of elasticity (Ef) and FRP reinforcement ratio (ρf). In this way, the equation to calculated Ie is defined by:
g cr m a cr g m a cr
e I I
M M I M M I
1 (4.3)
- if f 0.3 s
f
E E
, f
s f
E E m610 ;
- if f 0.3 s
f
E E
, m = 3.
where:
Ef = design modulus of elasticity of FRP;
Es = modulus of elasticity of steel;
ρf = FRP reinforcement ratio.
4.2.4 Rizkalla and Mufti (2001)
Rizkalla and Mufti (2001) have suggested an equation for Ie derived from the effective moment of inertia equation proposed by CEB-FIP MC-90 (CEB-FIP 1990). This equation is given by:
T cr
ga cr cr cr T e I I I M M I I I I 2 5 . 0 1 (4.4)
where IT is the moment of inertia of uncracked section transformed to concrete.
4.2.5 Yost et al. (2003)
As already mentioned, Eq. (3.20) proposed by Gao et al. (1998) was adopted by ACI 440
(2003) (see Section 3.2.4.1.1). The reduction coefficient βd introduced in that equation is given by:
1.0
s f d E E (4.5)
where Ef is the modulus of elasticity of FRP, Es is the modulus of elasticity of steel, and α is a bond dependent coefficient.
13 . 0 064
.
0 fb f (4.6)
where ρf is FRP reinforcement ratio and ρfb is FRP reinforcement balanced ratio.
4.2.6 Bischoff and Scanlon (2007)
Limitations of Branson’s equation for FRP-RC members led Bischoff and Scanlon (2007) to develop an alternative equation for Ie defined by:
g a cr s cr e I M M I I 2
1 (4.7)
where ηs is the stiffness reduction coefficient equal to g cr I I 1 .
4.2.7 Bischoff and Gross (2011)
Bischoff and Gross (2011a, 2011b) developed an equation from the integration of curvature using Eq. (4.7), resulting in the following expression for the equivalent moment of inertia, I’e:
g a cr cr e I M M I I 2 1 ' (4.8)
Figure 4.1 - Equivalent moment of inertia values for calculating deflection (Bischoff and Gross, 2011b).
4.3
SUMMARY OF THE CHAPTER
Deflections of FRP-RC beams are expected to be greater than those of steel-reinforced beams because of the lower stiffness of FRP bars. Both immediate and long-term deflections under service loads shall be considered in the design process and the total deflection (given by the sum of immediate and long-term deflection) of FRP-RC beams shall be computed. Long-term deflections of FRP-RC beams have been discussed in Section 3.2.4.1.2.
discussed. Studies available in the literature report that traditional Branson’s equation used to
5
5.
RELIABILITY BASICS
5.1
INTRODUCTION
In the development of engineering projects, engineers often make decisions based on available information, using analytical methods and evaluation that include improved modeling and mathematical analysis, such as numerical simulation and optimization techniques. However, regardless of the level of sophistication of such models (including models of laboratory), they are predictions, assumptions or idealized conditions; hence, information obtained from these models may or may not reflect the reality. However smaller, there is always a probability of a structure to underperform. This probability relies upon the information obtained, which are deduced from models in similar or different situations. Therefore, estimating an accurate probability of underperformance is difficult due to inherent variability of these informations.
A number of uncertainties are present in the structural design problem. These may be related to inherent variability such as material properties (steel yield strength, steel ultimate strength, concrete compressive strength, concrete modulus of elasticity, etc.), dimensions (beam width and depth, concrete cover, etc.), loads (dead loads, live loads, wind, earthquake, etc.) or epistemic uncertainties, i.e., those related to the lack (or limited) knowledge. In this latter category are the errors associated to predictive models, sampling errors, and measurement errors. These errors may be reduced as more information is gained (Diniz, 2008).
5.2
METHODS OF RELIABILITY ANALYSIS
5.2.1 Basic problem
The basic problem of structural reliability may be cast as a problem of supply versus demand.
In Structural Engineering, the basic problem is to ascertain that the strength, X,will be larger
than the load (or load effects), Y, throughout the life of the structure, i.e., (X > Y). This
assurance is possible only in terms of the probability P(X > Y). This probability, therefore,
represents a realistic measure of the reliability of the structural component (Ang and Tang, 1990).
Assuming that the probability distributions of X and Y are known, that is, FX (x) or fX (x) and
FY (y) or fY (y), and random variables X (strength) and Y (load effects) are continuous and statistically independent, the probability of failure PF is given by:
dy y f y F
PF X( ) Y ( )
0
(5.1)
Equation (5.1) is the convolution with respect to y and may be explained from Figure 5.1 as
follows. If Y = y, the conditional probability of failure would be FX (y); however, in terms of continuous variables, the probability that y < Y ≤ y + dy is associated with probability fY (y)
dy, and integration over all values of Y yields Eq. (5.1). Alternatively, the reliability may be
formulated also by the convolution with respect to x (Ang and Tang, 1990).
According to Ang and Tang (1990), the corresponding probability of nonfailure Ps is:
PS = 1 –PF (5.2)
As seen in Figure 5.1, the overlapping of the curves fX (x) and fY (y) represents a qualitative measure of the probability of failure PF. In general, the probability of failure may be expressed in terms of joint probability density function of X and Y, fX, Y (x, y) as follows (Ang and Tang, 1990):
dy dx y x f P y Y X
F
0 0
, ( , ) (5.3)
and the corresponding probability of nonfailure Ps is given by:
dx dy y x f P x Y X S
0 0
, ( , ) (5.4)
Knowledge of the probability density functions fX (x) and fY (y) for statistically independent random variables, - or the joint probability density function fX, Y (x, y)-, is required in the computation of the probability of failure via Eqs. (5.1) and (5.3), respectively. However, as discussed in most textbooks on Structural Reliability (e.g. Ang and Tang, 1990) the use of these equations to compute the probability of failure is limited. In the following sections some basic concepts in Structural Reliability theory are reviewed and Monte Carlo simulation (Ang and Tang, 1990) is briefly presented.
5.2.2 Margin of safety
The supply-demand problem may be formulated in terms of the margin of safety, M = X–Y.
Since X and Y are random variables, M is also a random variable with corresponding
) 0 ( ) ( 0 M M
F f m dm F
P
(5.5)
Graphically, this is represented by the area below 0 under the curve fM (m), as show in Figure 5.2.
Figure 5.2 - Probability density function of safety margin M.
For a structure whose strength, R, and load, Q, are statistically independent random variables
following Normal distributions, i.e., N (μR, σR) and N (μQ, σQ), respectively, the margin of safety M is also a normal random variable N (μM, σM). The notation N (μ, σ) represents a normal variable with mean μ and standard deviation σ. The mean and standard deviation of the margin of safety is given by (Ang and Tang, 1990):
μM = μR–μQ (5.6)
2 2
Q R
M
(5.7)
The probability of failure PF can be computed by the following equation:
where Ф is the standard normal cumulative distribution function, N (0, 1), and the probability
of nonfailure PS is:
M M F S P P 1 (5.9)
It may be observed that reliability is a function of the ratio μM / σM, which is the safety margin expressed in units of σM and is known as “reliability index” and denoted by β, as follows:
2 2 Q R Q R M M (5.10)
In this case, linear performance function (see Section 5.3) and normal variables, the reliability index can be computed based solely on the information on the means and the standard deviations of the basic variables pertaining to the problem.
The probability of nonfailure, therefore, can be calculated in terms of the reliability index as follows:
Ps= Ф(β) (5.11)
and the corresponding probability of failure:
PF = 1 - Ф(β) = Ф(-β) (5.12)
5.3
PERFORMANCE FUNCTION
The reliability of an engineering system may involve multiple variables. In particular, the supply and demand may be a function of many variables. For such cases, the supply-demand problem described in Section 5.2.1 must be generalized. This generalization is often necessary in engineering, particularly when the problem must be formulated in terms of the basic design variables (Ang and Tang, 1990).