Universidade de Lisboa
Faculdade de Farmácia
Continuous Mixing of Pharmaceutical Pellets
Ana Rita Teixeira Martins
Dissertation to obtain the Master of Science Degree in
Pharmaceutical Engineering
Supervisors:
Prof. Dr. José Monteiro Cardoso de Menezes
Dipl.-Ing. Dr. Stephan Sacher
Universidade de Lisboa
Faculdade de Farmácia
Continuous Mixing of Pharmaceutical Pellets
Ana Rita Teixeira Martins
Dissertation to obtain the Master of Science Degree in
Pharmaceutical Engineering
Supervisors:
Prof. Dr. José Monteiro Cardoso de Menezes
Dipl.-Ing. Dr. Stephan Sacher
The experimental work that supports this dissertation was performed at Research Center Pharmaceutical Engineering (Graz, Austria) in the framework of RCPE’s project A3.20 “A European Consortium for Continuous Pharmaceutical Manufacturing of Solid Dosage Forms”. All the required facilities, equipment and materials for this work’s accomplishment were gently provided.
i
Abstract
Increasing demands on patient safety and reducing manufacturing costs have driven the pharmaceutical industry to adopt a new manufacturing paradigm: Continuous manufacturing. In order to implement it, all batch unit operations must be converted to their continuous equivalent and raw material feeding issues must be resolved. This study is focused on a continuous blender, the unit operation most commonly needed in manufacturing. A homogenized powder mixture is required to produce oral solid dosage forms with minimum active pharmaceutical ingredients (API) content variability, under strict regulatory constraints. More specifically, the mixing performance of the continuous blender will be studied for formulations containing pellets. Pellets produced by hot melt extrusion are a mean to solve solubility issues of many promising APIs.
The main objective of this dissertation is to characterize the flow behavior inside the blender, using impulse stimulus response experiments and subsequent residence time distribution analysis. The effect of operational conditions, particularly material flow rate and the mixer’s rotation speed, on parameters like hold-up mass, mean residence time of pellets and shear intensity were studied. Furthermore, the blender mixing performance was assessed using the relative standard deviation as a mixing index.
The main results are as follows: The hold-up mass decreases when increasing the rotation rate and decreasing the feeding rate. At low throughputs, the mean residence time of pellets increased when increasing rotation rate. The opposite effect was observed operating at higher feed rates. The extension of axial mixing and shear intensity increased when blender’s velocity increased. No particular trend was observed on them by changing flow rate. A low rotation rate combined with a high feed rate showed the best mixing performance. Continuous manufacturing can be realized when on-line process analytical technologies (PAT) are available. In this work, efforts were done to implement on-line near-infrared spectroscopy (NIR) to monitor blend homogeneity without satisfactory results. In order to achieve the goal of this thesis, one subsequently used an off-line method.
This work gave insight about how pellets behave in a continuous mixer under different process parameters and what are the better conditions to achieve a homogenous blend.
Keywords:
ii
Resumo
A mistura é uma operação unitária sempre presente na indústria farmacêutica. Na produção de formas farmacêuticas sólidas, é necessário incluir vários outros componentes para além da substância ativa. Excipientes como diluentes, aglutinantes, desintegrantes, lubrificantes, entre outros, são adicionados de maneira a melhorar a estabilidade e biodisponibilidade do fármaco, aumentar a aceitabilidade por parte do paciente e atuar como adjuvantes do processo de produção. Precisamente, a mistura é o processo que permite distribuir uniformemente os vários constituintes da formulação através do movimento das partículas ao longo de todo o granel. Trata-se, portanto, de um passo crítico na produção secundária de formas farmacêuticas sólidas, já que em última análise, afeta a uniformidade de dose do medicamento final.
A produção de medicamentos na indústria farmacêutica é geralmente realizada em
batch, enquanto outras indústrias operam em modo contínuo, como é o caso das indústrias
química e alimentar. Num processo contínuo, o rendimento dos diferentes equipamentos estão coordenados de maneira a que não ocorra acumulação de massa dentro do sistema, já que a entrada de matérias-primas se dá à mesma velocidade que a saída do material processado, durante um período de tempo ininterrupto. Nos últimos anos, as autoridades reguladoras do medicamento têm vindo a reconhecer a produção em contínuo como alternativa à produção por lotes e o seu potencial em melhorar a qualidade dos medicamentos. Os custos de produção podem ser reduzidos, já que existe processamento de grandes volumes com equipamento de menores dimensões, poupança de energia, menor interferência dos operadores, aumentando a segurança dos mesmos e reduzindo os riscos de segregação devido ao manuseamento de pós entre as diferentes operações. A produção em contínuo implica menos problemas de scale-up, já que o tamanho do lote é definido pelo fator “tempo”. Como tal, o mesmo tamanho de equipamento pode ser usado para a fase de desenvolvimento, estudos em escala piloto, ensaios clínicos e para a produção comercial. Mais importante ainda, é a oportunidade de implementação de tecnologias analíticas de processo como sistema de aquisição de dados integrado em todas as operações da linha de produção. Isto permite o controlo de qualidade em tempo real dos intermediários (como por exemplo tamanho dos grânulos ou homogeneidade de mistura) e do produto final. Como resultado, é possível
iii
conhecer e controlar as fontes de variabilidade do processo e tomar sobre ele decisões cientificamente fundamentadas.
O presente trabalho é parte integrante de um projeto de desenvolvimento de uma linha de produção de formas farmacêuticas sólidas em contínuo (mais propriamente comprimidos), compreendendo os processos de extrusão, esferonização, mistura e compressão. Posto isto, o objetivo deste trabalho é desenvolver conhecimento sobre o processo de mistura em contínuo envolvido, quando utilizando pellets e lactose monohidratada.
No contexto farmacêutico, os pellets podem ser definidos como pequenas partículas, aproximadamente esféricas, com diâmetro compreendido entre 0.5 e 1.5 mm, produzidas pela aglomeração de pós finos. Caracterizam-se especialmente pelas ótimas propriedades de escoamento, associadas à desvantagem de facilitada segregação. A utilização de comprimidos contendo pellets prende-se com a oportunidade de aumentar a biodisponibilidade e permitir a libertação modificada do fármaco, ou a administração de fármacos incompatíveis. Neste sistema, a substância ativa pode encontrar-se no núcleo dos
pellets ou no seu revestimento.
De acordo com o conhecimento atingido neste trabalho, o processo de mistura contínua usando pellets farmacêuticos ainda não foi reportado na literatura. Quanto ao processo em si, mereceu a atenção de diversos grupos de investigação na última década, que têm vindo a estudar o efeito de variáveis de processo (caudal de entrada, velocidade de rotação das pás, número e orientação das pás, inclinação do misturador) no comportamento de pós durante o seu fluxo no interior do misturador. No entanto, a relação entre a eficiência do misturador e as propriedades dos pós utilizados, como por exemplo o tamanho, forma, densidade ou a coesão entre diferentes tipos de partículas não foi tão extensivamente analisado.
A presente tese divide-se em dois grandes objetivos. Primeiramente, caracterizar o comportamento dos pellets no interior do misturador sob diferentes caudais de entrada e diferentes velocidades de rotação das lâminas, usando distribuições dos tempos de residência. Pretende-se analisar as variações nos parâmetros volume de retenção, tempo de residência médio dos pellets e lactose e número de passagens das lâminas. Adicionalmente, a homogeneidade da mistura obtida será analisada igualmente sob a variação dos mesmas condições de processo, fazendo o misturador funcionar continuamente durante dez minutos.
iv
Será aplicado o índice de homogeneidade geralmente utilizado na indústria farmacêutica para avaliação da qualidade de misturas, o desvio padrão relativo à média.
A monitorização de um processo de mistura em contínuo é realizado calculando a concentração do componente de interesse na mistura (geralmente a substância ativa e neste caso os pellets), quando esta forma um fluxo de material à saída do equipamento.
O primeiro grupo de experiências levadas a cabo focaram-se no desenvolvimento de um método on-line usando espectroscopia de Infravermelho Próximo (NIR) para monitorizar o processo de mistura. Esta técnica foi já implementada com sucesso no estudo de processos de mistura em contínuo. No entanto, aqui a espectroscopia NIR foi abandonada na fase de desenvolvimento de um modelo de calibração, cujo objetivo seria prever a concentração de
pellets à saída do misturador. A aquisição de espectros NIR das amostras de calibração foi
realizada sob condições o mais semelhante possível às condições de aquisição de espectros no processo de mistura em contínuo e foram aplicados pré-processamentos espectrais adequados. No entanto, os modelos PLS (partial least squares) obtidos apresentaram elevados erros de previsão. Vários fatores podem ter levado à aquisição errónea de espectros. Em primeiro lugar, nas amostras de calibração, os pellets surgiram completamente cobertos por lactose. Para além disso, é sabido que o movimento das partículas das amostras influencia as medidas do NIR, ao contrário de amostras analisadas estaticamente. Em trabalhos posteriores, sugere-se a utilização de pellets contendo no seu interior uma substância ativa que apresente um pico de absorvância característico na região do infravermelho próximo.
Consequentemente, os tempos de residência e a homogeneidade da mistura foram estudados usado uma técnica off-line de análise do tamanho de partícula para medir a concentração de pellets em amostras recolhidas manualmente à saída do misturador.
Relativamente à caracterização do comportamento do fluxo de material no interior do misturador, os resultados obtidos resumem-se a seguir. O volume de retenção de material no interior do misturador diminuiu quando aumentou a velocidade de rotação das pás, e aumentou à medida que o caudal de entrada aumentou. Usando um caudal de entrada de lactose de 2 kg/h, o tempo de residência médio dos pellets aumentou à medida que a velocidade de rotação aumentou. Nestas condições, foi visto que predominam forças centrífugas dentro do equipamento. Logo, o fluxo à entrada não tem força suficiente para empurrar os pellets ao longo da câmara. Deste modo, passaram mais tempo a sofrer mistura
v
na direção radial, em vez de se moveram na direção axial, resultando num maior tempo de residência. A existência de back mixing pode ser questionada e também explicaria o elevado tempo de residência dos pellets nas condições experimentais referidas. A extensão da mistura na direção axial e o número de passagens das lâminas sofridos pelos pellets (usado como medida da intensidade de corte aplicada) aumentou quando a velocidade de rotação das lâminas aumentou. Não se observou nenhuma tendência particular nestes parâmetros ao fazer variar o caudal de entrada.
A velocidade de rotação do misturador foi o parâmetro que mais afetou a homogeneidade da mistura obtida à saída do equipamento. A menor velocidade de rotação testada, correspondente a 100 rpm, revelou a melhor qualidade de mistura, refletido no menor valor do desvio padrão da concentração de pellets em cada amostra recolhida, relativo à média. Nesta experiência, a lactose foi alimentada a 8 kg/h e os pellets a 3.43 kg/h. Este resultado pode ser justificado por um valor intermédio do tempo de residência dos pelles nestas condições. Deste modo, despendem mais tempo no interior do equipamento para sofrer maior número de revoluções juntamente com a lactose, resultando numa melhor homogeneidade. Outra razão para a boa qualidade da mistura resultante é a maior precisão dos equipamentos de alimentação de sólidos quando operam a velocidades mais elevadas.
Em suma, a presente dissertação contribuiu para o conhecimento sobre o comportamento dos pellets durante um processo de mistura em contínuo, sob diferentes condições de processo. Proporcionou alguma perceção sobre as melhores condições para atingir uma homogeneidade de mistura aceitável. Não obstante, os resultados e conclusões aqui revelados podem não observar-se usando outro tipo de pellets. Num verdadeiro processo de produção de comprimidos, os pellets conteriam uma ou mais substâncias ativas e, como resultado, a sua densidade seria diferente. Este fator é suficiente para induzir um comportamento de mistura diferente ou levar a maiores tendências de segregação.
O trabalho experimental que suporta esta dissertação foi realizado na empresa Research Center Pharmaceutical Enginnering (Graz, Áustria) no âmbito do projeto A3.20: A European
Consortium for Continuous Pharmaceutical Manufacturing of Solid Dosage Forms.
Palavras-chave: Mistura em contínuo; pellets; distribuição dos tempos de residência; homogeneidade da mistura.
vi
Acknowledgments
My first gratitude words go to Stephan Sacher and Marcos Llusa, for the opportunity to perform my Master’s Thesis in such a well-recognized company and in a great working atmosphere. Especially to Marcos, for all the enlightenments, for tutoring me through my work and for all the helpful tips and advices. A great thank you to Professor José Cardoso de Menezes for having opened this experience door for me and also, for revising my thesis.
I would also thank RCPE’s laboratory team for all the technical support.
A distinct thanks to my flat mates Christina and Lena who gave a special taste to my stay in Graz. It was a great pleasure to share the house with you both, thanks for the stories, laughs and sharing.
I have to thank to Joana, Nélio, and Diogo for the time spent together, for their advices and for making me feel more close to our country.
And of course, my friends in Lisbon and especially to my best friends Inês and Susana for being present practically every day.
To Ricardo, my dearest fellow, for the last four years full of joy and love. Thank you for always encouraging me.
To Margarida, for understanding my absence and for the constant friendly brotherhood even at a distance. I wish you the best in life and that one day you’ll be a successful woman.
There are no words to express the gratitude to my parents, that supported me financially and made my experience abroad possible; but more importantly for their strength and for always believing in my success. I dedicate you this thesis.
vii
Contents
Abstract ... i Resumo ... ii Acknowledgments ... vi Contents ... vii List of Tables ... ix List of Figures ... xList of Abbreviations ... xii
Chapter 1 – Introduction ... 1
1.1. Continuous manufacturing ... 2
1.2. Continuous dry mixing ... 4
1.2.1. Studies on continuous powder blending... 6
1.2.2. Monitoring techniques applied to continuous mixing process ... 10
1.3. Pellets in pharmaceutical industry ... 11
1.3.1. Segregation problems for pellets ... 12
1.3.2. Multiple-unit pellet system (MUPS) ... 12
Chapter 2 – Materials and continuous mixing equipment ... 14
2.1. Mixture considered ... 14
2.2. Continuous mixing equipment ... 15
2.3. Feeding systems ... 16
Chapter 3 – Development of an analytical method to monitor the pellet concentration at the outlet of the continuous blender ... 18
3.1. On-line method using near-infrared spectroscopy (NIRS) ... 18
3.1.1. Preparation of calibration samples ... 18
3.1.2. NIR Instrumentation, data collection and processing ... 19
3.1.3. Experimental set-up for acquisition of NIR spectra ... 20
3.1.4. Results and discussion ... 22
3.1.5. Conclusions ... 28
3.2. Offline method using particle size analysis with Image Analysis Sensor QICPIC 30 Chapter 4 – Methodology for continuous mixing study ... 33
4.1. Experimental conditions ... 33
viii
4.3. Measurement and calculation of flow behavior and homogeneity parameters... 36
Chapter 5 – Results and discussion of blender characterization ... 40
5.1. Residence time distributions ... 40
5.2. Characterization of the blend homogeneity ... 45
Chapter 6 – Conclusions ... 50
References ... 53
ix
List of Tables
Table 1: Significant conclusions from investigations on continuous pharmaceutical blending reported in the literature and corresponding powder mixtures, equipments and monitoring techniques handled. References are ordered by date. Abbreviations: APAP – acetaminophen; OTC – over-the-counter drug; MCC – Micro-crystalline cellulose; HPMC – hydroxypropyl methylcellulose; MgSt – magnesium stearate; NIRS – Near infrared spectroscopy; LIF – light induced fluorescence; PEPT – Positron Emission Particle Tracking. ... 8 Table 2: Flowability values of Lactose Tablettose 70® grade. Adapted from MEGGLE (2014). ... 15 Table 3: Root mean square error of prediction (RMSEP) when using the PLS model developed with rotating plate 1 and 2 calibration samples to predict the pellet content in the samples from the other experiments. ... 27 Table 4: Conditions used in the pulse injection experiments. ... 33 Table 5: Conditions used in the step injection experiments. ... 34 Table 6: Fraction of the total injected pellets spending 1 minute or less inside the continuous ... 42 Table 7: Powder flow behavior parameters calculated for each experiment. ... 43
x
List of Figures
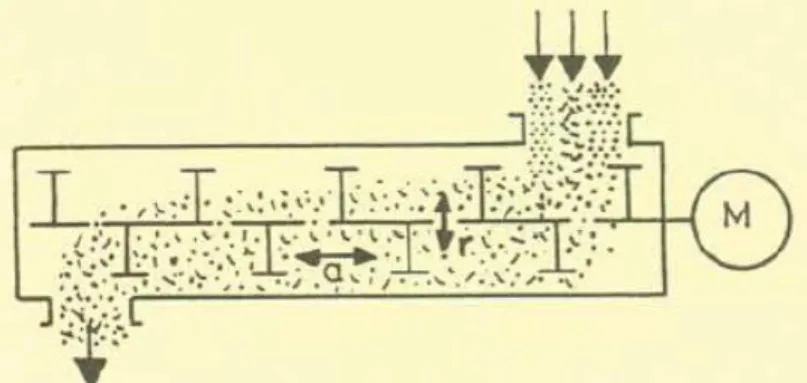
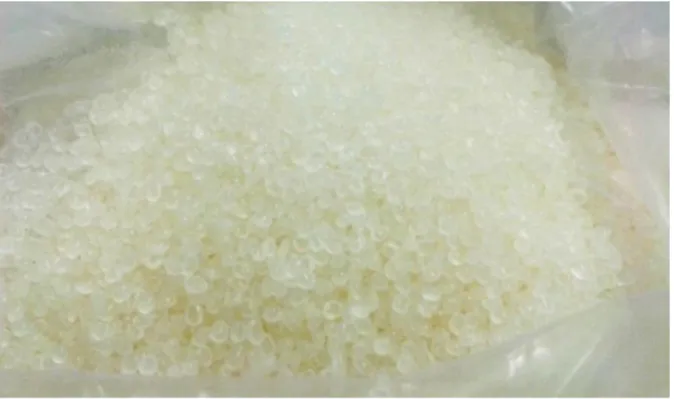
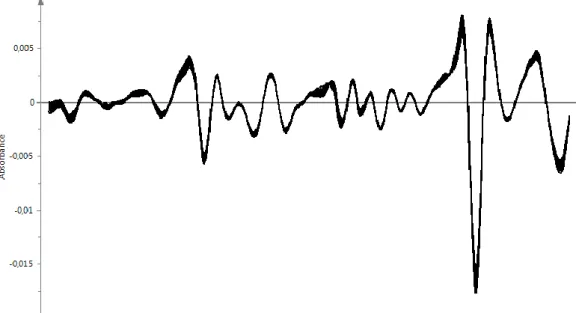
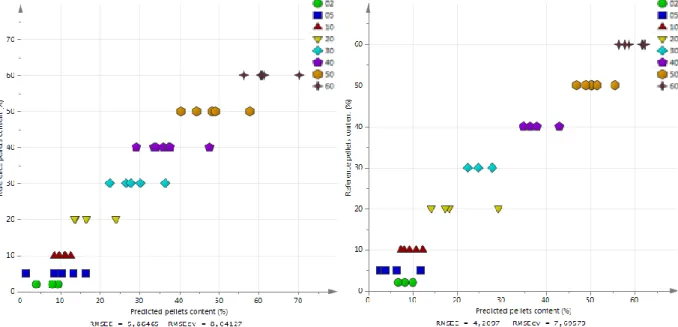
Figure 1: Different continuous manufacturing configurations for tablets production: (a) PROMIS line described in Simonaho et al. (2016). (b) Continuous production line being developed at RCPE’s facilities. (c) Direct compression configuration. ... 3 Figure 2: Continuous convective mixing. a = axial dispersion effect, r = radial mixing effect. M = motor. Adapted from Gericke (1993). ... 4 Figure 3: Kollidon pellets. ... 14 Figure 4: Details of the continuous mixer impeller design. I1, I2 and I3 are the blender’s inlets and O is the outlet. ... 15 Figure 5: (a) Loss-in-weight feeder model K-SFS-24 by Coperion K-Tron. (b) Twin concave screw design, used to fed the materials in the present study. Retrieved from http://www.ktron.com/process-equipment/feeders/feeding-equipment/micro-compact-feeders.cfm ... 17 Figure 6: Experimental setup for off-line NIR spectra acquisition: (a) Funnel experiment, (b) Chute experiment, (c) Rotating plate experiment. ... 21 Figure 7: Pure pellets (a) and pure lactose (b) raw spectra, acquired in static mode. ... 23 Figure 8: Calibration samples' spectra for funnel experiment, after pre-treatment with SNV followed by 2nd derivative. Plot obtained at SIMCA 13. ... 23 Figure 9: The chemometric model from 2% to 60% (w/w) pellets content in the calibration samples of the funnel experiment. The model obtained consists of 4 latent variables. ... 25 Figure 10: The chemometric model from 2% to 60% (w/w) pellets content in the calibration samples of the chute experiment. The model obtained consists of 5 latent variables. ... 25 Figure 11: The chemometric model from 2% to 60% (w/w) pellets content in the calibration samples of the rotating plate 1 experiment. The model obtained consists of 3 latent variables. ... 26 Figure 12: The chemometric model from 2% to 60% (w/w) pellets content in the calibration samples of the rotating plate 2 experiment. The model obtained consists of 3 latent variables. ... 26 Figure 13: Prediction-set using the PLS model developed with rotating plate 1 calibration samples to predict the pellets content in samples from (a) funnel experiment, (b) chute experiment, (c) rotating plate 2 experiment... 27 Figure 14: Prediction-set using the PLS model developed with rotating plate 2 calibration samples to predict the pellets content in samples from (a) funnel experiment, (b) chute experiment, (c) rotating plate 1 experiment... 27
xi Figure 15: Particle size analysis of a mixture comprising lactose monohydrate and pellets at 10% (w/w). (a) Corresponds to the Gaussian distribution of particle sizes of lactose in the first and second peak, respectively. (b) Represents the cumulative distributions curve. ... 30 Figure 16: (a) Image Sensor Analysis QICPIC equipment set-up coupled with 1) dry vibratory feeder VIBRI and 2) dry dispersing unit RODOS. (b) Schematic presentation of the optical set-up of the QICPIC system. Both images were adapted from Witt et al., 2004. ... 30 Figure 17: QICPIC’s reported output for a known 10g sample containing 50% (w/w) pellets. Both particle size distribution of the mixture and percentage of pellets are plotted. ... 32 Figure 18: Appearance of the particle flow shadow projection during a sample analysis. . 32 Figure 19: Experimental setup for continuous blending study. ... 35 Figure 20: Residence time distribution curves from pellets particles as a function of rotation rate and lactose flow-rate: (a) 2 kg/h, (b) 5 kg/h, (c) 8 kg/h. ... 41 Figure 21: Effect of process parameters rotation rate and flow-rate on (a) hold-up, (b) mean residence time, (c) mean centered variance and (d) number of blade passes. ... 42 Figure 22: Effect of process parameters rotation rate and flow-rate on the residence time of the bulk lactose. ... 45 Figure 23: Measured pellets concentration for a 10 minutes continuous blending process. From left to right, the rotation rate increases from 100 rpm to 300 rpm. From up to down the bulk flow rate increases from 2 kg/h to 5 kg/h and 8 kg/h. All these experiments were performed with 30% (w/w) of pellets inside the continuous blender. ... 46 Figure 24: Measured pellets concentration for a 10 minutes continuous blending process. (a) Impeller rotation rate: 100 rpm, (b) Impeller rotation rate 300 rpm. All these experiments were performed with 5% (w/w) of pellets inside the continuous blender. ... 47 Figure 25: Relative standard deviation from a 10 minutes continuous blending experiments as a function of operation parameters flow rate and rotation rate. The black line states the RSD threshold defined by European Pharmacopoeia. ... 48
xii
List of Abbreviations
API Active pharmaceutical ingredient
AUC Area under the curve
CSTR Continuously stirred tank reactor
DIA Dynamic image analysis
FDA Food and Drug Administration
ICH International Conference on Harmonization LIF Light induced fluorescence
MCV Mean centered variance
MRT Mean residence time
NIRS Near-infrared spectroscopy
PC Principal component
PEPT Positron emission particle tracking
PFR Piston flow reactor
PLS Partial least squares regression
PVP Polyvinylpyrrolidone
RMSEC Root mean square error of calibration RMSECV Root mean square error of cross-validation RMSEP Root mean square error of prediction
RPM Revolutions per minute
RSD Relative standard deviation RTD Residence time distribution
SIMCA Soft independent modelling of class analogy
SNV Standard normal variate
1
Chapter 1 – Introduction
Blending is an always-present and essential unit operation in pharmaceutical processes. For instance, when manufacturing a solid dosage form, it is necessary to include several components apart from the active pharmaceutical ingredient (API), such as diluents, binders, disintegrants and lubricants, in order for the final pharmaceutical product to achieve functionality, stability, patient compliance, process aids, among other factors. Powder mixing is the operation for formulation homogenization and to reduce nonuniformities or gradients in bulk’s composition. Consequently, it is a critical step in the secondary manufacturing of pharmaceutical solid dosage forms, affecting directly the homogeneity of the powder mixture and thus the dose uniformity of the end product. The art of powder mixing needs a better scientific understanding to achieve the excellence in quality, efficiency and reliability of the product in order to bring a safe treatment to the patient.
The present work is an integral part of RCPE intent of developing a continuous secondary manufacturing line, i.e. for final oral dosage forms production, namely tablets. It will begin with feeding systems of API and other excipients into a hot melt extrusion-spheronization process. Thereafter, the pelletized material will be mixed with the excipients necessary for the tablet compressing process. Hence, the aim of this dissertation is to develop a process understanding of the continuous blending equipment, when using a formulation containing pellets, which will be a crucial element of the aforementioned line for drug product manufacturing. To my knowledge, continuous mixing of pharmaceutical pellets has not been described yet in literature.
More precisely, the two main goals of this dissertation are:
i. To characterize the flow behavior inside the blender, measuring residence time distribution (RTD) and studying the effect of operational conditions (material flow rate and speed of rotor blades) on parameters like hold-up, mean residence time, bulk residence time, mean centered variance and the number of blade passes; ii. To characterize the blend homogeneity and segregation tendencies using the
homogeneity index relative standard deviation (RSD), for assessing the better mixing performance.
2
1.1. Continuous manufacturing
Batch processing with laboratory testing of samples of final products (e.g. tablets) and intermediates (e.g. pellets) has been typical of pharmaceutical companies’ proceedings, while continuous manufacturing has long been adopted by other industries, like the chemical and food ones (McKenzie et al., 2006). The regulatory authorities, mainly the Food and Drug Administration (FDA) in America, have recognized that continuous processing has the potential to improve product quality and are encouraging the pharmaceutical industry to move towards more efficient and consistent processes (Chatterjee, 2012). This change in mindset is highlighted in the ICH Guidelines Q7, Q8 and Q9 and FDA Guideline for Industry – PAT.
In an end-to-end continuous pharmaceutical manufacturing process, different process steps are sequenced to form a continuous production line characterized by no accumulation of mass within the system, since input raw materials are continuously fed into the system and the processed output materials are continuously removed (at the same rate as input of raw materials), during an uninterrupted period of time (Allison et al., 2014).
There are several advantages of continuous manufacturing for the pharmaceutical industry. For instance, it allows: 1) higher production volumes; 2) reduction of waste; 3) increased yield; 4) energy savings; 5) smaller equipment compared to batch processing; 6) less operator interference without manual handling, thus improving safety (Plumb, 2005). Furthermore, continuous production equipment implies fewer scale-up issues, since the size of the production lot is defined by the factor “time”; consequently, the same equipment size can be used for development, pilot studies, clinical trials and for commercial production (Byrn et al., 2015). Continuous manufacturing is enabled by the implementation of process analytical technologies (PAT) as an integrated data acquisition system over all unit operations (FDA, 2004). PAT allows for a real-time quality control of the products being manufactured at different stages of the production line, better process mechanistic understanding (particularly important is to understand the interaction between unit operations and the propagation of changes/disturbances through the system), science-based decision-making and ensuring that sources of process variability are identified and controlled (Chatterjee, 2012; International Conference on Harmonisation, 2009). The latter translates into a higher and more consistent quality of drug final products as well as faster
production-3
to-market time, since real time release is part of the quality-by-design (QbD) approach (Fonteyne et al., 2015; McKenzie et al., 2006). Additionally, real-time rejection of small quantities of nonconforming product can be performed without sacrificing the entire batch (Byrn et al., 2015). All these benefits ultimately decrease production costs (Schaber et al., 2011). Particularly, continuous mixing allows high production capacity with more compact equipment and less solid handling such as filling and emptying of blenders (potentially reducing undesirable effects like segregation). PAT allows a better control around a well-defined steady state using on-line instrumentation at the outcoming stream, thus not disturbing the bulk during continuous mixing (Muzzio et al., 2004).
A typical continuous manufacturing line for tablet production (the most common form of solid oral dosages) consists of following unit operations and has already been implemented and reported in literature (Ervasti et al., 2015; Simonaho et al., 2016). These authors developed two different continuous setups, namely a direct compression configuration and a line comprising blending, dry granulation by roller compaction, a second blending and a tableting process. In both configurations, different ingredients are continuously added to the production system with feeders operating at a rate which is defined by the composition of the formulation. Powder transfer between unit operations can be performed with the aid of gravity or by conveyors. Albeit it was not performed in any of these two previous configurations, tablets could be also coated in a continuous coater.
In the different options for pharmaceutical secondary manufacturing, schematically illustrated in Figure 1, blending stands out as a crucial and one of the last steps where variance can be introduced, mitigated or managed (Pernenkil, 2008), thus it should be well understood and optimized.
Figure 1: Different continuous manufacturing configurations for tablets production: (a) PROMIS line described in Simonaho et al. (2016). (b) Continuous production line being developed at RCPE’s facilities. (c) Direct compression configuration.
Feeding Roller
Compaction Blending Tableting Coating Feeding
Extrusion-spheronization Blending Tableting Coating
Feeding Blending Tableting Coating
(a)
(b)
4
1.2. Continuous dry mixing
The role of continuous mixing is to reduce segregation of fluxes that are fed continuously into the system (Gao, Muzzio, & Ierapetritou, 2011). This process can be described as a combination of axial and radial mixings (Williams, 1976), as represented in Figure 2. Axial mixing is the longitudinal particle movement parallel to the passing-through direction and is important in order to smooth out fluctuations introduced by the feeding system. On the other hand, radial mixing occurs at right angles to the passing-through direction and its role is to blend the initially unmixed materials to reach the desired degree of homogeneity (Gericke, 1993; Vanarase & Muzzio, 2011). The material is mixed and the volume of material in the mixer is maintained constant by equal amounts of material being introduced by feeders and removed by axial transport along the system.
Continuous blenders are typically tubular blenders which consist of a horizontal cylinder and a bladed shaft which rotates along its central axis (Figure 2). Powder is fed in one end and the impeller moves the powder to the other end of the chamber and out of the equipment. Blending requires optimization of axial and radial movements of particles in the blender (Gericke, 1993).
The power blending mechanisms in batch systems are also present in continuous systems. For example, convective, diffusive and shear mixing occur in continuous blending systems as well (Pernenkil & Cooney, 2006). Convective mechanism refers to the motion of groups of adjacent particles within the mixture i.e. clumps motion. Diffusive mixing is the random movement of individual particles across slip planes or failure zones and on the freshly exposed surface, to ensure mixing on a fine scale. Shear mixing occurs when internal
Figure 2: Continuous convective mixing. a = axial dispersion effect, r = radial mixing effect. M = motor. Adapted from Gericke (1993).
5
blending elements induce shear in particles thereby generating velocity gradients on the powder bed (Lacey, 1954; Poux et al., 1991). All take place during mixing, but they vary in extent with the type of mixer used. Convective mixing predominates in machines utilizing a mixing element moving in a stationary container (Hickey & Ganderton, 2010) just as the blender used in the present study.
It should be emphasized the essential role of continuous powder feeders for the overall performance of the continuous manufacturing line. The tablet API content (and also other ingredients’ content) will fluctuate if there is a large variability in the inflow composition, even if the mixer and tablet press would operate perfectly (in the case of the most straightforward example of a continuous direct compression line). Hence it is necessary to ensure that the feed rate of each bulk material is controlled accurately, since powder flow is dependent the on feeder’s design (screw type, charging container configuration) and powder cohesion (Engisch & Muzzio, 2012; Hou, Dong, & Yu, 2014).
The throughput of each piece of equipment in a continuous line set-up needs to be coordinated, to avoid material accumulation or running out of it (e.g. keep mass balance). Besides that, it is important to understand the process disturbances and how they are dampened, maintained or even magnified in subsequent unit operations. A key parameter for that is the residence time distribution (RTD) of each piece of equipment (Simonaho et al., 2016). In the batch blending, all the material is inside the blender during the blending process; in contrast, a continuous blender both blends and transports the material, thus there is a certain time or time distribution that describes how long blended material stays inside the mixer. Therefore, RTD with its associated measurements (mean and variance) provide key indexes for flow behavior evaluation (Nauman, 2008).
In the pharmaceutical industry, the acceptance of a good blend is usually based on the relative standard deviation (RSD) of the concentration of the component of interest in the mixture (normally the active pharmaceutical ingredient) (FDA, 2003).
In most cases, the monitoring of a continuous blending is performed at the outlet of the equipment when the blend is forming a powder stream, by measuring the component of interest, which normally is the API (Berthiaux, Marikh, & Gatumel, 2008; Gao et al., 2011; Martínez et al., 2013; Portillo, Ierapetritou, & Muzzio, 2008; Vanarase & Muzzio, 2011).
6
1.2.1. Studies on continuous powder blending
The earliest work on continuous blending addressed the blender efficiency based on the variance reduction ratio (VRR) which corresponds to the ratio of the variance of the input stream of the blender to that of the output (Beaudry, 1948). The variance reflects the intensity of segregation of the mixture in that stream, thus the VRR (Equation 1) reflects the performance of the blender in reducing this intensity of segregation, and is defined as:
𝑉𝑅𝑅 = 𝜎𝑖2
𝜎𝑜2
(Equation 1)
where 𝜎 is the standard deviation of the concentration of the component of interest in the mixture; the subscript 𝑖 is for input and 𝑜 for output. Although this homogeneity index is not going to be applied in this work, it´s possible to understand from Equation 1 that a higher VRR corresponds to a better mixing performance of the blender, since it represents a powder with low variance at the output.
The research on continuous mixing applied to pharmaceutical industry is currently a widely studied area and most of the research has been performed in the last decade. The following paragraphs summarize the main findings reported in the continuous pharmaceutical mixing literature.
Much of the initial research on continuous blending of powders applied principles of continuous liquid mixing and the design principles based on response-stimulus experiments (Pernenkil & Cooney, 2006).
The use of non-dimensional numbers such as the Froude number has been applied to the study of powder continuous blenders. The mixing process is characterized by the Froude number, which describes the ratio of centrifugal force to gravity that act over the ingredients in the mixer (Gericke, 1993; Ottino & Khakhar, 2000). The Froude number (Fr) is calculated using the following equation:
𝐹𝑟 =𝑅𝜔2
𝑔 (Equation 2)
where 𝑅 corresponds to the radius of the impeller (m), 𝜔 is the angular velocity of the impeller (rad/s) and 𝑔 is gravity (m/s2). By calculating Fr, mixers can be classified in three
categories according to their mixing methods (Berthiaux et al., 2008; Ervasti et al., 2015; Gericke, 1993; Marikh et al., 2005): in mixers with a Froude number below 1, gravitational
7
forces are predominant and mixing is achieved by displacement and diffusion of particles; a Froude number slightly above 1 indicates fluidized motion of material inside the blender, there is a reduced friction between the particles and a fast mixing effect is achieved with low energy input; a Froude number considerably above 1 means that centrifugal forces are predominant and there is more attrition of the materials that flow inside the blender.
The powders described in the continuous blending early stage reported literature were not pharmaceutical materials. Some examples are: mixtures of sand and salt (Williams & Rahman, 1972), mixtures of sand and sugar (Harwood et al., 1975), non-pharmaceutical pellets (Sudah et al., 2002), chocolate mixture particles (Ziegler & Aguilar, 2003). From this list, the only particulate mixture that is physically similar to the one used in this study is a mix of semolina and couscous (Marikh et al., 2005) that exhibit some tendency to segregate since they have different particle sizes and are free flowing particles.
Engineering aspects of continuous dry powder mixing have been quite extensively studied, namely the influence of different process parameters. However, so far, studies analyzing the effect of material parameters, as particle size, shape, density and cohesion are fewer.
The study of continuous blending processes using pharmaceutical powders has been assessed only in recent years and until the review of Pernenkil & Cooney (2006) pharmaceutical mixes have not been reported in continuous blenders.
Table 1 resumes some of the most important work carried out in the field of continuous pharmaceutical blending.
8
Table 1: Significant conclusions from investigations on continuous pharmaceutical blending reported in the literature and corresponding powder mixtures, equipments and monitoring techniques handled. References are ordered by date. Abbreviations: APAP – acetaminophen; OTC – over-the-counter drug; MCC – Micro-crystalline cellulose; HPMC – hydroxypropyl methylcellulose; MgSt – magnesium stearate; NIRS – Near infrared spectroscopy; LIF – light induced fluorescence; PEPT – Positron Emission Particle Tracking.
Powder mixture
components Blender type
Monitoring
technique Objectives Key conclusions References
Caffeine APAP Lactose MCC MgSt Zigzag continuous blender and double helical ribbon blender
NIRS LIF
Pulse stimulus response experiments and RTD analysis to study the effect of rotation rate and size, shape and cohesion of powders in flow behavior and final homogeneity.
Increase in particle size and decrease in cohesive forces increased the axial dispersion coefficient and the blender performance.
(Pernenkil, 2008)
Lactose APAP
GEA mixer
(model not disclosed)
Off-line NIRS Study the effects of mixer angle, agitation speed, number and angle of blades in the residence time and blend homogeneity using pulse injection experiments.
The upward processing angle and lower impeller rotation rate (16 rpm) resulted in better homoge-neity, corresponding to a longer residence time inside the blender.
(Portillo et al., 2008)
Formulation of a OTC drug contain-ning 3 actives for a total of 9 ingredients
Gericke GCM 500® Sampling on
conveyor belt + HPLC
Compare the flow behavior and blend homogeneity of 2 types of stirrer under different rotational speeds and feeding rates, using VRR and industrial standards (coefficient of variation).
The mobile A gave better mixtu-res than mobile B. An excessive rotational speed led to worse quality blends.
(Berthiaux et al., 2008; Marikh, et al., 2008)
Edible Lactose Fast Flo Lactose
GEA mixer
(model not disclosed)
PEPT Examine the effect of impeller rotation rate, flow rate and pow-der cohesion on the particle tra-jectory, dispersive axial transport coefficient and residence time.
Particles move along the axial length at the same pace. No dead zones exist. Residence time showed an exponential dependen-ce on axial dispersion.
(Portillo et al., 2010)
MCC Avicel PH102 Gericke GCM 250® On-line NIRS Real-time determination of API
concentration on the outcoming
This was the first application of NIRS and multivariate data
9
Micronized APAP, Silicon dioxide MgSt
blends, using partial least squares (PLS) calibration models.
analysis for real time monitoring of a continuous pharmaceutical mixing process.
APAP
MCC Avicel PH200
Gericke GCM 250® Off-line NIRS Characterize the effects of 2 feed
rates, 2 blade configurations and 4 blade speeds on mixing perfor-mance based on a RTD-RSD correlation.
Moderate blade speed (100–160 rpm) and alternate blade configu-ration facilitate mixing. Change of feed rate showed no significant influence to the output variance.
(Gao et al., 2011)
APAP
MCC Avicel PH200
Gericke GCM 250® Off-line NIRS Study the mixing performance and
flow behavior using RTD, mean residence time, mean centered variance, hold-up, number of blade passes and RSD measure-ments, under different feed rates, rotation rates and blade confi-gurations.
Intermediate rotation rates showed the best mixing homoge-neity, corresponding to low mean residence times. This was the most significant process parameter affecting mixing performance.
(Vanarase & Muzzio, 2011) Active ingredient Granules MgSt Hosokawa Micron Modulomix®
In-line NIRS Development of a PLS model for the in-line API quantification at the blender outlet, under different flow rates and rotation rates. Study which parameters interfere with NIR results’ accuracy.
The PLS model showed to be sensitive to variations on feeding rate (less material flowing over the NIR probe). Lower rotation rates revealed better blends and a more stable powder presentation to the NIR probe.
10
In general, the effects of the operating factors are complicated and difficult to be predicted. Operations empirically optimized in one mixer may not be directly utilized in other mixers. For example, some studies suggested that better mixing occurs when RTD is broader (Marikh et al., 2006), while inverse findings were reported on Portillo et al. (2008), in which the most dispersed RTD corresponded to the worst mixing.
1.2.2. Monitoring techniques applied to continuous mixing
process
Continuous manufacturing, and in particular continuous blending, can benefit from an on-line process monitoring technique at the outlet of the blender. As a result, sampling and sample analysis is eliminated, as well as sample preparation and sampling bias associated with the disruption and removal of material from the blender (McKenzie et al., 2006). Noninvasive techniques that do not disturb the powder during monitoring are very valuable since they analyze powder properties without affecting the operation of the blender and have an immense potential for being incorporated into a control system loop of continuous blending systems in a manufacturing setup (Pernenkil & Cooney, 2006).
The PEPT (positron emission particle tracking) technique offers the advantage of visualizing the dynamics while blending is in progress (Pernenkil & Cooney, 2006). In PEPT, the motion of a single positron-emitting particle is followed within the bulk flow in real-time. Spatial coordinates of the tracer particle are tracked as a function of time. It’s possible to obtain quiver plots (displaying velocity vectors as arrows) of the axial and radial particles’ trajectory during their travel along the blender (Laurent, Bridgwater, & Parker, 2000, 2002; Portillo et al., 2010).
Near-infrared spectrometry (NIRS) and light induced fluorescence (LIF) technologies have also been used as process analytical tools in a continuous mixer.
The NIRS method is based on the absorption of light in the wavelength region between 800 and 2500 nm (respectively 12821-4000 cm-1) due to vibrations of molecular functional groups in the sample, mainly –CH, –OH and –NH bonds (Burns & Ciurczak, 2007). The no-need of sample preparation and the acquisition of several spectra in seconds by a noninvasive mode are some of the advantages that contributed to the wide application of NIRS as a PAT tool. In addition, both chemical and physical information from NIR spectra are obtained. There is a need for multivariate data analysis and chemometric methods to pretreat NIR spectra and extract relevant information, since they
11
are difficult to interpret. A linear relationship is often observed between the analyte concentration and the changes in spectra (Blanco et al., 2012).
Most of the studies using NIRS applied to continuous blending processes consisted of off-line monitoring of API concentration by retrieving samples at the outlet of the equipment followed by static spectra acquisition (Gao, Vanarase, et al., 2011; Portillo et al., 2008; Vanarase & Muzzio, 2011). Vanarase et al. (2010) described the first application of NIRS in on-line monitoring of a continuous mixing process. It focused on the development of a multivariate calibration model for real time predicting the API concentration in the out-flowing powder blend. A similar work was done by Martínez et al. (2013) and both reported NIRS as an effective PAT tool for real-time monitoring of a continuous blending process. In the recently developed continuous manufacturing PROMIS-line for tablets production (Simonaho et al., 2016) the monitoring of the blend homogeneity was done with in-line NIR.
Pernenkil (2008) used not only in-line NIRS but also LIF to study a continuous mixing process. The latter technique involves samples irradiation at a suitable wavelength for electrons excitation and evaluating the radiation emission at another wavelength (fluorescence). At low enough concentrations of the fluorescing molecule, the intensity of the emitted radiation is proportional to the concentration of that molecule in the blend (Lai et al., 2001).
No applications of Raman spectroscopy in continuous mixing were reported so far.
1.3. Pellets in pharmaceutical industry
In the pharmaceutical context, pellets can be defined as small, free-flowing, nearly spherical particles of a diameter between 0.5 and 1.5 mm, manufactured by the agglomeration of fine powders, typically drug substances and excipients (Mehta, Rekhi, & Parikh, 2005). Commonly, a hot melt extrusion (HME) process is used to manufacture them. In a typical HME process the solid materials melt and are mixed in the so-called plastification zone of the extruder. Next, the melt is forced into an extrusion die and solidifies at the outlet of the equipment. For the obtained strands to get a spherical shape, a hot-die face pelletizing unit or a spheronizer can be coupled to the outlet of the extruder (Treffer et al., 2014).
The usage of pellets in oral formulations is of greatest interest, since it is possible to increase poorly soluble drugs’ bioavailability (Breitenbach, 2002) by forming solid
12
dispersions and solid solutions or to achieve sustained-release behavior (De Brabander, Vervaet, & Remon, 2003; Follonier, Doelker, & Cole, 1995). It also offers the possibility to administer incompatible drugs due to the multiparticulate system (Abdul, Chandewar, & Jaiswal, 2010). Pellets can be used as intermediates for capsule filling or tablet compaction and they have a spherical core that contains or is coated with the API, having one or more protective layers to control drug release (Jawahar & Anilbhai, 2012). The use of pellets also introduces some relevant advantages in the manufacturing process perspective. With highly uniform and spherical pellets, dosing precision increases as well as flowability; besides that, tableting of pellets results in reduction of dust (Treffer et al., 2014).
1.3.1. Segregation problems for pellets
It was mentioned that continuous manufacturing reduces powder segregation since the powder blends storage and handling is eliminated. However, usually this major problem remains when mixing formulations comprising pellets together with small particle sized excipients, due to their free-flowing property and natural tendency for size segregation.
Danckwerts (1952) proposed that there are two components of mixture segregation, namely the intensity and the scale. The intensity of segregation measures the spread of the concentration of the component of interest in the mixture. Alternatively, the scale of segregation reflects the state of subdivision into particle clumps. Evidently, the function of a blender is to reduce both the scale and intensity of segregation (Poux et al., 1991).
Small differences in either size, density or cohesive properties of materials in question are the most common causes for the segregating behavior (Ottino & Khakhar, 2000) and they are present in the kind of powders used in the present study. Besides this, Ottino & Khakhar consider some other scenarios: the circular or noncircular container’s shape, the mixing equipment fill level and the materials similarity in shape.
1.3.2. Multiple-unit pellet system (MUPS)
Tablets containing pellets as a constituent are already a reality in the pharmaceutical industry. A tablet comprising a number of discrete particles such as pellets with one or more APIs being entrapped in or layered around cores is considered to be a multiple-unit
13
dosage form and more properly called multiple-unit pellet system (MUPS) (Reddy et al., 2011).
A new MUPS tablet production line has been developed by GEA to solve segregation problems and to eliminate production inefficiencies related with the damage of pellets’ structure during compression (Vogeleer, 2014).
The aim of this dissertation is to contribute to the development of a continuous manufacturing line for tablets containing pellets by studying the mixing performance of the continuous blender for these formulations.
The dissertation is organized as follows. Materials, mixing equipment and feeder units used to study the continuous mixing process are described in Chapter 2. The work on the development of an analytical method to monitor the pellet concentration at the outlet of the continuous blender is presented in Chapter 3. The experimental conditions, setup, measurement and calculation of flow behavior and homogeneity indicators to study the continuous mixing process are described in Chapter 4. The presentation and discussion of results (Chapter 5) is divided into two parts. The first part focuses on the continuous blender characterization using RTDs and powder flow behavior indicators like hold-up, mean and bulk residence time, mean centered variance and number of blade passes as a function of different process parameters. The second part focuses on the effect of different process parameters on the blend homogeneity. Summary and conclusions are presented in Chapter 6.
14
Chapter 2 – Materials and Continuous Mixing Equipment
2.1. Mixture considered
The mixture under consideration in this study contains two components with different particle sizes: pellets and lactose monohydrate. The use of two ingredients with particle size distributions (PSD) that do not overlap is expected to facilitate the identification and quantification of each ingredient using on-line and off-line measurement tools that characterize the PSD of a sample. Therefore, one can easily identify the chemical composition based on size analysis.
The pellets used in all experiments are made from polyvinylpyrrolidone (PVP) polymer (Kollidon®, BASF, Germany) and were manufactured at RCPE by hot-melt extrusion (HME), followed by spheronization. Therefore, they present an approximately spherical shape as shown in Figure 3. These pellets don’t contain any active pharmaceutical ingredient (API) in their composition and are characterized by this particle size distribution: d10=793.66 µm; d50=1318.04 µm; d90=1662.61 µm. Pellets’ true
density is 1.1841 g/cm3 and was measured using a helium pycnometer (AccuPyc® II 1340, Micromeritics).
The lactose monohydrate used was supplied by Meggle Pharma under the brand name Tablettose® 70 and is especially designed for direct-compression processes. It is manufactured by a continuous spray agglomeration process and the resulting lactose has
a narrow particle size distribution: d10=111.82 µm; d50=207.45 µm; d90=368.82 µm. The
detailed particle size distribution information for each material can be found in Appendix 1 and 2 and it was measured using the Image Analysis Sensor QICPIC (Sympatec, Germany). Lactose’s true density is 1.5422 g/cm3 and was measured using the same helium pycnometer (AccuPyc® II 1340, Micromeritics).
15
The two materials comprising this binary mixture are considered to be non-cohesive and free-flowing powders. When pouring pellets onto a flat horizontal surface they rolled on it and spread over a large area, not accumulating in a pile (angle of repose is 0). Thus, these pellets have great flowing properties because of their nearly spherical shape and smooth surface. Lactose’s technical flowability values reported by the supplier (MEGGLE, 2014) are in Table 2. It is possible to deduce its good/fair flowability feature, by comparing the angle of repose, Hausner ratio and Carr’s index values with the defined ranges present in the Powder Flow chapter of the European Pharmacopoeia (2011).
Table 2: Flowability values of Lactose Tablettose 70® grade. Adapted from MEGGLE (2014).
2.2. Continuous mixing equipment
The continuous blender apparatus used in this study is a Modulomix (manufactured by Hosokawa Micron B.V., The Netherlands) and is shown in Figure 4.
This blender falls into the category of convective mixers. A convective mixer design consists of a fixed internal rotating impeller containing paddles within a static
Angle of repose (o) Bulk density (g/L) Tapped density (g/L) Hausner ratio Carr’s index (%) 31 530 640 1.21 17.19
I1
I2
I3
O
Figure 4: Details of the continuous mixer impeller design. I1, I2 and I3 are the blender’s inlets and O is the outlet.
16
chamber (Harnby, Edwards, & Nienow, 1992). Due to the action of the impeller, particles are moved from one location to another within the bulk of the mixture.
The mixer has a 1.1 kW motor power and the rotation rates range from 100 rpm at a low speed to 1540 rpm at a high speed. The continuous dry powder mixer consists of a horizontal cylindrical process chamber in which a cylindrical and horizontal agitator with paddles is rotating (refer to Figure 4).
A detailed description of the mixer is as follows: The chamber is 30 cm long and its diameter is 13.5 cm. As the material enters the mixer, it crosses the pathway of 14 fixed blades, where 10 of them are flat rectangular blades (1.5 cm x 5 cm) and distance 3 cm from the impeller. The other 4 blades (2 immediately below the first inlet and the 2 in the other extremity of the blender) have a different shape, with the purpose of scrapping off the powder that could stick to the right and left walls. The paddles are fitted on the shaft in a fixed angle and are rotating at a fixed distance from the wall of the process chamber. The gap between the blender wall and the blades is less than 3 millimeters. The screw placed at the center of the frame is cylindrical with 30 cm long and 4 cm diameter. The angle of the blades with the horizontal shaft is 30 degrees.
The first inlet port (I1) was used for feeding both pellets and lactose and has a 5 cm diameter. The second (I2) and third inlet ports (I3, directly above the outlet O) were sealed during all experiments. The outlet of the mixer consists of a vertical open gate with a 5 cm diameter. The distance between the inlet I1 and the outlet is approximately 20 cm and corresponds to the total pathlength travelled by powders inside the chamber.
This mixer was developed to achieve powder mixing with short average residence times, as reported by the supplier (Hosokawa Micron, 2014).
In this study three different mixer speeds will be used: 100 rpm, 200 rpm and 300 rpm, which correspond to a Fr number of 0.7, 2.9 and 6.5, respectively.
2.3. Feeding systems
In the continuous mixing system used in this study, pellets and lactose were fed using two loss-in-weight (LIW) feeders, model SFS-24 manufactured by Coperion K-Tron (Figure 5a). Both materials were fed directly into the mixer inlet I1. The flow rate range of this model varies between 0.001 and 10 kg/h. The screw used was a twin concave design (Figure 5b).
17
LIW feeders constantly monitor the material’s weight per unit time to achieve and maintain the predetermined feed rate. This kind of feeders consist of a hopper, weight-sensing device (load cell), feeding screw and controller. The actual rate of weight loss is compared to the set point and the feeder speed increases or decreases to compensate those fluctuations. Due to this control, LIW feeding is more accurate than volumetric feeding, in which the screw rotates at constant speed to discharge material at a predetermined volume-per-revolution rate from the hopper to the process (Nowak, 2010).
Thus, before each mixing run the desired feeding rate was set in the control panel.
Figure 5: (a) Loss-in-weight feeder model K-SFS-24 by Coperion K-Tron. (b) Twin concave screw design, used to fed the materials in the present study. Retrieved from http://www.ktron.com/process-equipment/feeders/feeding-equipment/micro-compact-feeders.cfm
(b) (a)
18
Chapter 3 – Development of an analytical method to monitor
the pellet concentration at the outlet of the continuous blender
3.1. On-line method using near-infrared spectroscopy (NIRS)
Near-infrared spectroscopy was the first chosen PAT tool to build a calibration model to predict the pellet concentration at the outlet of the continuous blender and further on, to monitor the continuous mixing process. The focus on pellets as tracer material is because normally they carry the API in a final dosage form containing this multiparticulate system. In this current work, pellets are only placebo.The choice of using NIRS is due to the well-known advantages of this technique, namely its noninvasive features, quick measurements and without the need of sample preparation. In addition, this technique has already been applied and reported as accurate to monitor the drug concentration and thus predicting the blend homogeneity in continuous mixing processes (Martínez et al., 2013; Vanarase et al., 2010).
The characteristics of the NIR spectrum require the use of softwares for multivariate data analysis to establish a quantitative relationship between the spectrum and the concentration of pellets in the analyzed sample. Therefore, the first stage in developing a NIRS procedure is building a calibration model. Here, a calibration method using partial least-squares (PLS) regression is applied.
PLS uses eigenvectors and eigenvalues to perform a decomposition of the spectral and correspondent concentration information simultaneously, to determine the most important variations in the data. In other words, PLS stablishes a linear combination between two matrices: the spectral data, in which the absorbance value for each wavelength represents one X variable; and the pellet concentration in each calibration sample, the Y variable. Thus, the dimensionality of the problem, initially with hundreds of X variables, is reduced to few factors, called latent variables. Each latent variable is a linear combination of spectral data. PLS eliminates variations in spectra that do not add useful information in establishing a calibration (Blanco et al., 2012; Lavine, 2000; Roggo et al., 2007).
3.1.1. Preparation of calibration samples
The calibration samples for the development of a quantitative model consisted in laboratory mixing and individual spectra acquisition. Eight calibration samples were
19
prepared in a tubular blender (Turbula® T2F Maschinenfabrik Willy A. Bachofen AG,
Switzerland), each one mixed for 5 minutes at 32 rpm. In order for the calibration model to be useful when monitoring a continuous mixing process, mainly when dealing with RTD experiments within which the tracer (pellets) concentration in the binary mixture can vary from 0 to high values, the calibration samples were chosen to span a wide content range. Thus, the calibration samples consisted of 100 g of blends where pellets varied in concentration from 2, 5, 10, 20, 30, 40, 50 and 60% (w/w) diluted with lactose.
3.1.2. NIR Instrumentation, data collection and processing
NIR spectra were collected with the spectrometer SentroPAT FO (Sentronic GmbH, Germany), which is a diode array spectrometer. Spectra acquisition was done in diffuse reflectance mode over the wavelength range of 1100 – 2200 nm with a resolution value of 2 nm, which means that absorbance values were recorded at 2 nm intervals. Each spectrum is obtained through the average of 62 scans and the integration time is 0.016 seconds per spectrum, corresponding to the length of time when the detector in the spectrometer can capture light. As a result, approximately 1 spectrum was taken per second. The reference used has an absorbance value of zero and it reflects the light completely.
The software interface allows the bad spectra rejection. More specifically, spectra were taken with the Outlier Check Enabled parameter set ON, with a threshold value of 0.7. This means that spectra with absorbance values higher than 0.7 are not considered (it would correspond to low reflectance values, hence low NIR signal).
The probe consisted in a SentroProbe DR LS with a measurement spot of 5 mm diameter, approximately. The software SentroSuite 2.4 was used to control the spectrometer and to store the data from the calibration runs. NIR equipment is the same used by Wahl et al. (2013, 2014).
With the collected spectra, a chemometric model was built in SIMCA 13 (Umetrics, Sweden), where a pretreatment with Standard Normal Variate (SNV) followed by 2nd derivative was applied.
SNV is a scatter-corrective pre-processing method designed to reduce the physical variability between samples due to scatter and to minimize the spectral contribution of differences in particle size, which in fact occurs between pellets and lactose. It also adjusts the baseline shifts between samples. The transformation is applied to each spectrum
20
individually by subtracting the spectrum mean and scaling with the spectrum standard deviation (Barnes, Dhanoa, & Lister, 1989).
Two kinds of cautions were taken when applying the pre-processing. At first, scatter correction (SNV) should always be performed prior to differentiation (2nd derivative) because the first one is designed for correction of raw spectrum and have never been thought of as a correction to a differentiated or baseline-corrected spectrum (Rinnan, Berg, & Engelsen, 2009). Since SNV does not involve a least squares fitting in their parameter estimation, they can be sensitive to noisy entries in the spectrum, so all the noise should be eliminated from the raw spectra before doing the SNV correction. In all the obtained spectra the noisy regions under 1150 nm and above 2120 nm were excluded before applying the pre-treatment.
On a first analysis, it may seem more appropriate to include in the model the information concerning the different particle size of the mixture. For this purpose, spectra should not be pretreated with SNV, which removes this physical effect. However, in all the performed experiences, as explained latter, there are differences in sample presentation, i.e., the quantity of powder passing in front of the NIR probe is not always the same. Thus, the light path length varies during the analysis of a given sample and due to that, there are scatter effects in the resulting spectra, which are removed by SNV.
Concerning the treatment with second derivative, it results in the removal of both baseline offset differences between spectra and differences in baseline slopes between spectra (Bakeev, 2005).
3.1.3. Experimental set-up for acquisition of NIR spectra
It should be ensured that the quantitative NIR model is produced with spectral data obtained under the same or very similar measurement conditions found in the process to be monitored (Blanco et al., 2012; Fonteyne et al., 2015). In this study, the monitoring at the outlet of the continuous blending equipment consists in measuring moving solids. Therefore, the calibration samples should be analyzed under the same moving conditions. However, it would be difficult to obtain calibration spectral data directly in the mixing process because it is very difficult to retrieve the same sample portion measured by the NIR probe at the outlet of the blender and send it to the laboratory to provide the reference data (corresponding pellets concentration). Alternatively, the process sample transporting system was simulated in the laboratory i.e. the two experiments carried out for acquiring
21
off-line NIR spectra from calibration samples consisted of replicating the possible ways to collect the on-line spectra at the blender outlet. Several spectra were acquired from each sample.
The first one consisted of making the calibration mixtures flow through a funnel (Figure 6a) which will be called funnel experiment. The NIR probe is focused onto the powder stream at the outlet of the funnel. An identical funnel would also be attached at the outlet of the blender to stream the powder in front of the NIR probe. The second setup for acquisition of NIR calibration spectra was slide the calibration mixes down on an inclined chute (Figure 6b), in order to reproduce, as faithfully as possible, the powder flow conditions in the outlet of the continuous blender, from now on mentioned as chute
experiment. This type of chute could be placed at the outlet of the blender if the analytical
method proves successful. The criteria to choose the chute inclination angle was visual analysis where powders exhibited a good slip behavior.
One of the challenges of measuring powders while they are moving is the different physical presentation of the sample to the probe, hence interfering with the acquisition of reliable results. That´s why the aforementioned measurements were taken with the parameter Outlier Check Enabled set as TRUE, which rejects spectra where the sample presentation is poor (i.e. there’s no powder or only scarce is passing in front of the probe). In all of the previously described situations, samples were poured by hand. Both in the chute experiment and funnel experiment efforts were made to drop each sample under a constant flow rate and at similar velocities between different samples. Since one spectrum was taken per second, if the sample takes 5 seconds flowing through the Figure 6: Experimental setup for off-line NIR spectra acquisition: (a) Funnel experiment, (b) Chute experiment, (c) Rotating plate experiment.