Experimental Results Analysis of the Energy Conversion Efficiency of
Thermoelectric Generators
Patrizia Richner
1, Pedro Dinis Gaspar
1, Luís Carrilho Gonçalves
1and David Almeida
11 Electromechanical Engineering Department – Engineering Faculty
University of Beira Interior
Edifício 1 das Engenharias, Calçada do Lameiro, 6201-001 Covilhã (Portugal)
Phone/Fax number: +351912761181, +351275329759/930, e-mail: [email protected], [email protected], [email protected]
Abstract.
Thermoelectric generators can be used for conversion of heat to electricity wherever a temperature difference exists. Such differences of temperatures are available in many applications, often without being used. In the case of photovoltaic panels the temperature difference is in the order of 50 ºC.This study experimentally examines the performance of two commercial thermoelectric generators. The resistance, open circuit voltage and short circuit current are measured. The maximum power output and the overall conversion efficiency are calculated and the results of the two generators compared. Infrared thermographic pictures are taken in order to evaluate the temperature distribution over the generator induced by the experimental setup.
It is shown that the power output as well as the conversion efficiency at temperature difference smaller than 50 ºC is very low and therefore the implementation of thermoelectric generators in combination with photovoltaic panels might not be economic.
Key words
Thermoelectric generator, Renewable Energy, Electricity Conversion Efficiency, Infrared pictures
1. Introduction
Thermoelectric generators (TEG) make use of the Seebeck effect, where a temperature difference induces a voltage [1-3]. They have been used for many years in space applications, with radio-isotopes as the heat source, because of their reliability and robustness. When it comes to terrestrial applications, electricity generation out of waste heat or geothermal energy can be named [4-8]. Pilot projects are also being conducted by using the temperature difference existing between the ocean’s surface and greater depths [9].
Although TEGs have very low efficiencies (5 to 10 % in the above mentioned applications), their usage makes sense where the heat source is freely available and would otherwise be lost to the environment. One such example is a photovoltaic (PV) panel, where only a certain bandwidth of the incident light is transformed to
electricity. The absorbed infrared radiation in particular only heats the upper side of the panels without contributing to the PV conversion efficiency. This leads to a temperature difference between the upper and the lower side of the photovoltaic panel which can be used with thermoelectric generators. The temperature difference is however rather small, typically in the order of 50 ºC on a hot summer day with a clear sky in Portugal. Besides providing an additional method to generate electrical energy, the use of TEGs in PV panels helps improving the photovoltaic efficiency. This condition is related with the PV efficiency decrease with temperature.
If this combination of photovoltaic cells and thermoelectric generators is to be used in a larger scale, commercially available TEGs must be used. Commercial TEGs however are usually designed for higher temperature difference with a main intended purpose in the field of waste heat from high temperature processes. Two modules from different suppliers are tested in this study in order to assess the behaviour and conversion efficiency of TEGs at temperature difference below 50 ºC.
During the test series both the hot side temperature and the cold side temperature as well as the short circuit current and the open circuit voltage are measured. Further the measured internal resistance of the modules is compared to the values provided by the suppliers. To complement the experimental results, infrared thermographic pictures were taken in order to evaluate the temperature distribution over the TEG surface during the measurement process.
The models tested are a TEG127-50A from EVERREDtronics Ltd. [10] and a HZ-20 from Hi-Z Technology Inc. [11]. The former is referred to as TEG 1, the latter as TEG 2.
2. Experimental Setup
The experimental setup for thermoelectric generator parameter measurements is shown in Fig. 1. Resistance, voltage and current are measured by a FLUKE 45 Dual Display Multimeter. These measurements provide the resistance, open circuit voltage and short circuit current values. The TEG is mounted on an aluminium plate which serves as a heating device. The plate is heated by hot water from a water reservoir with controllable water temperature. The reservoir is equipped with a .P SELECTA Unitronic S 320-100 heating coil and pump. The water is pumped through ducts to the aluminium plate where it is led through a continuous line cut into the metal. This procedure guarantees a homogeneous temperature distribution on the contact area between the heating plate and the TEG.
Fig. 1. Experimental Setup for thermoelectric generator
measurements.
The other side of the TEG is cooled by cold air coming out of an Air Conditioning Laboratory Unit A573 by P.A. Hilton Ltd. The temperature on both the hot and the cold sides of the TEG is measured with two thermocouples. The values are read by a Digi-Sense Thermocouple Thermometer from Cole Parmer.
Fig. 2. TEG mounted on heating plate with protective
surrounding and camera
The infrared thermographic pictures are taken with a Thermo Tracer TH1104 by NEC San-ei Instruments Ltd. In order to minimize environmental light scattering, a protective black carton surrounding the TEG and the heating plate was constructed, as shown on Fig. 2.
In order to be able to transform the optical reading into a quantitative temperature scale, the emissivity of the surface of each TEG is determined by adjusting the emissivity of the reading such that the temperature scale of the camera fits the temperature reading of the thermocouple. One must take into account however, that the temperature scale on the infrared pictures can only be applied to the TEGs themselves and not to the heating plate and the surroundings, since they have different emissivities.
A total of five measurement series for each TEG were performed. In every series the temperature of the heating plate is varied from room temperature up to approximately 70 °C, which corresponds to the temperature range that is to be expected on photovoltaic panels exposed to direct solar radiation.
In every series the open circuit voltage and the short circuit current is obtained for about 30 different hot side temperatures. At the same time the cold side temperature is measured such that the temperature difference between the hot and the cold side of the TEG can be calculated. The resistance of the TEG can only be obtained when there is no temperature difference over the TEG for the following reason: Digital multimeters measure the resistance of a system by applying a small constant current to the system. When the system itself produces a current – as it is the case for every generator – the obtained values are not correct and therefore unusable. Because of that, the resistances of the two TEGs are obtained at room temperature before applying any temperature difference. The resistance is assumed to be constant over the temperature range examined in this study.
3. Results
The geometry and resistance properties of the two TEGs can be seen in table I. All information except for the internal resistance and the emissivity is taken from the suppliers’ websites [10, 11]. Table I. – Properties TEG 1 TEG 2 Length 50 mm 75 mm Width 50 mm 75 mm Thickness 3.6 mm 5.08 mm P-N-Couples 127 71 Internal Resistance 0.84 Ω 0.42 Ω Emissivity 0.88 0.90
Fig. 3 displays the infrared picture of TEG 1. Also clearly visible is the heating plate which is considerably bigger than TEG 1 and at the upper and lower edges of the TEG the rubber bands with which the TEG is fixed on the heating plate. Due to the different emissivities of the rubber bands and the heating plate the temperature readings are only applicable to the TEG itself.
Fig. 3. Infrared picture of TEG 1 mounted on hot aluminium plate, temperature scale in °C, only applicable for TEG itself, not for aluminium plate or surroundings
Fig. 4. Infrared picture of TEG 2 mounted on hot aluminium
plate, temperature scale in °C, only applicable for TEG itself, not for aluminium plate or surroundings
A temperature difference of approximately 3 ºC exists between the upper and the lower edge of the TEG. This difference can be explained by the design of the heating plate: the hot water enters at the bottom of the heating plate and has therefore the biggest effect on the lower part of the TEG. Since the temperature readings for the voltage and current measurements are taken by a thermocouple in the middle of the TEG, these readings correspond to an average temperature value.
Fig. 4 shows the infrared picture of TEG 2. In this case, apart from the TEG only the edges of the heating plate are visible and also the two rubber bands cannot be seen as clearly as in Fig. 3.
The temperature difference over TEG 2 has the same structure as the one for TEG 1. Due to the bigger extensions of the TEG the maximum temperature difference between the top and the bottom of the TEG is 5 ºC. Nevertheless the approximation of the average reading by the thermocouple in the middle of the TEG still holds.
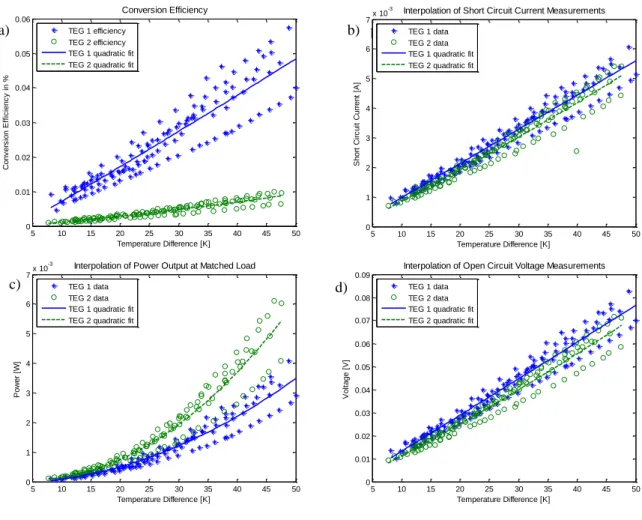
As can be seen in Fig. 5 the temperature differences of the measurement series vary between 7 ºC and 50 ºC. The open circuit voltage varies from 0.01 to 0.09 V and the short circuit current lies within 1 and 6 mA.
Least square optimized quadratic fits are calculated for each of the graphs in Fig. 5. As can be seen in Fig. 5a and 5b as well as from the formulas in the legend to Fig. 5, the approximations for current and voltage are nearly linear.
The open circuit voltage is based on the following formula, where U is the voltage, α is the Seebeck coefficient and ∆T the temperature difference between the hot and the cold side of the TEG:
(1)
Assuming that the Seebeck coefficient is constant over the temperature range of 50 ºC, the correlation between the temperature and the voltage must be linear. The current can be calculated by the well-known Ohm’s law:
(2)
If the resistance is assumed to remain constant over the examined temperature range, the current-temperature correlation must be linear as well.
The power output at matched load corresponds to the power obtained when the external load equals the internal load of the generator.
(3)
In contrast to Fig. 5a and 5b where one can hardly see a difference between the two generators, in Fig. 5c TEG 2 clearly shows a better performance than TEG 1. This is only due to the lower internal resistance of TEG 2, since the two voltage curves are almost identical. It is shown that power output is very small for these temperature difference values, reaching 5 mW for a 45 ºC temperature difference on TEG 2.
The conversion efficiency is defined as the electrical Power output over the heat flux through the entire TEG surface. Again ∆T corresponds to the temperature difference between the hot and the cold side of the TEG,
A is the TEG area and h is the overall heat transfer
coefficient.
(4)
The heat transfer coefficient is calculated with the help of the thermal conductivity of the materials of the thermoelectric generators. In the case of TEG 2, the supplier provides a thermal conductivity of 2.4 Wm-1 K-1 at design temperature of 230 °C on the hot side and 30 °C on the cold side [11]. The heat transfer coefficient is consequently calculated by dividing the thermal conductivity by the thickness of TEG 2.
T
U
I
R
U
int 22 R
U
P
h
A
T
P
Q
P
Fig. 5. Measurements of TEG 1 (stars) and TEG 2 (circles), each plot with least square quadratic fittings, continuous line for TEG 1, dashed for TEG 2.
a) Open circuit voltage, TEG 1: y = 0.0016x - 0.0024, TEG 2: y = 0.0013x - 0.0020.
b) Short circuit current, TEG 1: y = 10-3(0.1151x - 0.1751), TEG 2: y=10-3(0.0002x2 + 0.0987x - 0.1620).
c) Power output at matched load (external load = internal load), TEG 1: y = 10-4(0.0143x2 - 0.0102x - 0.4819),
TEG 2: y = 10-3(0.0029x2 - 0.0282x + 0.1383).
d) Heat to electricity conversion efficiency, normalized per area, TEG 1: y = 10-2(0.0001x2 + 0.098x - 0.2756),
TEG 2: y = 10-3(0.0011x2 + 0.1410x - 0.4033)
Since TEG 1 has an epoxy sealing, the supplier could not provide the thermal conductivity for the entire TEG but only for the thermoelectric materials used. Therefore a combination of the thermal conductivity of thermoelectric materials [10] and a typical thermal conductivity of an epoxy [12] is used. In both cases the most conservative values for the calculation of the efficiency are applied: 0.21 Wm-1 K-1 for the epoxy and 1900 Wm-1 K-1 for the thermoelectric materials.
The overall heat transfer coefficient is then calculated with the following formula, taking into account the thickness d1 of 0.9 mm of each epoxy layer and the
thickness d2 of 1.8 mm of the thermoelectric material
layer:
(5)
In Fig. 5d one can see that TEG 1 has clearly a better conversion efficiency in the examined temperature range although its maximum power output is actually smaller
than the one of TEG 2. This is mainly due to the smaller area and the smaller heat flux of TEG 1.
As final remarks, can be stated that the conversion efficiency shown in Fig. 5d is very low, but since the energy source is freely available, the conversion efficiency is in this case of secondary importance. It must be pointed out that the conversion efficiency will be higher if the exergetic content of the energy input is taken into account.
With the use of thermoelectric generators the overall efficiency of photovoltaic panels can be increased. Considering only the energy conversion increase, this efficiency increase however is very small, as can be seen in the power output graph in Fig. 5c. It is therefore questionable, whether the addition of TEGs in PV panels makes economically sense. It requires an experimental setup where the thermoelectric generator is set on a PV panel and energy conversion parameters from both devices are measured.
From the economical point of view one must also consider that there exists a huge discrepancy between the costs of thermoelectric generators from different
b) 1 2 1 1
2
thermo epox TEGd
d
h
Sh o rt C ir c u it C u rr e n t 5 10 15 20 25 30 35 40 45 50 0 1 2 3 4 5 6 7x 10⁻³ Interpolation of Short Circuit Current Measurements
S h o rt C ir c u it C u rr e n t [A ] Temperature Difference [K] TEG 1 data TEG 2 data TEG 1 quadratic fit TEG 2 quadratic fit
5 10 15 20 25 30 35 40 45 50 0 0.01 0.02 0.03 0.04 0.05 0.06 0.07 0.08 0.09
Interpolation of Open Circuit Voltage Measurements
V o lt a g e [ V ] Temperature Difference [K] TEG 1 data TEG 2 data TEG 1 quadratic fit TEG 2 quadratic fit
5 10 15 20 25 30 35 40 45 50 0 0.01 0.02 0.03 0.04 0.05 0.06 Conversion Efficiency C o n v e rs io n E ff ic ie n c y i n % Temperature Difference [K] TEG 1 efficiency TEG 2 efficiency TEG 1 quadratic fit TEG 2 quadratic fit
5 10 15 20 25 30 35 40 45 50 0 1 2 3 4 5 6 7x 10
-3 Interpolation of Power Output at Matched Load
P o w e r [W ] Temperature Difference [K] TEG 1 data TEG 2 data TEG 1 quadratic fit TEG 2 quadratic fit
b)
c) d)
suppliers: In the case of this study, the properties of the TEGs are comparable, but TEG 2 is by a factor of 10 more expensive than TEG 1. At the same time TEG 1 has a smaller area than TEG 2, therefore more TEGs per area can be mounted which leads to an increased overall improvement for a smaller price.
4. Conclusion
This study makes part of a research that wants to assess the photovoltaic panels efficiency improvement when combined with thermoelectric generators. Besides two different techniques for energy harvesting that will increase the final electrical power output, this method can be proper to increase the useful lifetime of the system. Nevertheless, commercially available TEGs must be used if this method is to be used in a larger scale. This specific experimental study analyses the performance of two commercial thermoelectric generators through the measurement of different electrical parameters that allow to calculate the maximum power output and the overall conversion efficiency.
The infrared thermography technique is used to evaluate the temperature distribution over the generators surface as a complement to the experimental measurements. It is shown that the power output as well as the conversion efficiency at temperature difference smaller than 50 K are very low. However, since the solar energy is a renewable and freely available source of energy, the conversion efficiency can be of lesser importance. The overall efficiency of photovoltaic panels can be increased combining them with thermoelectric generators. At this point, is not clear if the implementation of thermoelectric generators in photovoltaic panels is economical, however, this study provides an indication of their efficiency in the temperatures difference range usually found between the upper and lower surface of PV panels.
References
[1] D.M. Rowe, CRC Handbook of thermoelectrics, CRC
Press LLC, Boca Raton, Florida, USA, 1994.
[2] V. Zlati and A.C. Hewson. Properties and
Applications of Thermoelectric Materials: The Search for New Materials for Thermoelectric Devices, Proceedings of the NATO Advanced Research Workshop on Properties and Applications of
Thermoelectric Materials, Springer Science,
September 2008.
[3] F. Kreith, The CRC Handbook of Thermal
Engineering, CRC Press LLC, Boca Raton, Florida, USA, 2000.
[4] Y.Y. Hsiao, W.C. Chang, S.L. Chen, A mathematic
model of thermoelectric module with applications on waste heat recovery from automobile engine, Energy 35(3), March 2010, pp 1447-1454.
[5] C.A. Mgbemene, J. Duffy, H. Sun, S.O. Onyegegbu,
Electricity generation from a compound parabolic concentrator coupled to a thermoelectric module, in Proceedings of ASME ES2008, Conference on
Energy Sustainability - ES 2008, Jacksonville, Florida, USA, August 10-14, 2008.
[6] D. Kraemer, L. Hu, A. Muto, X. Chen, G. Chen and
M. Chiesa, Photovoltaic-thermoelectric hybrid
systems: A general optimization methodology, Applied Physics Letters 92, 243503 2008.
[7] M. Eswaramoorthy, S. Shanmugam,
Techno-economic analysis of a solar thermoelectric power generator for a rural residential house energy demand,
International Journal of Applied Engineering
Research, Oct 1, 2009.
[8] J.C. Bass, A.S. Kushch, N.B. Elsner, Thermoelectric
Generator (TEG) for Heavy Diesel Trucks, XX
International Conference on Thermoelectrics:
Proceedings ICT2001, Beijing, China, 8-11 June 2001.
[9] H.J. Goldsmid, Introduction to Thermoelectricity,
Springer Verlag, Berlin Heidelberg (2010), pp. 182-187.
[10] Thermoelectric Module Collections. [Cited:
September 13, 2010]
http://www.ieverred.com/Products_2.html
[11] Hi-Z Technology, Inc. [Cited: September 13, 2010]
http://www.hi-z.com/index.php
[12] W.J. Tomlinson, D. Stapley, “Thermal conductivity of
epoxy resin – aluminium (0 to 50%) composites”, in Journal of materials science 12 (1977) Letters.