In Silico
Modeling of Itk Activation Kinetics in
Thymocytes Suggests Competing Positive and Negative
IP
4
Mediated Feedbacks Increase Robustness
Sayak Mukherjee1, Stephanie Rigaud7, Sang-Cheol Seok1, Guo Fu7, Agnieszka Prochenka1,8,
Michael Dworkin1,5, Nicholas R. J. Gascoigne7, Veronica J. Vieland1,2,4, Karsten Sauer7*, Jayajit Das1,2,3,6*
1Battelle Center for Mathematical Medicine, The Research Institute at the Nationwide Children’s Hospital, Columbus, Ohio, United States of America,2Department of Pediatrics, The Ohio State University, Columbus, Ohio, United States of America,3Department of Physics, The Ohio State University, Columbus, Ohio, United States of America,4Department of Statistics, The Ohio State University, Columbus, Ohio, United States of America,5Department of Mathematics, The Ohio State University, Columbus, Ohio, United States of America,6Biophysics Graduate Program, The Ohio State University, Columbus, Ohio, United States of America,7Department of Immunology and Microbial Science, The Scripps Research Institute, La Jolla, California, United States of America,8Institute of Computer Science, Polish Academy of Sciences, Warsaw, Poland
Abstract
The inositol-phosphate messenger inositol(1,3,4,5)tetrakisphosphate (IP4) is essential for thymocyte positive selection by regulating plasma-membrane association of the protein tyrosine kinase Itk downstream of the T cell receptor (TCR). IP4can act as a soluble analog of the phosphoinositide 3-kinase (PI3K) membrane lipid product phosphatidylinositol(3,4,5)tri-sphosphate (PIP3). PIP3recruits signaling proteins such as Itk to cellular membranes by binding to PH and other domains. In thymocytes, low-dose IP4binding to the Itk PH domain surprisingly promoted and high-dose IP4inhibited PIP3binding of Itk PH domains. However, the mechanisms that underlie the regulation of membrane recruitment of Itk by IP4and PIP3 remain unclear. The distinct Itk PH domain ability to oligomerize is consistent with a cooperative-allosteric mode of IP4 action. However, other possibilities cannot be ruled out due to difficulties in quantitatively measuring the interactions between Itk, IP4and PIP3, and in generating non-oligomerizing Itk PH domain mutants. This has hindered a full mechanistic understanding of how IP4controls Itk function. By combining experimentally measured kinetics of PLCc1 phosphorylation by Itk within silico modeling of multiple Itk signaling circuits and a maximum entropy (MaxEnt) based computational approach, we show that thosein silicomodels which are most robust against variations of protein and lipid expression levels and kinetic rates at the single cell level share a cooperative-allosteric mode of Itk regulation by IP4 involving oligomeric Itk PH domains at the plasma membrane. This identifies MaxEnt as an excellent tool for quantifying robustness for complex TCR signaling circuits and provides testable predictions to further elucidate a controversial mechanism of PIP3 signaling.
Citation:Mukherjee S, Rigaud S, Seok S-C, Fu G, Prochenka A, et al. (2013)In SilicoModeling of Itk Activation Kinetics in Thymocytes Suggests Competing Positive
and Negative IP4Mediated Feedbacks Increase Robustness. PLoS ONE 8(9): e73937. doi:10.1371/journal.pone.0073937
Editor:Francesco Pappalardo, University of Catania, Italy
ReceivedMarch 28, 2013;AcceptedJuly 25, 2013;PublishedSeptember 16, 2013
Copyright:ß2013 Mukherjee et al. This is an open-access article distributed under the terms of the Creative Commons Attribution License, which permits
unrestricted use, distribution, and reproduction in any medium, provided the original author and source are credited.
Funding:This work was supported by funding from the Research Institute at Nationwide Childrens Hospital to J.D., NIH grant AI070845 and The Leukemia and
Lymphoma Society Scholar Award 1440-11 to K.S, and NIH grant MH086117 to V.J.V. Part of this work was supported by NIH grant AI070845 to K.S. The funders had no role in study design, data collection and analysis, decision to publish, or preparation of the manuscript.
Competing Interests:The authors have declared that no competing interests exist.
* E-mail: [email protected] (KS); [email protected] (JD)
Introduction
Hydrolysis of plasma membrane phospholipids generates various cellular messengers [1]. Among these, multiple isomeric inositol phosphates (IP) [1–4] form an ‘‘IP code’’ [5] whose members can regulate critical decision processes downstream of many receptors in diverse cell types. However, the specific mechanisms and precise molecular circuitries that underlie the regulation of cell functions by soluble IPs are poorly understood. We and others previously reported an essential role for inositol(1,3,4,5) tetrakisphosphate (IP4) in regulating T cell
development [2,3,6,7].
T cells are key mediators of adaptive immune responses. Through a plasma-membrane anchored TCR, they recognize pathogen-derived peptides bound to Major Histocompatibility Complex proteins (pMHC) on the surface of antigen-presenting
generating a diverse but self-tolerant T cell repertoire [8–10]. Recent experiments provided a more complex picture of thymic selection, where certain high affinity peptides can ‘agonist select’ distinct regulatory T cell types [11,12].
TCR-pMHC binding triggers a series of signaling reactions, resulting in the formation of a plasma membrane-proximal signalosome containing Src (Lck, Fyn) and Syk family protein tyrosine kinases (Zap70), cytosolic (such as SLP-76, Gads, Grb-2), and transmembrane adapter proteins (such as LAT). TCR-activation of phosphoinositide 3-kinase (PI3K) converts the abundant membrane phospholipid phosphatidylinositol(4,5) bi-sphosphate (PIP2) into phosphatidylinositol(3,4,5) trisphosphate
(PIP3). By binding to pleckstrin homology (PH) or other
protein-domains, PIP3recruits key effectors such as the Tec family protein
tyrosine kinase Itk (IL-2 inducing T cell activation kinase). Itk also contains SH2 and SH3 domains that bind to signalosome components. The Src kinase Lck phosphorylates Y511 in the
A-loop of the murine (Y512in the human) Itk kinase domain [13].
Subsequently, Itk propagates TCR signals by phosphorylating and activating signalosome-recruited phospholipase Cc1 (PLCc1). PLCc1 then hydrolyzes PIP2into the second messenger molecules
diacylglycerol (DAG) and inositol(1,4,5) trisphosphate (IP3). The
membrane lipid DAG further recruits and activates Rasgrp1 and PKCs that in turn activate the GTPase Ras and the Bcl-10/ CARMA1/MALT complex, ultimately triggering thymocyte positive and negative selection, or peripheral T cell responses [14,15]. Soluble IP3 mobilizes Ca2+ from the endoplasmic
reticulum (ER). Moreover, IP3 3-kinases such as ItpkB can
phosphorylate IP3 at its 3-position into IP4 [2,6,7,14,16]. IP4
chemically resembles the PH domain binding PIP3
tetrapho-sphoinositol headgroup [14,17].
We and others identified ItpkB as essential for thymocyte positive selection [2,6,7]. ItpkB2/2 DP thymocytes show intact proximal TCR signaling but defective IP4 production, Itk PIP3
-binding, signalosome recruitment and activation with ensuing reduced PLCc1 activation, DAG production, and, Ras/Erk activation [2]. The ability of soluble IP4 to bind to the Itk PH
domain and in low mM doses promote PIP3 binding, and the
ability of the Itk PH domain to oligomerize suggested that IP4
might promote Itk recruitment to membrane-PIP3 through a
cooperative-allosteric mechanism. In this model, IP4-binding to
one PH domain in an oligomer allosterically increases the ligand affinities of the other PH domains in the same oligomer [2]. IP4
promoted Itk activation appears to be required for sufficient Itk activation to ensure positive selection, because an exogenous DAG-analog restored positive selection of ItpkB2/2 thymocytes [2]. However, high-dose IP4inhibited Itk PH domain binding to
PIP3 in vitro[2]. Whether it does soin vivo is unknown [14]. In
neutrophils, NK cells and myeloid progenitors, IP4competitively
limits Akt PH domain binding to membrane PIP3[18–20]. Which
PH domains are positively versus negatively controlled by IP4, and
what determines whether IP4 promotes or inhibits PH domain
binding to PIP3 or leaves it unaffected are important open
questions [14,21]. In particular, the Itk PH domain might be bi-modally regulated by IP4. However, the detailed molecular
interactions between Itk, PIP3 and IP4 in vivo are not well
characterized. This leaves room for multiple alternate hypothe-ses/mechanisms. For example, one could also propose that the binding affinity of PIP3and IP4for Itk changes from a low to a
fixed high value above a threshold IP4 concentration. Such a
mechanism implies that the interaction of Itk with IP4and PIP3
after the threshold IP4concentration is reached does not involve a
positive feedback. The situation is further confounded by elusive results from experiments probing Itk oligomerization [2,22–28].
The current lack of a mechanistic understanding of how IP4
controls Itk PIP3-interactions and whether Itk PH domain
oligomerization is physiologically relevant arises from difficulties in quantitatively measuring the interactions between Itk, IP4and
PIP3, and in generating soluble Itk PH domain preparations for
biophysical studies and non-oligomerizing Itk PH domain mutants for genetic analyses. Additional limitations arise from difficulties in measuring membrane recruitment of Itk in cell population based assays. It is also difficult to measure PIP3 bound Itk or
phosphorylation of PLCc1, a substrate of PIP3bound Itk, in large
numbers of individual cells using flow cytometry techniques due to limited antibody quality.In vitro and cell-based studies based on ectopic Itk expression suggest the existence of several different monomeric and oligomeric Itk species, including head-to-head and head-to-tail dimers [2,22–28]. Andreotti and colleagues [22] showed that Itk molecules can self associate via their SH2–SH3 domains into auto-inhibitory oligomers. This is hindered by SLP-76 interactions with the Itk SH2–SH3 domains. It was suggested that Itk molecules might exist as auto-inhibited multimers in the cytosol, but after plasma membrane recruitment, Itk monomers might mediate downstream activation [22,26]. Other experiments [27,28] employing fluorescence complementation showed that formation of Itk head-to-head and head-to-tail dimers requires the PH domain and may primarily occur at the plasma membrane, although low-abundance cytoplasmic dimers have not been excluded. Here, monomeric Itk was proposed to be primarily cytoplasmic and autoinhibited [27]. At least head-to-head dimerization is unaffected by mutations in the other (SH2/SH3) domains [28]. We found that the Itk PH domain can oligomerize with other Itk PH domains or full length Itk [2]. Thus, the PH domain is well suited to contribute to at least certain modes of Itk oligomerization, some of which could have positive or a combination of positive and negative functions regulated by IP4/
PIP3. This could account for the limited activity-enhancing effect
of disrupting SH3/SH2-domain mediated Itk dimerization [26]. Altogether, whether Itk PH domain dimerization has a physiological function, whether it promotes or inhibits Itk activation, whether IP4controls Itk function through positive or
negative feedback, or both, and whether IP4 has additional
unrelated functions in thymocytes, are all contentious questions in the field. Resolving them is very important, because PI3K is a paramount regulator of signaling from many receptors in most cells. PIP3 hyperactivity is a major contributor to immune,
metabolic and other diseases including cancers [29,30]. IP3
3-kinases are broadly expressed and IP4has been found in many cell
types. Thus, IP4 regulation of PIP3 function could be broadly
important and elucidating the precise molecular mechanisms through which IP4 controls PIP3 signaling improves our
under-standing of a very fundamental and important signaling pathway with great therapeutic relevance [14].
To further explore how the presence or absence of Itk PH domain oligomerization, of positive or negative IP4feedback or
both, or of specific molecular modes of association of Itk, PIP3and
IP4 impact TCR signaling, we constructed seven different
molecular models (Table 1 and Figure S1B). We used a Maximum Entropy (MaxEnt) [31–33] based approach to quantify the robustness of each model against variations in rate constants and protein expression levels at the single cell level. Each model was constrained to reproduce the Itk activation kinetics of an entire cell population measured in biochemical experiments. We found that those models involving dimeric Itk molecules with IP4mediated
retaining their sensitivity to small variations in antigen affinity or dose. On this basis, our simulations best support biphasic Itk regulation by IP4 in thymocytes. Future testing of this exciting
hypothesis will require the so far unsuccessful generation of non-oligomerizing Itk PH domain mutants and their expression in
Itk2/2mice, along with currently impossible single-cell measure-ments of IP4levels in large cell populations.
Results
Multiple Molecular Models can be Constructed to Probe Itk, IP4, and PIP3Interactionsin silico
We constructed seven different molecular models (Table 1, Figure S1B) based on available details about interactions between Itk, PIP3 and IP4from the biochemical studies described above.
Including Itk kinase domain activation by Lck only caused qualitative changes in the relative robustness of the models (Fig. S17, Tables S9–S15). Therefore, for simplicity, we considered models that do not contain Itk activation by Lck explicitly. We also did not consider Itk autophosphorylation explicitly in the models as it does not affect Itk catalytic activity. In addition, the role of Itk autophosphorylation in PLCc1 activation remains unclear [22]. Since we aimed to elucidate general characteristics of the kinetics of PIP3 binding to Itk, we used a simplified modeling scheme
(Fig. 1) and did not consider the detailed molecular composition of the TCR and the LAT associated signalsome. The models also do not investigate different mechanisms for formation of Itk oligomers. Rather, they probe the functional consequences of having Itk PH domain dimers versus monomers and how these can affect interactions between Itk, PIP3and IP4in the presence or
absence of IP4mediated positive feedback. The kinetics of PIP3
production due to signal-dependent recruitment of PI3K are not considered explicitly as PIP3 is produced at a much faster time
scale (in seconds, [35] [36] [37]) than the time scales of PLCc1 activation (up to 60 min, Figure S18). The concentrations of LAT bound Itk and of PIP3were considered approximate markers for
the strength of the stimulation generated by antigen-TCR interactions. Therefore, we considered fixed initial concentrations of Itk and PIP3in the models. We approximated the production of
IP4from PIP2by a single one-step reaction to simplify the models
further.
The models can be broadly classified into two types: (i) Models M1–M4 and M7 containing IP4mediated positive feedbacks. (ii)
Models M5 and M6 lacking IP4positive feedback. In each type,
we further considered models that contained Itk dimers (models M1–M3, M5, M7), or monomers (models M4, M6). In models M1–M3, each of the two PH domains in the Itk dimer can independently bind to either IP4or PIP3with a weak affinity when
the other PH domain is unoccupied. However, once a PH domain is bound to an IP4molecule, it allosterically increases the affinity of
the other PH domain for PIP3 and IP4. Models M1–M3 differ
from each other in the relative increase in the affinities of one PH domain in the Itk dimer toward IP4vs. PIP3caused by IP4or PIP3
binding to the other PH domain in the dimer. In contrast, in M7, binding of PIP3to one PH domain in a dimer increases the affinity
of the other PH domain for PIP3but not for IP4. These models
probed potential secondary interactions between Itk dimers and the membrane lipids. In the monomeric model, M4, IP4binds the
single Itk PH domain with a weak affinity and induces a conformational change that increases the affinity of this PH domain for both PIP3and IP4. Models M5 and M6 lack positive
IP4feedback. Instead, the Itk PH domain binds to IP4and PIP3
with equal affinity. These models probed a mechanism where the Itk PH domain interacts with IP4and PIP3once a small threshold
IP4 concentration is generated. We assumed that the small
threshold level of IP4is generated at a time scale much smaller
than the timescale (min) of robust Itk activation and did not consider the kinetics generating the threshold level of IP4explicitly
in M5 and M6. The models are summarized in Table 1, Figure S1B, and Tables S1–S8.
The Shape of Transient Itk Activation Kinetics Depends on Specific Molecular Wirings and Feedbacks in the Different Models
We studied the kinetics of Itk binding to PIP3 using
deterministic mass-action kinetic rate equations described by ordinary differential equations (ODE) for all the models, ignoring stochastic fluctuations in the copy numbers of signaling proteins occurring due to the intrinsic random nature of biochemical reactions [38]. Including such fluctuations did not change the kinetics qualitatively (Figures S2–S3). In all seven models, the kinetics of PIP3bound Itk showed a transient behavior (Fig. 2A);
PIP3bound Itk started with a low concentration, reached a peak
value at an intermediate time, and then fell back to a small concentration at later times. We found that initially few Itk molecules were bound to PIP3. With increasing time, more Itk
molecules became associated with PIP3 molecules due to the
binding reactions between Itk and PIP3. This produced the rise in
the Itk-PIP3 concentration. However, as the concentrations of
PIP3bound Itk molecules increased, they also induced increased
production of IP4molecules. IP4competed with PIP3for binding
to the Itk PH domain, and when the number of IP4molecules
exceeded that of PIP3molecules, most of the Itk molecules were
sequestered to the cytosol by forming stable complexes only with IP4. This reduced the rate of PIP3association of Itk and eventually
resulted in the decrease of the PIP3 bound Itk molecules. IP4
outnumbered PIP3 at later times because the number of PIP2
molecules, the source of IP3 and IP4in a cell, is considered not
limiting in contrast to PIP3[37,39]. We emphasize that the results
of our models do not depend on the cytosolic nature of Itk-IP4
complexes, but on the model assumption that Itk (or Itk oligomers) Figure 1. Relevant basic interactions between Itk, PIP3 and IP4. Following TCR-pMHC binding, Itk molecules are bound by the LAT signalosome via SLP-76 (not shown). Itk molecules (monomers or dimers, blue diamonds), bind the membrane lipid PIP3with low affinity through their PH domains. PIP3bound Itk phosphorylates and thereby activates LAT-bound PLCc1. Activated PLCc1 then hydrolyzes the membrane lipid PIP2 into the soluble second messenger IP3, a key mediator of Ca2+mobilization. IP33-kinase B (ItpkB) converts IP3into IP4(red filled circle). For ourin silico models, we simplified this series of reactions, encircled by the orange oval, into a single second order reaction where PIP3bound Itk converts PIP2 into IP4. In models M1–M4 and M7, IP4modifies the Itk PH domain (denoted as ItkC, purple diamonds) to promote PIP3and IP4binding to the Itk PH domain. At the onset of the signaling, when the concentration of IP4is smaller than that of PIP3, IP4helps ItkCto bind to PIP3(left lower panel). However, as the concentration of IP4is increased at later times, IP4outcompetes PIP3for binding to ItkCand sequesters ItkCto the cytosol (right lower panel). In models M5/M6, IP4and PIP3do not augment each other’s binding to Itk. However, IP4still outcompetes PIP3for Itk PH domain binding when the number of IP4molecules becomes much larger than that of PIP3molecules at later times.
bound to IP4 at every PH domain does not induce any PLCc1
activation.
We characterized the ‘shape’ of the temporal profile of PIP3
bound Itk in terms of (i) the largest concentration of PIP3bound
Itk in the entire temporal profile (peak amplitude valueA); (ii) the time taken for PIP3bound Itk to reach the peak value (peak time
tp); and (iii) the time interval during which the PIP3bound Itk
concentration is greater than or equal to half of the peak value (peak durationtw, Fig. 2B). A dimensionless variable quantifying
the asymmetry in the shape of the kinetics, denoted as the asymmetry ratio R=tw/tp (Fig. 2B), turned out to be a useful indicator for differentiating temporal profiles of concentrations of PIP3bound Itk in simulations and experiments. R also quantifies if
the time scale for the decay of the concentration of PIP3bound Itk
after the peak value is reached is larger than or comparable totp
(the timescale for producing the peak valueA). E.g.,whenR>1, it implies that thetpis comparable to decay time.R.1 indicates a
more persistent signal with long decay times. Differences (transient
vs. persistent) in the shapes of kinetic profiles of signals downstream of Itk activation have been observed to influence thymocyte decision outcomes [2,40]. Therefore, R, which characterizes the persistent or transient nature of Itk activation, also contains details directly relevant for thymic selection outcomes. We found that the shape of the transient kinetics of PIP3 binding to Itk varied substantially depending on the
feedbacks and the molecular wiring of the networks. Since the reaction rates used in the models are difficult to measurein vivofor thymocytes, we estimated the rates based on interaction strengths measuredin vitrobetween PH domains and inositol phosphates in other cells, and from temporal profiles of PLCc1 activation measured in experiments with T cells (Tables S1–S7). Previous work demonstrated the essential role of phosphorylated PLCc1 and its kinetics in regulating thymocyte positive, negative and agonist selection [41,42]. Phospho-PLCc1 is also known to mirror other indicators of T cell activation such as TCRf- or Figure 2. Different molecular interactions in models M1–M7 produce different temporal profiles of PIP3binding to Itk.(A) Kinetics of PIP3association of Itk for fixed initial PIP3and Itk concentrations (100 and 370 molecules, respectively) in models with feedbacks (M1–M4, and M7, left panel) and no feedbacks (M5–M6, right panel). (B) The shapes of the temporal profiles can be characterized by the parameters peak time (tp), peak width (tw), and peak value or amplitude (A). The dimensionless asymmetry ratioR=tw/tpquantifies how symmetric the shape of the time profile is. A larger R value indicates larger asymmetry. (C) Variations in R in models M1–M7 for different initial concentrations of Itk and PIP3. Color scales for R values are shown on the right of each panel.
LAT-phosphorylation, or Erk-activation [2,40]. Therefore phos-pho-PLCc1 is a relevant marker for functional T cell responses.
We studied variations in the kinetics of PIP3 bound Itk for
different initial concentrations of Itk and PIP3. This probed how
different ligand doses or affinities affected the PIP3binding of Itk.
We found that the peak concentration of PIP3bound Itk increased
in a graded manner with increasing initial Itk and PIP3
concentrations in all models (Figure S4). However, the peak time tp(Figure S5), and the asymmetry ratio R (Fig. 2C), were affected
differently in different models. Among the feedback models, M1– M3 and M7 containing Itk dimers generated smaller values (varied between 2 to 6) of R compared to monomeric model M4 which produced a much larger range of R (,20 -120) (Fig. 2C). The models lacking positive feedbacks (M5 and M6) generated large values (,100–700) of R compared to feedback models with Itk dimers (Fig. 2C). In the feedback models, the initial low affinity binding-unbinding interactions between Itk and PIP3/IP4 are
converted into high affinity interactions due to the positive feedback. Therefore, a large part oftpis spent in building up the
positive feedback interactions controlled primarily by the weak affinity binding-unbinding rates (or KD). The small values of R in
models M1–M3 and M7 occurred because stronger negative feedbacks resulted in much smaller timescales for substantially reducing the concentration of PIP3bound Itk after it reached its
peak value compared to the other models. In the models lacking positive feedback (M5, M6), concentrations of PIP3 bound Itk
decreased at a much slower rate than the peak time leading to large values of R. In the monomeric model, the relatively weaker strength of positive and negative feedbacks resulted in larger decay time scales for the PIP3bound Itk, producing large values of R.
These results are analyzed in detail in the web supplement and Figures S6–S11. We will show below how the ability of feedback models with Itk dimers to produce R values within a small range leads to higher robustness of these models against parameter variations at the single cell level.
Models Containing Dimeric Itk and IP4Mediated Dueling Positive and Negative Feedbacks are the Most Robust Models
Quantification of robustness in in silico models. The
reaction rates describing non-covalent primary and secondary interactions between Itk, PIP3 and IP4 can depend on specific
properties of the local cellular environment, such as local membrane curvature [43], molecular crowding [44,45], and the presence of different lipid molecules in the proximity [46]. Since these factors can vary from cell to cell, the reaction rates can vary at the single cell level. In addition, protein expression levels can vary between cells. Such variations are also known as extrinsic noise fluctuations [47,48]. The IP4production rate depends on the
concentrations of ItpkB, Calmodulin (CaM), and released calcium [3]. Hence, the IP4 production rates in our models which
approximate all such dependencies with a one-step reaction will vary between individual cells as well. The above variations are capable of producing differences in the shapes of temporal profiles of activation of signaling proteins in individual cells [49]. In the coarse-grained or approximate models we have constructed, many molecular details have been approximated. For example, multiple phosphorylation sites or SH2/SH3 binding sites of Itk, LAT, SLP-76 and their regulation via TCR induced signaling are not considered explicitly [3,22,50,51]. These detailed molecular signaling events can depend on the concentrations of proteins, enzymes, and lipids, and can thus be regulated differently in different cells due to extrinsic noise fluctuations. Consequently, the rates in ourin silicomodels that effectively describe those detailed
signaling events can vary from cell to cell. Consistent with this view, our simulations with the ODE models showed that the shape of the kinetics of PIP3bound Itk, characterized by,A,tp, and R,
changed significantly as the rate constants and initial concentra-tions in a model were varied (Figures S12–S14). Thus, activation kinetics of a marker molecule (e.g. PLCc1) measured in experiments (e.g., immunoblots) assaying a large cell population represent averages over a range of temporal profiles with different shapes occurring at the single cell level.
We found that for some ranges of the reaction rates, multiple differentin silicomodels can produce the same values ofA,tp, and
R (Figures S12–S14). This implied that more than one in silico
modelcouldreproduce the mean temporal profile measured in cell population assays. However, it is possible that each model could show a different degree of robustness to variations in reaction rates and initial concentrations at the single cell level. Robustness of time dependent responses in a cell population against variations at the single cell levels has been observed in several systems, e.g., oscillations in adenosine 39,59 cyclic monophosphate (cAMP) concentrations in a population ofDyctostelium[52,53], or damped oscillations of protein 53 (p53) in a population of human breast cancer epithelial cells [54]. Robustness of cellular functions against variations in external conditions and cell-to-cell variability has been proposed as a required design principle for a wide range of biochemical networks [55–58]. We therefore decided to ask: Which model(s) can accommodate the largest variation in reaction rates and initial concentrations, while reproducing the mean temporal profile of PIP3 bound Itk measured as generation of
phosphorylated PLCc1 in cell population experiments? We postulate that the answer to this question will point us to the molecular circuitry most likely to be the relevant model, in the sense that it robustly produces a specific temporal response at the cell population level despite variations in the kinetics in individual cells.
To identify the most robust model(s), we quantified robustness using a method based on the principle of Maximum Entropy (MaxEnt) [31–33]. MaxEnt provides a mechanism for estimating the probability distribution of the rate constants and initial Itk and PIP3concentrations under constraints derived from experimental
data (Fig. 3A–B, 4A–B). Here, we used the experimentally obtained valuestpexptandRexptas the constraints. It is difficult to directly relate the amplitude (in units of number of molecules in the simulation box) in thein silicomodels to experiments, where amplitudes are calculated from the fold change of the immunoblot intensities upon stimulation. Therefore, the experimental values of
Acan be related to the number of activated molecules, at best, through a proportionality constant dependent on specific protocols used in an assay. Because of these issues we chose a value ofAexpt, representing A in experiments, where every in silico model produced amplitudes at Aexptfor a set of parameters within the range of variations considered here. We then varied Aexpt to investigate the change in robustness of the models and address the arbitrariness in the choice of Aexpt. We constructed a relative entropy measure (Kullback-Leibler distance, DKL, calculated on
the log10scale) [59] that measures the deviation of the constrained
MaxEnt distribution from the unconstrained MaxEnt distribution, in which all values of the rate constants and initial concentrations are equally likely (uniform distribution). Thus DKLis being used as
a measure of how ‘‘close’’ each model can get to one which is completely indifferent to the values of the rate constants, given the experimental constraints. We then compared DKL across our
models in order to find the most robust model compatible with experimental results. Note that the minimum value of DKLis 0,
analyzed DKL for different models when tpexpt and Rexpt were constrained but the amplitude Aexpt was not constrained (Figure S23). The results are qualitatively similar to that of the case when
tp
expt
, Rexpt, and Aexpt were constrained. This indicates that the robustness of the temporal shape of Itk membrane recruitment kinetics rather than the amplitude contributes substantially toward the increased robustness of the feedback models with Itk dimers.
Experimental analysis of Itk activation kinetics in mouse
thymocytes. To determine which Itk activation profile
predict-ed by models M1–M7 produces maximum robustness while reproducing experimental data, we analyzed Itk activation kinetics in mouse CD4+CD8+ double-positive (DP) thymocytes, the
developmental stage where positive selection occurs [9,60]. To generate a homogeneous cell population in which every cell expresses the same TCR and in which the TCR has not been stimulated by endogenous ligands prior toin vitrostimulation, we used OT1 TCR-transgenic, RAG22/2, MHCI(b2m)2/2 mice. Their DP cells express exclusively the transgenic OT1 TCR, which recognizes the ovalbumin-derived peptide ligand OVA and recently identified endogenous peptide ligands presented by MHCI molecules [40,61]. In MHCI2/2 mice, no endogenous ligands are presented to OT1 TCR-transgenic T cells and their development is blocked at the DP stage due to impaired positive selection.In vitro, OT1 TCR transgenic DP cells can be stimulated with MHCI tetramers loaded with OVA peptide [40,61]. Due to its high affinity for the OT1 TCR, OVA stimulation generates strong TCR signals and induces DP cell deletion. A number of OVA-derived altered peptide ligands (APL) have been generated which carry single or multiple amino acid substitutions compared to OVA. In the peptide series OVA.Q4R7.Q4H7.G4, such substitutions progressively reduce OT1 TCR affinity and signaling capacity [40]. Consequently, OVA and Q4R7 causeOT1 TCR-transgenicDP cell negative selection, whereas Q4H7 and G4 trigger positive selection.
We used MHCI tetramers presenting either one of these four peptides to stimulateRAG22/2MHC2/2 OT1 TCR-transgenic DP cells for various time points. We analyzed PLCc1 phosphorylation at Y783, normalized to total PLCc1 protein levels, as a measure for
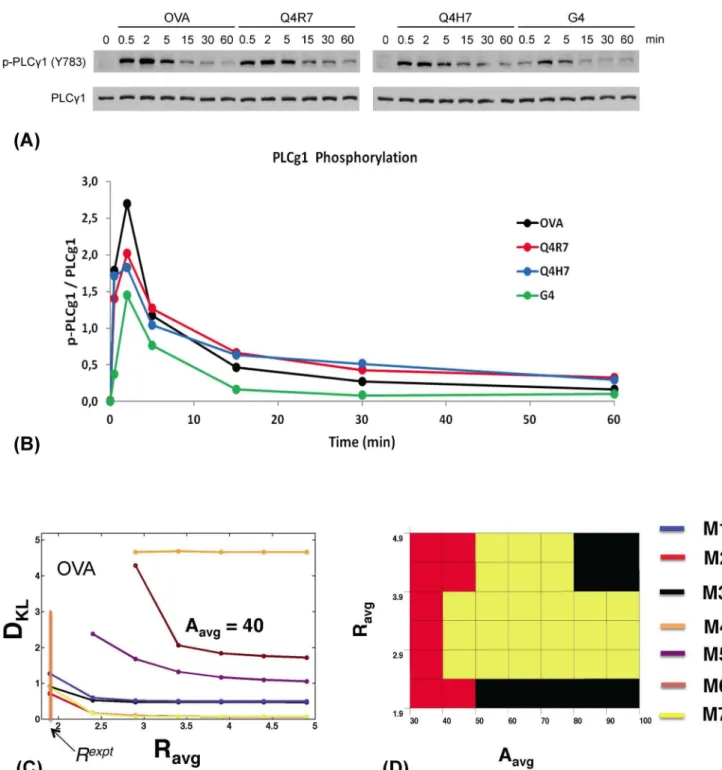
Itk activation [2] (Fig. 3A). Stimulation by all peptides induced fast PLCc1 phosphorylation already at 1 min which peaked at 2 min and then decreased over the next 60 min to very low levels which, however, were still above background levels in unstimulated cells. The decrease was fastest between 2 and 5 min and then progressively slowed down. As expected, overall levels of PLCc1 phosphorylation progressively decreased with decreasing peptide affinity/signaling capacity in the order OVA.Q4R7. Q4H7.G4. An asymmetric peak shape with an extended right flank was preserved across all signal intensities. We calculated the peak durations (tw), peak times (tp) and asymmetry ratiosR =tw/tp in Table 2 for stimulation with OVA, Q4R7, Q4H7 and G4, respectively. Consistent with preserved peak asymmetry, all ratios R were.1.
Comparison between experiments and conclusions. The
phospho-PLCc1 levels (representing active Itk) for different affinity peptides peaked at tp= 2 mins with R values from 1.9–4.3
(Table 2). Therefore, we fixed tpexpt=tp= 2 mins (the bar indicates average over the cell population) for quantifying robustness in thein silico modeling. The low, medium and large initial Itk and PIP3concentrations represent stimulation by weak
(G4), moderate (Q4R7, Q4H7) and high affinity (OVA) ligands, respectively. Analyzing DKL(Fig. 3C) showed that for large initial
PIP3 and Itk concentrations (representing OVA stimulation) the
feedback models incorporating Itk PH domain dimers (M1–M3, M7) were substantially more robust (Smaller DKLvalues) than the
models lacking feedbacks (M5, M6) for small values of R (,3). Monomeric feedback model M4 produced large DKLvalues (1.5–
5). M5, M6 and M4 produced much larger ranges of R (Figure S14) as the parameters were varied compared to the feedback models with Itk dimers where the values of R were clustered around Rexpt ,2. This behavior contributed substantially to the increased robustness of the feedback models with dimers as these models could accommodate for larger ranges of parameter variations while being able to maintain the constraint imposed byRexpt. The relative robustness of the feedback versus feedback-free models showed similar qualitative trends for the other ligands, Q4R7, Q4H7, and G4 (Figure S15–S16). This suggests that the models containing feedbacks and Itk dimers are substantially more robust than models with Itk monomers or lacking feedbacks.
Evaluation of robustness in polyclonal thymocytes. The
molecular wiring of Itk, PIP3 and IP4 interactions is unlikely to
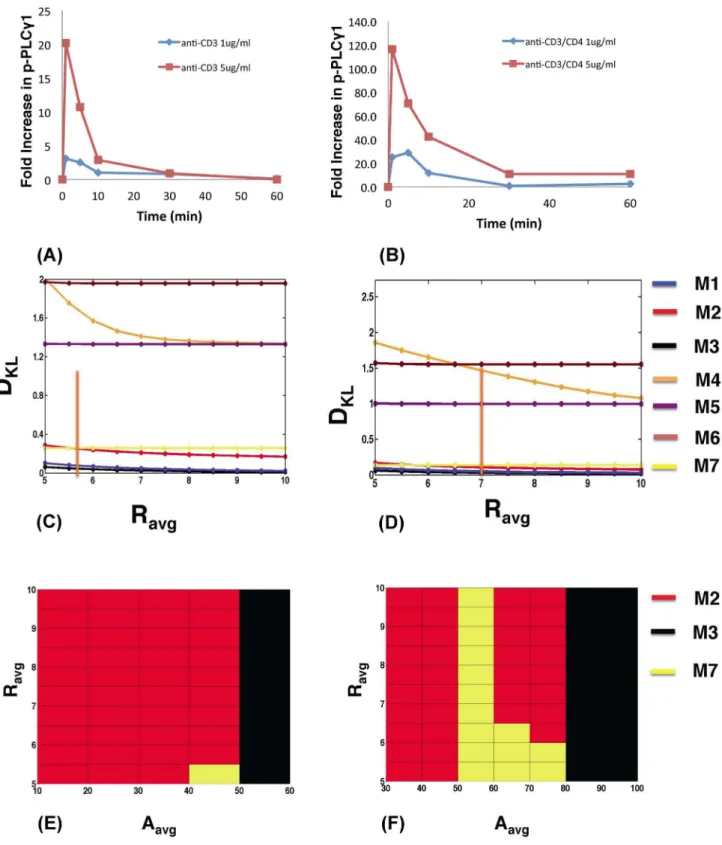
depend on the clonal nature of the T cells. Thus, the feedback models with Itk dimers should also be more robust than the other models when used to describe the kinetics of PLCc1 activation in polyclonal DP thymocytes expressing many different TCRs with different ligand specificities, stimulated by antibodies against the common TCR subunit CD3 alone or with co-ligation of the common coreceptor CD4. Stimulation of non TCR-transgenic
MHC2/2 DP cells with 1mg/ml or 5mg/ml of aCD3 or combinedaCD3/aCD4 antibodies produced different Rexpt and tpexptvalues than the OT1 system above (Fig. 4A–4B, Figure S18,
Table. S16). Calculation of the robustness constrained by Rexpt,
tp
expt
and Ashowed that feedback models M1, M2, M3 and M7 are again substantially more robust than the other models (Fig. 4C– 4F, Figure S19, S20). Large variations ofRin M4, M5 and M6 as parameters were varied again made these models substantially less robust than the feedback models with Itk dimers.
Discussion
Here, we used in silico simulations combined with a novel Maximum Entropy (MaxEnt) based method and cell population averaged measurements of PLCc1 activation kinetics to distinguish between multiple models constructed to elucidate different mechanisms of Itk activation in TCR signaling. Our analysis quantified the robustness of seven different models employing monomeric or dimeric Itk PH domains with or without positive and negative IP4feedback against variations of parameters (rates
and concentrations) at the single cell level. MaxEnt has been widely used in diverse disciplines ranging from physics [62] via information theory [63] to biology [64–67] to estimate probability distributions of variables subject to constraints imposed by experimental data [33,65]. However, to our knowledge these methods have not been used for evaluating the robustness of dynamic models in cell signaling or gene regulatory systems. Using thymocyte positive selection as a physiologically important model process, our results show the usefulness of MaxEnt methods for such studies. We are currently working on extending the methods to include additional information from experiments (such as variances), and also evaluating their performance in comparison with closely related approaches such as Bayesian analysis [68].
Our simulations predict that the models containing IP4
feedbacks and Itk dimers are most robust. This is consistent with our previously proposed model of cooperative-allosteric regulation of Itk-PIP3 interactions via IP4-binding to oligomeric Itk PH
Figure 3. Experimentally measured PLCc1activation kinetics in DP thymocytes stimulated with TCR ligands of different affinities and robustness ofin silicomodels. (A) Immunoblots showing Y783-phosphorylated (upper panels) and total (lower panels) PLCc1 protein amounts inRAG22/2MHC2/2OT1 TCR-transgenicDP thymocytes stimulated for the indicated times with MHCI tetramers presenting the indicated
altered peptide ligands (APL). (B) Phospho-PLCc1 levels normalized to total PLCc1 protein amounts plotted over time for the indicated APLs. Their TCR affinity decreases in the order OVA (black).Q4R7 (red).Q4H7 (blue).G4 (green). Band intensities were quantified via scanning and analysis with ImageJsoftware. Representative of several independent experiments. (C) Variation of the Kulback-Leibler distance DKLwithRfor models M1–M3 (blue, red and black, respectively), M7 (yellow), and M4–M6 (orange, purple, and maroon, respectively) at high initial Itk (Itk0= 140 molecules) and PIP3 concentrations (PIP30= 530 molecules), representing high-affinity OVA stimulation fortp= 2 min andA(shown asAavg) = 40 molecules. Note we useA to represent the amplitudeAexptin experiments measuring fold change in Itk phosphorylation (see the main text for further details). The vertical orange bar indicates Rexpt
for OVA. Color legend in (D). (D) The color map shows which model is most robust (has the lowest DKL) asRexptandA (shown asAavg) are varied for the same parameters as in (C). The color legend is depicted on the right.
that for a fixed antigen dose and affinity (or average initial concentrations of Itk and PIP3in our models), TCR signaling in
thymocytes should be robust against cell-to-cell variations of protein/lipid concentrations, rate constants and local environ-ment. But TCR signaling should retain sensitivity to small variations in antigen affinity or dose. A direct experimental validation of this assumption will require to test the probability distributions of tp, R, and A in cell populations where PLCc1
activation kinetics are measured in individual cells. However, we were unable to perform such single cell comparisons due to the insensitivity of FACS-based PLCc1 signaling assays. This indicates the importance of studying the effects of network architecture, rate constants, protein and lipid concentrations on system robustness in DP thymocyte selection in detail in the future. Thymocytes are an excellent in vivomodel to probe the exquisite dependency of cell fate decisions on the affinity of TCR ligands with important physiological and pathological implications. This provides a valuable addition to the experimental and theoretical investiga-tions of robustness in synthetic systems or transformed tissue culture cellsin vitro.
On the basis of robustness, our simulations support bimodal positive and negative Itk regulation by IP4 in thymocytes. They
make a supportive argument that Itk PH domain oligomerization and IP4feedback are physiologically important, consistent with the
severely defective TCR signaling, IP4 production, Itk/PLCc1
activation, positive selection and resulting immunodeficiency in
ItpkB2/2 mice, the ability of IP4 to bimodally control Itk PH
domain binding to PIP3in vitro, and the reported Itk PH domain
oligomerization [2,6,7,28]. They do, however, not exclude the possibility that IP4also has additional, unknown functions in DP
cells [14].
Testing this exciting hypothesis will require currently impossible single-cell measurements of IP4 levels in large cell populations.
Moreover, the physiological roles and modes of Itk oligomeriza-tion, the specific PH domain contributions to Itk oligomerizaoligomeriza-tion, whether Itk oligomerization occurs in the cytoplasm or at the plasma membrane or both, whether it exclusively inhibits or can also promote Itk activation, and whether IP4promotes or inhibits
Itk PH domain binding to PIP3or does both depending on its local
concentration are all matters of active debate [2,22–28]. Their conclusive elucidation requires quantitative biophysical studies of full length Itk with or without mutational perturbation of individual and combined interactions among the different Itk domains implicated in its monomeric and oligomeric self-association, and the reconstitution of Itk2/2 mice with these mutants at endogenous expression levels. Unfortunately, difficul-ties to produce sufficient quantidifficul-ties of soluble full-length Itk or Itk PH domain protein, and a tendency of Itk and its PH domain to aggregatein vitrohave precluded more quantitative analyses of Itk
PH domain oligomerization and IP4/PIP3interactions, as well as
the generation of non-oligomerizing Itk PH domain mutants. Despite progress regarding SH2/SH3/proline-rich domain inter-actions [22–26] and some evidence for PH domain involvement [2,27,28], formation of several different homotypic Itk dimers with differing subcellular localization and functions further complicates such analyses and their interpretation. Ourin silicoresults suggest that by enabling competing positive and negative IP4 induced
feedback, Itk PH domain oligomerization could render Itk signaling in DP thymocytes much more robust to parameter fluctuation between individual cells than could be achieved without Itk dimers, or without IP4 feedback. Models M1–M3
and M7 involving Itk dimers and IP4 feedbacks showed
substantially larger robustness than models lacking feedbacks (M5–M6) or containing only monomeric Itk (M4). M1–M3 and M7 can describe the experimentally observed PLCc1 kinetics with similar robustness. They differ only at the level of secondary Itk/ IP4/PIP3 interactions. Similar robustness and the inherent
variability of experimental data preclude the identification of one of these dimeric Itk feedback models as the only one operative
in vivothus far.
Materials and Methods
Signaling Kinetics in thein silicoModels
We constructed ODE based models. The ODEs described kinetics of concentrations of proteins and lipids in two well-mixed compartments representing plasma membrane and cytosol (Figure S1A). The biochemical signaling reactions for each model are shown in Tables S1–S7. The details regarding the construction of the ODEs and the parameters are given in the web supplement and Figure S1. We use the rule based modeling software package BioNetGen [69] to generate time courses for the species kinetics for the signaling networks described by models M1–M7. This program produces a set of ODEs corresponding to the mass-action kinetics describing biochemical reactions in the networks and solves them numerically using the CVODE solver [70]. The ODEs for each model are listed in the supplementary material.
Quantification of Robustness Based on the Maximum Entropy Principle
When a variablexcan assume multiple values and is distributed according to a probability distributionp(x), then the uncertainty associated with the distribution can be quantified by the entropy (S) defined as,
S~{
X
x
p(x) lnp(x) ð1Þ
S is non-negative and is maximized when x is distributed according to a uniform distribution (i.e., x can take any value within a range with equal probability). Supposep(x)is unknown, but we do know the average value of a variable,f, that is a function ofx, i.e., f = f(x). We can then maximize S under the constraint
X
x
f(x)p(x)~f ð2Þ
The constrained MaxEnt distribution is given by p(x) / exp(2lx), where the constant l, also knovnas the Lagrange multiplier, is determined by solving Eq. (2) forlwhen the above MaxEnt distribution forp(x) is used in Eq. (2). The method can be Table 2.Values of peak time, peak width, and asymmetry
ratio R calculated from the PLCc1 activation kinetics in Fig. 3 for different ligands.
Ligand
Peak time
(tp) (min)
Peak vidtg
(tw) (min) R
OVA 2.0 3.9 1.9
Q4R7 2.0 8.6 4.3
Q4H7 2.0 7.5 3.8
G4 2.0 4.3 2.1
Figure 4. Models containing Itk dimers and dueling feedbacks also show higher robustness for polyclonal T cells stimulated by anti-CD3 antibodies.PLCc1 phosphorylation kinetics inMHC2/2T cells stimulated by antibodies against (A) CD3 or (B) CD3 and CD4 at 1mg/ml versus 5mg/ml. (C) Variation of DKLwith R for thein silico modelsM1–M3 (blue, red and black, respectively), M7 (yellow), and M5–M6 (purple and maroon, respectively) at initial Itk (Itk0= 100 molecules) and PIP
3concentrations (PIP30= 370 molecules) attp= 1 min andAavg= 60 molecules, representing anti-CD3 stimulation at 5mg/ml. The orange bar indicates Rexpt. Note we useAavgto represent the amplitude Aexptin experiments measuring fold change in Itk phosphorylation (see the main text for further details). (D) Variation of DKLwith R for anti-CD3/CD4 stimulation at 5mg/ ml attp= 1 min andAavg= 80 molecules. The initial Itk (Itk0= 140 molecules) and PIP3concentrations (PIP30= 530 molecules) were used. The orange bar indicates Rexpt
. (E) and (F) show maps of the most robust models (with the lowest DKL) as RexptandA(shown asAavg) are varied for the same parameters as in (C) and (D), respectively.
easily generalized to accommodate multiple variables and constraints. We used the constraints imposed by tpexpt, Rexpt,
and Aexpt, or, tpexpt and Rexpt that are measured over a cell
population. Therefore, the MaxEnt distribution of the parameters in our calculation is given by,p({ki})/exp(2l1tp({ki}) –l2R({ki})
2 l3 A({ki})), where l1, l2 and l3 denote the Lagrange’s
multipliers, and {ki} denote the values of rate constants and initial
concentrations in individual cells. The Lagrange multipliers can be calculated from the constraint equations,
X
ki f g
tpðf gki Þp kðf gi Þ~texptp
X
ki f g
R kðf gi Þp kðf gi Þ~Rexpt
X
ki f g
A kðf gi Þp kðf gi Þ~Aexpt
ð3Þ
The MaxEnt distribution thus describes howtp, R, and A, in
individual cells are distributed over a cell population. The distribution also produces an estimation of the probability distributions for the rate constants and initial concentrations that regulatetp,R, andA, through the functionstp({ki}),R({ki}), and,
A({ki}), respectively. The specific relationship between the
parameters, {ki}, and the observables (tp,R, andA) is dependent
on the molecular details of the models, M1–M7. In all the models prior to the MaxEnt calculation, the rate constants were chosen from a uniform distribution with lower and upper bounds equal to 1/10 and 10 times, respectively, of the base values shown in Tables S1–S7. Similarly, the initial concentrations of proteins (e.g., Itk) and lipids (such as PIP3) were varied within a 35% [71] range
from uniform distributions centered at the base values shown in Table S8. The joint uniform distribution in the parameters is given by q({ki}). We then used these MaxEnt distributions to quantify
relative robustness of the models by calculating the Kullback-Leibler distance [59]
DKL~
X
ki f g
p kðf gi Þln½p kðf gi Þ=q kðf gi Þ ð4Þ
That is, for each model, we first find the probability distribution for the rate constants and initial concentrations that maximizes the entropy (robustness) for that model under the experimental constraints, giving the model a kind of ‘‘maximum benefit of the doubt.’’ We then compare the resulting MaxEnt models with one another to evaluate their relative robustness to variation in the rate constants, in order to select the model(s) most likely to correctly represent the actual kinetics. Whenp({ki}) is equal toq({ki}),DKL
assumes the minimum value 0; as the distribution p({ki}) starts
deviating from the uniform distribution, say by becoming sharply peaked around a particular value,DKLincreases. Thus
maximiz-ing the entropy S, is equivalent to minimizmaximiz-ingDKLin Eq. (4). The
calculations of DKL were done at a specific antigen dose which
fixed the average values of initial concentrations of Itk and PIP3.
Therefore, the robustness calculations did not exclude the sensitivity of PLCc1 activation to changes in PIP3concentrations
resulting from antigen dose variations. We calculatedp({ki}) by by
minimizing theDKLsubject to the constraints imposed by Eq. (3).
We usedDKLto rank order the models for a particular measured
value oftpexpt, Rexpt, and,Aavg. All the calculations were carried out
using MATLAB. Additional details can be found in the supplementary material (Figures S12–S15). Note that DKL is
unaffected by inclusion of additional parameters that do not influence the experimentally measured variables (Figure S21, Table S17). Thus having extra variables in a model does not in and of itself affect the relative robustness of models with variable numbers of parameters. We have used 100,000 sample points, which we have shown to be statistically sufficient in Figure S22 for the faithful calculation ofDKL.
Thymocyte Stimulation and Immunoblot Analysis All mice were housed in The Scripps Research Institute specific pathogen-free vivarium monitored by The Scripps Research Institute Department of Animal Resources. All animal studies were approved by The Scripps Research Institute IACUC and conform to all relevant regulatory standards.
DP cells were prepared as in [2] and rested at 37uC for 3 hours. Then, 107DP cells per sample were incubated on ice for 15 min with 2.4mM MHCI tetramers pre-loaded with either one of the altered peptide ligands OVA, Q4R7, Q4H7 or G4 [40], stimulated by rapidly adding 37uC warm PBS for the indicated times and quickly lysed in 100 mM Tris, pH 7.5, 600 mM NaCl, 240 mM n-octyl-b-D-glucoside, 4% Triton, 4 mM EDTA and a protease/phosphatase inhibitor cocktail (Roche). Lysates were cleared by centrifugation at 14000 rpm for 10 minutes at 4uC, resolved by SDS-PAGE and analyzed via immunoblot as previously described [2]. Band intensities were quantified via densitometry using NIH ImageJ software, and phosphoY783
-PLCc1 intensities normalized to total -PLCc1 amounts.
Supporting Information
Figure S1 (A) Details of the simulation box. We used L = 2mm,
l= 2 nm and d = 0.02mm for our simulations. (B) Graphical
networks describing the signaling reactions in models M1–M7.Itk shown in this figure represents an Itk molecule that is bound to the TCR and LAT signalosome (not shown). High affinity binding reactions are shown as green arrows. PIP2
hydrolysis into DAG and IP3 which ultimately produces IP4 (S)
is shown as red arrows. (M1) In model M1, both IP4and PIP3can
equally induce allosteric modifications of the PH domains in Itk dimers. (M2) Model M2. Similar to M1, however, modification of the PH domains by PIP3cannot stabilize IP4or PIP3binding to
the Itk PH domains. (M3) Model M3. Similar to M1, however, modification of the PH domains by PIP3can only stabilize IP4but
not PIP3binding to the Itk PH domains. (M4) Model M4. The Itk
PH domains are monomeric and unable to interact allosterically. IP4 or PIP3, upon binding with a weak affinity, instantaneously
changes Itk to a high affinity conformation (Itk*) where IP4(or
PIP3) can replace PH domain bound PIP3 (or IP4) with high
affinity. (M5) Model M5. Both IP4 and PIP3 bind to the PH
domains of the Itk dimer with low affinity. No allosteric modification occurs. (M6) Model M6. Similar to model M5 but Itk exists only in monomers. (M7) Model M7. Similar to M1, however, modification of the PH domains by PIP3 can only
stabilize PIP3but not IP4binding to the Itk PH domains.
(TIF)
Figure S2 Presence of Intrinsic fluctuations does not
lead to qualitatively different temporal profiles as compared with the deterministic model. We show 11 different stochastic trajectories for Itk0= 20 molecules and PIP3
0
Master equation associated with the signaling reactions (Table S3) using the Gillespie algorithm. The curve in red is the solution of the mass action kinetics given by a set of ODEs. We use the same kinetic rates and initial concentrations for the stochastic simula-tions and the ODEs.
(TIFF)
Figure S3 Comparison between the ODE solutions and
the stochastic trajectories averaged over a small num-ber of cells.We compared the temporal profiles of concentra-tions of PIP3 bound Itk obtained in simulations including
stochastic copy number variations due to intrinsic noise fluctua-tions (red) with the solufluctua-tions of the deterministic mass action reaction kinetics that ignored such fluctuations (solid black lines). The stochastic simulations were carried out by using Gillespie’s method which provided exact numerical solution of the Master equations associated with the models. We used the same rate constants and initial concentrations for the stochastic simulations and ODE solutions. The kinetic trajectories were averaged over 500 realizations (orin silico‘‘cells’’) for the stochastic simulations. We show the results for the smallest concentrations of Itk0 (20 molecules) and PIP30 (50 molecules) where the effect of the
stochastic fluctuations is expected to be the largest. (TIFF)
Figure S4 Variation of the peak value (A) with Itk0and PIP30for
all seven models. (TIFF)
Figure S5 Variation oftpwith Itk0and PIP30for all six
models. The peak time (tp) of the temporal profile of the
concentration of PIP3bound Itk varied by an order of magnitude
(roughly from 1 min to 10 mins) in models M1–M4 and M7, while the peak time did not change appreciably in models M5 and M6 over the entire range of variation. However,tp did not vary
appreciably over a large range of initial Itk (.100) and PIP3
concentrations (.150) even in the models M1–M4 and M7. Most of the large variations occurred at small concentrations of Itk and PIP3.
(TIFF)
Figure S6 Estimation of the reaction rates in the
effective binding-unbinding reaction. A) The transient kinetics of PIP3bound Itk in M3 (red) is compared with the case
when the negative feedback is removed (black). We uset1/2and
the steady state concentration of the kinetics of PIP3bound Itk in
the absence of the negative feedback to calculate the rates in the effective binding-unbinding reaction 1. B) Kinetics of PIP3bound
Itk in the absence of the negative feedback in model M3 (black). Blue, kinetics of PIP3 bound Itk in the corresponding binding
unbinding process where thet1/2and the steady state
concentra-tion of PIP3bound Itk is exactly the same as the black curve. (See
Text S1) (TIFF)
Figure S7 Variation of KD as a function of the sum of
Itk0and PIP
30for models M1 to M4.The KDfor the binding
unbinding process has been estimated using the steady state values of the Itk kinetics in presence of the positive but not negative feedback. For models M1–M3, KDdoes not change significantly
with increasing concentrations of initial Itk and PIP3. The value of
KDis much smaller than the sum of (Itk0+PIP30) as well. For M4
however, KD increases significantly (by an order of magnitude).
The absolute value of the KDis still a lot less than (Itk0+PIP30).
(TIFF)
Figure S8 Variation of k1as a function of the sum of Itk0
and PIP3 0
for models M1 to M4.k1decreased roughly 2 fold with the increase in Itk0 and PIP30 for M1 and M3, while, for
model M2, k1 increased 4 times. In M4, k1 did not change appreciably.
(TIFF)
Figure S9 The saturation of the width in the feedback
models.A) We have varied both Itk0and PIP30such that PIP30
$Itk0. The plot of the width of PIP3bound Itk as a function of
(Itk0+PIP30) is shown for M1 (black line) and M2 (red line). For
large values of (Itk0+PIP30) the width saturates (the orange oval)
both for M1 and M2. For M2 however the rate of decay of the width of Itk – PIP3kinetics is much faster than for M1 as can be
seen from the fact that the red curve decays from roughly 12 mins to 3 mins where as the black curve goes down from 7 mins to 5 mins. B) The transient activation kinetics of the membrane bound Itk in M1 are shown in black. PIP3
0
= 500, Itk0= 200. The dotted red curve is the exponential decay curve of the form e2kt with the time constant equal to the inverse of the high affinity PIP3
unbinding rate. (TIFF)
Figure S10 A large concentration of IP4 is required to
replace PIP3in models M5–M6.A) Variation of the steady state xs(Itk-PIP3) as a function of initial substrate (PIP2) concentrationS0
when the KD= 2000. B) Variation of the steady statexsas a function of
initial substrate concentrationS0
when the KD= 200.
(TIFF)
Figure S11 A large concentration of IP4 is required to
replacePIP3in model M4.A) Variation of the steady statexs (Itk-PIP3) as a function of initial substrate (PIP2) concentrationS0
when the KD= 2000. B) Same as in A) for KD= 200.
(TIFF)
Figure S12 The histograms for Randt as the
param-eters are varied in all 7 models for moderately low initial concentrations of Itk0 and PIP
30. All the rate
constants are varied by two orders of magnitude with the constraint KDlow=a KDhigh. For M1–M3, a is distributed
uniformly over 1 to 4000 while for M7 it is distributed uniformly over 1 to 50. The initial concentrations of species involved are varied in a 35% window about the base value of Itk0= 40, PIP30= 130 and PIP20= 17000.
(TIFF)
Figure S13 The histograms for R and tas the
param-eters are varied in all 7 models for moderately high initial concentrations of Itk0 and PIP
30. All the rate
constants are varied by two orders of magnitude with the constraint KDlow=a KDhigh. For M1–M3, a is distributed
uniformly over 1 to 4000 while for M7 it is distributed uniformly over 1 to 50. The initial concentrations of species involved are varied in a 35% window about the base value of Itk0= 100, PIP3
0
= 370 and PIP2 0
= 17000. (TIFF)
Figure S14 The histograms for R and tas the
param-eters are varied in all 7 models for high initial concentrations of Itk0 and PIP3
0
. All the rate constants are varied by two orders of magnitude with the constraint KD
low
=a KDhigh. For M1–M3, a is distributed uniformly over 1 to 4000
while for M7 it is distributed uniformly over 1 to 50. The initial concentrations of species involved are varied in a 35% window about the base value of Itk0= 140, PIP30= 530 and PIP20= 17000.
Figure S15 Checkerboard plot of the most robust models for different ligand affinities as Ravg and Aavg are varied for a fixedtavg= 2 mins.a) Plot of the most robust
models for Itk0= 140 and PIP30= 530 molecules. b) The same plot
as a) for Itk0= 100 and PIP3 0
= 370 molecules. c) Same plot as a) for Itk0= 40 and PIP30= 130 molecules. d) The same plot as a) for
Itk0= 20 and PIP30= 50 molecules.
(TIFF)
Figure S16 Plots of the relative robustness of all the 7
models for a specific Aavgfor different ligand affinities as Ravgis varies for a fixedtavg= 2 mins.a) For Itk0= 140
and PIP30= 530 molecules the DKL is shown for an Aavgof 40
molecules. b) The same plot as a) for Itk0= 100 and PIP30= 370
molecules when the Aavgis held fixed at 20 molecules. c) Same plot
as a) for Itk0= 40 and PIP30= 130 molecules when Aavg= 10
molecules. d) The same plot as a) for Itk0= 20 and PIP30= 50
molecules when Aavg= 3 moelcules. The orange vertical bar in all
the plots show the experimentally observed value of Ravg.
(TIFF)
Figure S17 The effect of Lck mediated phosphorylation
of Itk-PIP3 on the relative robustness of M1–M7.Upper
panel (left most corner): For Itk0= 100 and PIP30= 370 the most
robust models are shown as amplitude and the ratio of the Itk-PIP3
kinetics are varied in presence of the Lck mediated phosphory-lation of membrane recruited Itk at its Y511 residue. The average peak time is held at 2 mins. Upper panel (right most corner): The same plot without any Lck mediated activation. Lower panel (left most corner): The relative robustness of the models M1–M7 for an amplitude average of 20 molecules in presence of Lck mediated activation of Itk. Lower panel (right most corner): Same plot without the explicit Lck mediated activation.
(TIFF)
Figure S18 Kinetics of induction of PLCc1
phosphory-lation represented as the fold increase over non stimulated cells using total PLCc1 protein as a loading control.
(TIFF)
Figure S19 Checkerboard plot of the most robust
models as Ravg and Aavg are varied for different doses of anti-CD3 and anti-CD3/CD4 antibodies. a) Itk0= 40 and PIP3
0
= 130 molecules are used to emulate the 1mg/mL anti CD3 stimulation. The tavgis held at 1 mins. The checkerboard
diagram of the most robust models is shown as Ravgand Aavgare
varied. b) Same as plot a) but Itk0= 100 and PIP30= 370 molecules
are used as the initial concentrations. c) Itk0= 100 and PIP3 0
= 370 molecules are used to emulate the 1mg/mL anti CD3/CD4 stimulation. Thetavgis held at 5 mins. The checkerboard diagram
of the most robust models is shown as Ravgand Aavgare varied. d)
Itk0= 140 and PIP30= 530 molecules are used to emulate the
5mg/mL anti CD3/CD4 stimulation. Thetavgis held at 1 mins.
The checkerboard diagram of the most robust models is shown as Ravgand Aavgare varied.
(TIFF)
Figure S20 The plot of DKL for all the 7 models for a
specific amplitude and different initial conditions for different doses of anti CD3 or anti CD3/CD4 antibodies. a) Itk0= 40 and PIP3
0
= 130 molecules are used to emulate the 1mg/mL anti CD3 stimulation. Thetavgis held at 1 mins. The
DKLis shown for an Aavg= 16 molecules. b) Same as plot a) but
Itk0= 100 and PIP3 0
= 370 molecules are used as the initial concentrations and Aavg= 60 molecules. c) Itk0= 100 and
PIP30= 370 molecules are used to emulate the 1mg/mL anti
CD3/CD4 stimulation. The tavg is held at 5 mins. Aavg= 60
molecules. d) Itk0= 140 and PIP30= 530 molecules are used to
emulate the 5mg/mL anti CD3/CD4 stimulation. Thetavgis held
at 1 mins and Aavg is set equal to 80 molecules. The vertical
orange bar shows the observed experimental values. (TIFF)
Figure S21 Addition of parameters which weakly affect
the Itk-PIP3 kinetics, do not lead to any significant difference in the DKL. For Itk0= 100 and PIP3
0
= 370, a) we have looked at the relative difference in the DKLof our old M3
(black) and M3 with the added reactions (magenta) for an amplitude average of 30 molecules and peak time average of 2 mins. b) We have looked at the relative difference in the DKLof
our old M3 (black) and M3 with the added reactions (magenta) for an amplitude average of 40 molecules and peak time average of 2 mins.
(TIFF)
Figure S22 The sample set of 100,000 is a good sample
size.We show the DKLof M1–M7 for Itk0= 100 and PIP30= 370
for a) 20,000 realizations and b) 100,000 realizations when the amplitude average is 20 molecules and the peak time average is 2 mins. The KL distances are identical.
(TIFF)
Figure S23 DKL without the constraint on amplitude.
LowerDKL values (shown in log10 scale) denote higher robustness for any given Ravg. Based on the data in Fig. 4, the average peak time was fixed at 2 mins in all cases. Experimentally measured Ravg values are indicated by vertical orange lines. (A) Robustness for models M1–M3 and M5–M6 at high initial Itk (Itk0 = 140 molecules) and PIP3 concentrations (PIP30 = 530 molecules), simulating high-affinity OVA stimulation. M2 appears most robust in the experimentally observed Rave range. M4 fails produce any R value in the range investigated here. (B) M2 shows maximal robustness for moderate concentrations of initial Itk ( = 100 molecules) and PIP3 ( = 370 molecules), simulating Q4R7 stimulation. (C) For lower values of Itk0 ( = 40 molecules) and PIP30 ( = 130 molecules), simulating Q4H7 stimulation, M1–M3 are most robust with similarDKL values in the experimentally observed Rave range. (D) For low initial concentrations of Itk (Itk0 = 20 molecules) and PIP3 (PIP30 = 50 molecules), simulating stimulation by the low affinity peptide G4, M1–M3 are again most robust inthe experimentally observed Ravg range. Models M4– M6 fail to produce any value of R in the range investigated here. Model M7 is not shown.
(TIFF)
Table S1 Reactions and rate constants for model M1.
(DOCX)
Table S2 Reactions and rate constants for model M2.
(DOCX)
Table S3 Reactions and rate constants for model M3.
(DOCX)
Table S4 Reactions and rate constants for model M4.
(DOCX)
Table S5 Reactions and rate constants for model M5.
(DOCX)
Table S6 Reactions and rate constants for model M6.
(DOCX)
Table S7 Reactions and rate constants for model M7.