Introduction
Vancomycin is a glycopeptidic antibiotic very efficient against a number of gram positive microorganisms, inhibiting the synthesis of the bac-terial wall [1,2]. It is produced by the fermentation of the Actinobacteria species Amycolatopsis orien-talis formerly Nocardia orienorien-talis [3]. Its molecule shows a complex tricycle structure containing amino acids and sugars [4,5]. It was discovered in 1956 and its use in medicine began in 1959, after researches developed by the Laboratories Lilly in the United States [5]. Problems with vancomycin use, resulting in the clinical treatments via par-enteral, are related to its nefrotoxicity, neurotoxici-ty and auditive damages [6].
The use of vancomycin was inhibited in the years 1960 and 1970 as the discovering of semi-synthetic varieties of penicillin which were
presenting smaller side effects. With the appear-ance of resistant microorganisms in the years 1980, and with the improvement of the processes of preparing and purifying, vancomycin acquired again an important role in the combat to the sys-temic staphylococcic infections in allergic patients to penicillin and in infections caused by staphylococci resistant to methicillin. It presents efficacy, administrated orally, to the combat of Clostridium difficile, responsible for colitis that resulted from the use of antibiotics [1,2,7,8].
There are, in the literature, several meth-ods for the determination of vancomycin in bio-logical fluids and in pharmaceutical products [9], however only few spectrophotometric methods are reported for the analysis of vancomycin. Recently we proposed a green and simple spec-trophotometric batch procedure based in the reac-tion of this antibiotic with ions copper (II) in www.scielo.br/eq
www.ecletica.iq.unesp.br
Volume 33, número 2, 2008
Flow injection analysis of vancomycin
M. M. D. C. Vila1, A. A. Salomão2, M. Tubino*,2 1Curso de Farmácia, Universidade de Sorocaba, Sorocaba, SP, Brazil
2Instituto de Química, Universidade de Campinas, Caixa Postal 6154, 13083-970, Campinas, SP, Brazil *[email protected]
Abstract: A flow injection method for the quantitative analysis of vancomycin hydrochloride,
C66H75Cl2N9O24.HCl (HVCM), based on the reaction with copper (II) ions, is presented. HVCM forms a lilac-blue complex with copper ions at pH≅4.5 in aqueous solutions, with maximum absorption at 555 nm. The detection limit was estimated to be about 8.5×10⁻⁵ mol L-1; the quantitation limit is about 2.5×10⁻⁴ mol L-1and about 30 determinations can be performed in an hour. The accuracy of the method was tested through recovery procedures in presence of four different excipients, in the proportion 1:1 w/w. The results were compared with those obtained with the batch spectrophotometric and with the HPLC methods. Statistical comparison was done using the Student’s procedure. Complete agreement was found at a 0.95 significance level between the proposed flow injection and the batch spectropho-tometric methods, which present similar precision (RSD: 2.1 % vs. 1.9%).
ethanol/water solution [10]. In this opportunity we are reporting a green flow injection analysis (FIA) procedure where it was used the same reac-tion of the antibiotic with copper, but now in aqueous solution. As it is known, FIA methods present some interesting qualities as, for instance, high analytical frequency, low cost and use of small aliquots [11].
Experimental Materials
All the reagents used in this work were of analytical grade except the vancomycin hydrochlo-ride, a pharmaceutical certificated product with 96.8 % purity, gently furnished by the Laboratório Antibióticos do Brasil Ltda. Distilled water was obtained from a glass distiller device.
Solutions
Vancomycin solutions: were daily prepared dissolving 0.7670 g of the 96.8 % purity van-comycin hydrochloride in 50 mL of distilled water, in order to obtain a 1.00 ×10⁻² mol L–1 concentra-tion. From this solution, by appropriate dilutions, the other solutions of the antibiotic were prepared. Copper acetate: 0.5989 g of Cu(CH3COO)2.H2O in 100.0 mL of water in order to obtain a 3.00?10-2mol L-1solution.
Influence of excipients
Despite the fact that vancomycin is more used in the pure form, in order to test the recovery from samples, it was studied the influence of four common excipients, in the proposed method. Aliquots of 1.0 g of vancomycin were separately mixed with 1.0 g of each one of the following excip-ients: starch, cellulose, lactose or silica. These mix-tures were carefully triturated and homogenized in a mortar and then kept in closed glass flasks.
The sample containing lactose, as this excipient is soluble, was dissolved directly in water. Aliquots of about 145 mg, exactly weighed to 0.1 mg, were dissolved and diluted to 10.0 mL in a vol-umetric flask. In the cases of the non soluble (silica and cellulose) or partially soluble (starch), the aliquot was dissolved in 2 mL of water in a glass test tube, following vigorous manual shacking
dur-ing 1 minute and centrifugation for 3 minutes at 3000 rpm. The supernatant was separated with the aid of a pipette and put in a 10.0 mL volumetric flask. This operation was repeated twice. The vol-ume in the volvol-umetric flask was completed with water to the mark. These solutions presented a con-centration of about 5×10⁻³mol L-1of vancomycin hydrochloride and they were used for the proposed method and HPLC method [12].
Apparatus
Spectrophotometers-UV-Vis Pharmacia Biotech Ultrospec 2000 to obtain the spectra. Femto model 600S to perform the analyses.
Cells - All the measurements were made with Hellma glass cells of 1.000 cm of path.
HPLC - Waters 600 E with UV-Vis Waters 484 detector.
pHmeter - Analyser pH 300.
Centrifuge - Fanem Excelsa II Model 206 BL.
Peristaltic pump - Cole Parmer Masterflex L/S model 7519-25.
Magnetic stirrer - IKA model tab disc. Magnetic mixer – Previously described [13]. Potentiometric recorder - Linear model 92425.
Sample valve – Previously described [14]. Polyethylene tubes – 1 mm i.d.
Tygon® tubes - (1.75 mm i.d. - Ismatec Two –Stop / Blue- Gren).
Methods
Flow injection
The method is based on the spectrophoto-metric detection of a colored complex formed between vancomycin and ions copper (II) [15]. The flow injection manifold is depicted in figure 1. The aqueous solutions of vancomycin (pH≅
3.5) were mixed with the reagent solution, copper (II) acetate aqueous solution (pH ≅ 6.0), in the mixer with magnetic stirring. The resulting solu-tion, containing the complex, presents a pH ≅4.5.
HPLC experiments were performed on a HPLC Waters 600E with UV-VIS Waters 484 detector operated at 280 nm, injector Rheodyne and interface Waters 746. The column used was a C18Nova Park25 cm ? 4.6 mm i.d. The mobile phase, consisted of acetonitrile: triethylamine: buffer (7:1:92), was pumped at a flow-rate of 1 mL min-1. The buffer was prepared with 4 mL of triethylamine in 2 liters of water; the pH was adjusted to 3.2 with phosphoric acid. The cali-bration curve was constructed between 1.0×10⁻⁵ mol L-1and 5.0×10⁻⁴mol L-1of vancomycin.
Results and discussion
The method is based on the measurement of the absorbance of the complex formed between vancomycin and copper (II) ions. The maximum absorption occurs at 555 nm [10]. For this work 525 nm was selected to monitor the sig-nal in order to avoid the small absorption of the copper (II) acetate at 555 nm. The adoption of this wavelength means a decrease of about 10% in the absorbance signal fact that is counterbal-anced by the absence of the small interference by the residual copper (II) acetate solution.
The optimization of the molar proportion copper: vancomycin was studied and the mini-mal relation 3:1 was found to be adequate as it
Figure 1. Scheme of the flow manifold used. A1 = flow of water; A2 = flow of water; R = introduction of the copper (II) solution 3.0×10⁻² mol L-1; S = introduction of vancomycin solution 1.0×10⁻²mol L-1; Flow rate A1 = flow rate A2; B = peristaltic pump; W = waste; RI = reagent injection loop; SI = sample injection loop; V = sampling valve [4,5]; M = mixer with stirring; L = reaction bobbin (50 cm); E = spectrophotometer; RE = chart recorder.
was observed an enough high analytical signal with none interference from the excess of cop-per (II) acetate. Therefore this relation was adopted in this work.
It was used ethanol-water solution in the batch method [10] in order to avoid the precipita-tion of the copper-vancomycin complex and to increase its absorbance in the visible region of the spectrum (555 nm). In the present case, however, as the flow method conducts the complex to the detector immediately after the reaction, no precip-itation was observed. Also, the molar absorbance in water solution is quite enough for the analysis of pharmaceutical products. Therefore, in order to obtain a greener method even ethanol was avoid-ed. In the batch method it was also necessary to adjust the pH at about 4.5 with acetic acid/acetate buffer in order to optimize the reaction mainly in the case of vancomycin base. In the present case however, working only with the main form of van-comycin, i.e., the hydrochloride (HVCM) and with copper (II) acetate, the final pH falls in the optimal region, between 4 and 5. Therefore, the buffer was not added in for minimizing the use of reagents.
Parameters as flow rate, aliquot volume and volume of the copper (II) acetate solution were also studied. As it was used a mixer with magnetic stirring that causes complete mixing of the solutions and increases the residence time due to its volume (113 µL), the length of the reac-tion bobbin showed to be not important and 50 cm was the size chosen for the connection to the flow cell in the spectrophotometer. Equal flow rates were used for the two lines, one for the aliquot and the other for the reagent.
The influence of the total flow rate was studied from 1.3 mL min-1to 3.0 mL min-1. Only a small decrease of the signal occurred in going from 1.3 mL min-1to 2.0 mL min-1. After this flow rate a rapid decrease was observed. Therefore the flow rate of 2.0 mL min-1 was adopted for this work, combining signal intensity with analytical frequency.
same intensity beyond this volume. Therefore, for the aliquots, 150 µL was used in this work.
The influence of the volume of the reagent solution was studied form 50 µL to 250 µL. As expected, an important increase of the sig-nal was observed with the rise of the volume of the reagent but only up to 200 µL. With 250 µL only a small increase of about 2% occurred. The volume of 200 µL was adopted.
Therefore, the following conditions were used in the flow system: total flow rate 2.0 mL min-1; aliquot volume 150 µL; reagent solution volume 200 µL; length of the connection tube from the mixer to the spectrophotometric cell 50 cm; minimal molar proportion of the solutions copper (II) vancomycin 3:1. The experiments were all done at the room temperature (mean of 25 oC). The calibration curve was obtained using vancomycin hydrochloride solutions from 1.0×10⁻³ mol L-1 to 5.0×10⁻³ mol L-1. The calibra-tion curve is described by the equacalibra-tion h=0.50+3532C, (R= 0.995) where h is the signal height in centimeters (1 cm = 0.8 mV) and C the antibiotic concentration.
The detection limit was estimated to be about 8.5×10⁻⁵ mol L-1; the quantitation limit is about 2.5×10⁻⁴ mol L-1.
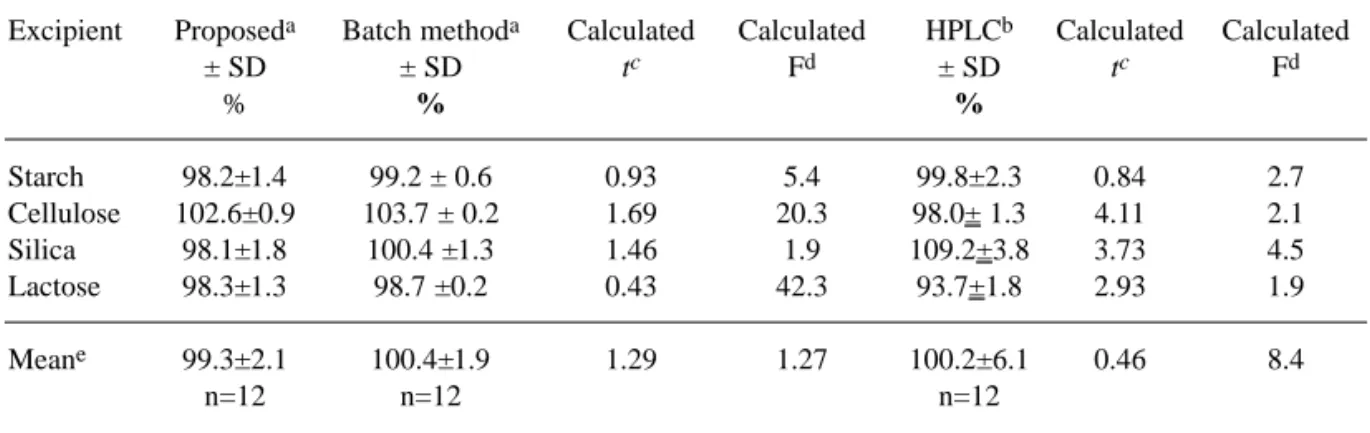
Usually vancomycin hydrochloride is applied in the pure form, therefore, pharmaceu-tical preparations of this antibiotic are not com-mon. In order to check the performance of the proposed method with respect to the recovery in presence of excipients, it was tested in presence of four different excipients; lactose, starch, sili-ca and cellulose in the proportion 1:1 w/w. The results of those recovery experiments are shown in table 1 together with the results obtained with the batch [10] and with the HPLC method [12]. In the three methods the extraction of van-comycin from the sample was performed in the same way, i.e., according to the procedure described above in the experimental section. In the HPLC method, however, those solutions were diluted in order to obtain a final concentra-tion of about 1.0×10⁻⁴mol L-1, adequate to be introduced in the chromatograph. From this point each method was performed using the spe-cific procedure.
Table 1. Vancomycin hydrochloride recovery from samples containing pharmaceutical excipients. Comparison between the results obtained with the proposed, with the batch [10] and with the HPLC method [12] using the sta-tistical Student’s t test and the F test.
Excipient Proposeda Batch methoda Calculated Calculated HPLCb Calculated Calculated
± SD ± SD tc Fd ± SD tc Fd
% % %
Starch 98.2±1.4 99.2 ± 0.6 0.93 5.4 99.8±2.3 0.84 2.7
Cellulose 102.6±0.9 103.7 ± 0.2 1.69 20.3 98.0± 1.3 4.11 2.1
Silica 98.1±1.8 100.4 ±1.3 1.46 1.9 109.2±3.8 3.73 4.5
Lactose 98.3±1.3 98.7 ±0.2 0.43 42.3 93.7±1.8 2.93 1.9
Meane 99.3±2.1 100.4±1.9 1.29 1.27 100.2±6.1 0.46 8.4
n=12 n=12 n=12
aProposed and batch methods: HVCM concentrations in the final solution before reacting with copper (II) were 5.0×10⁻³mol L-1.
bHPLC method: HVCM concentration after extraction was 2.1×10⁻³ mol L-1; this solution was diluted to 1.0×10 -4 mol L–1to be injected in the chromatograph.
cTheoretical Student’s t = 2.78 (α=0.05) and 4.60 (α=0.01) for the degree of freedom ν= 4 (ν= n
1+ n2-2); n1= n2= 3. dTheoretical F = 19.00 (α=0.05) and F = 99.00 (α=0.01) (ν
1=ν2=2) [17]. eFor (ν
In table 1, in order to give an idea of the average result, independently of the used excipi-ent, the means of the recoveries were calculated for the three methods and for the four different excipients. Comparing the results obtained with the proposed method with that of the batch method, based on the Student’s t test [17], they can be considered statistically equal for the 0.95 (a=0.05) significance level. The F test shows a small difference with respect to the precision for a=0.05 for the samples containing cellulose and lactose but, in the 0.99 (a=0.01) significance level there is concordance in all cases. For the means, complete concordance is observed for the 0.95 significance level.
Comparing the results obtained with the flow method with those obtained with HPLC, based on the Student’s t values only in the case of starch is observed concordance for the 0.95 (α=0.05) significance level. The F test shows agreement between the methods in terms of pre-cision. For α=0.01 both Student’s t and F test show that there is statistical equivalence between the two methods.
If it is considered that a tolerance of 5% in the precision of the quantitative analysis of vancomycin is allowed (18), complete coherence among the three methods is observed.
In order to test the specificity of the method [19] some aliquots (ca. 75 mg) of the samples were submitted to stress conditions with heating: base (0.1 mol L-1 NaOH); oxidant (3% H2O2 w/v); acid (0.1 mol L-1 HCl); water. Vancomycin chloridrate was dissolved in the respective medium and the obtained solutions were heated to 80 oC for 30 minutes. After this treatment the obtained solution was mixed with copper (II) acetate solution according to the
explained above in samples treatment. In all cases no reaction was observed.
Conclusion
The proposed method, applied to pure vancomycin hydrochloride or in presence of starch, lactose, cellulose or silica, offers analyti-cal quantitative results of good precision and accuracy; it can be considered a green procedure as it avoids the use of organic solvent and of potentially toxic reagents; the used volumes are relatively small; it is very simple to be per-formed; the instrumentation used is of relatively low cost; the results can be obtained in about 3 minutes for the bulk antibiotic (in comparison with 20 minutes in HPLC method), including the dissolution of the aliquot, or in about 9 minutes, including the extraction procedure in presence of the excipients; in the flow system about 30 deter-minations can be performed in an hour. Based on these results the method can be recommended for the quantitative analysis of HVCM in the condi-tions presented in this article.
Acknowledgments
The authors are grateful to CAPES, Coordenação de Aperfeiçoamento de Pessoal de Nível superior, to CNPq, Conselho Nacional de Pesquisa Científica e Tecnológica, and to FAPE-SP, Fundação de Amparo à Pesquisa do Estado de São Paulo, for the financial support.
M. M. D. C. Vila; A. A. Salomão; M. Tubino. Análise de vancomicina por injeção em fluxo.
Resumo: Este trabalho apresenta um método de análise por injeção em fluxo para determinação
quan-titativa de cloridrato de vancomicina, C66H75Cl2N9O24.HCl (HVCM), baseado na reação com íons cobre (II). ? HVCM na presença de íons cobre, em pH≅4,5 e solução aquosa forma um complexo azul-lilás, com absorção máxima em 555 nm. O limite de detecção estimado foi de 8.5×10⁻⁵ mol L-1; e o limite de quantificação de 2.5×10⁻⁴ mol L-1com cerca de 30 determinações por hora. A exatidão do método foi determinada através de ensaio de recuperação na presença de quatro diferentes excipientes na proporção de 1:1 p/p. Os resultados do método espectrofotométrico por injeção em fluxo foram comparados com resultados obtidos pelo método espectrofotométrico por batelada e por HPLC, através de método estatístico t de Student. Obteve-se completa concordância com nível de significância de 0,95 e similar precisão (RSD: 2,1 % vs. 1,9%).
Palavras-chave: vancomicina; análise por injeção em fluxo; espectrofotometria; íons de cobre II.
References
[1] W.Tavares, Manual de Antibióticos e Quimioterápicos Antiinfecciosos, Atheneu, São Paulo, 3ª ed., 2001. [2] G. P. Silveira, F. Nome, J. C. Gesser, M. M. Sá, H. Terenzin, Quím. Nova 29 (2006) 844.
[3] E. Haghedooren, J. Diana, B. Noszál, J. Hoogmartins, E. Adams, Talanta 71 (2007) 31.
[4] D. H.Williams, J.R. Kalman, J. Am. Chem. Soc. 99 (1976) 2768.
[5] G. M. Sheldrick, P. G. Jones, O. Kennard, D. H. Willians, G.A. Smith, Nature 27 (1978) 223.
[6] S. Davani, P. Muret, B. Royer, B. Hoen, J.P. Kantelip, Ann. Biol. Clin. 60 (2002) 655.
[7] A. Srinivasan, J. D. Dick, T.M. Perl, Clin. Microbiol. Rev. 5 (2002) 430.
[8] D. S. Marinho, Vancomicina, estudo de utilização com ênfase em suas reações adversas, MSc Thesis, Fiocruz, Rio de Janeiro, RJ, 2006.
[9] M.M.D.C.Vila, R.M.V. Oliveira, M.M. Gonçalves, M.
Tubino, Quím. Nova 30 (2007) 395.
[10] A. Rodrigues Junior, M.M.D.C. Vila, M. Tubino, Anal. Lett. 41(2008) 822.
[11] B. F. Reis, Quím. Nova 12 (1989) 82.
[12] G. Lunn, Methods for Pharmaceutical Analysis, John Wiley & Sons Inc, New York, v. 4, 2000, p.1630-1631. [13] M.Tubino, M. M. D.C. Vila, J. Flow Injection Analysis 23 (2006) 112.
[14] M. Tubino, F. Barros, Quím. Nova 14 (1991) 49. [15] C. Chabenat, D. Andre, P. Boucly, Talanta 30 (1983) 963. [16] U.S. Pharmacopoeia, Pharmacopoeial Convention, Inc Rockville, MD, 28th ed., 2005, p. 2013-2015.
[17] K. Eckschlager, Errors, Measurement and Results in Chemical Analysis, Van Nostrand Reinhold Company, London, 1972, p. 109-120.
[18] Brasil, Ministério da Saúde, ANVISA, Agência Nacional de Vigilância Sanitária Resolução RE nº 899, May, 29th, 2003.