Daniel Motter
Jairo Vinícius Lavarda
Felipe Aguiar Dias
UNIOESTE – Western Paraná State University Centro de Engenharias e Ciências Exatas 85870-900 Foz do Iguaçu, PR, Brazil
Samuel da Silva
Member, ABCM [email protected] UNESP – Univ. Estadual Paulista Faculdade de Engenharia de Ilha Solteira Departamento de Engenharia Mecânica Av. Brasil, 56 15385-000 Ilha Solteira, SP, BrasilVibration Energy Harvesting Using
Piezoelectric Transducer and
Non-Controlled Rectifiers Circuits
Vibration energy harvesting with piezoelectric materials is of practical interest because of the demand for wireless sensing devices and low-power portable electronics without external power supply. For practical use of vibration energy harvester with piezoelectric materials, it is necessary to process the alternating current (AC) by using different rectifiers’ circuits in order to charge batteries with direct current (DC) or to feed electronic devices. Unfortunately, most of the models used focused on simplifying the energy harvesting circuit into a simple resistive load. In the real-world applications, the energy harvesting external circuit is more complex than a simple load resistance. In this sense, the goal of the present paper is to describe a comprehensive strategy for power harvesting device to estimate the output power provided by a cantilever beam with the electrodes of the piezoceramic layers connected to a standard rectifier circuit. The true electrical components were considered in the full-wave rectifier circuit with four diodes in bridge. A very simple and comprehensive description for choosing the capacitance and resistance loads is provided. In order to illustrate the results, numerical simulations and experimental verifications are also performed to ensure the accuracy. All tests and results are described and detailed using Matlab, the SimPowerSystem toolbox of the Simulink and an experimental setup.
Keywords: smart structures, piezoelectric transducers, energy harvesting, rectifier circuit
Introduction
The piezoelectric materials, in special PZTs, have been largely used as mechanisms to convert ambient motion, usually vibration, into electrical energy that may be stored or used directly to provide power to other devices, e.g. mobiles, portable electronics or wireless sensors networks (Sodano et al., 2004b; Pereyma, 2007; Anton and Sodano, 2007). These examples represent a huge potential for commercial applications in different areas as presented in recent market researches (IDTechEx, 2010). Structural health monitoring applications are one of the most benefited areas with devices for power harvesting. An interesting application is given by Starner and Paradiso (2004), who discuss the possibility of using alternative sources of vibration, such as the vibration of human breath captured through PZT in the human chest, and even recovery energy of blood pressure or provided by vibration when a person walks with shoes bonded with PZTs patches. Another very interesting study is the use of mechanical vibration caused by a raindrop when it touches the surface (Guigon et al., 2008a,b). The experimental results validated a theoretical predictive model when the rain drops were at low speed. For high velocities of raindrop, the results differed because of an effect called splash, i.e. the drops result from a raindrop crashing against the piezoelectric ceramics.
An important stage to develop a practical design in an energy harvesting device is to model correctly the dynamical behavior of the integrated system composed of mechanical structure, in general a clamped beam, electromechanical coupling between the PZTs and the mechanical system, and, finally, the electrical load attached to the device (Sodano et al., 2004a). However, the multidisciplinary nature of this field has caused some modeling problems. Erturk and Inman (2008) presented some considerations about the oversimplified, incorrect physical assumptions and mistakes in analytical modeling of piezoelectric energy harvesters. The authors clarified through improved models with lumped and distributed parameters, besides presenting a good overview of the numerical and analytical modeling of electromechanical systems for power harvesting. The spotlight in this strand of papers about piezoelectric energy harvesting models, as for example Sodano et al. (2004a),
Liao and Sodano (2008, 2009), De Marqui Jr. et al. (2009), is to study the maximum power that can be dissipated in a simple resistor or combination of linear electrical elements. The most part of these models focused on simplifying the energy harvesting circuit by a simple resistive load, but in the real-world applications, the energy harvesting circuit attached is more complex than a simple resistor. Thus, few information about the interaction between practical rectifiers circuits, used to transform alternating current (AC) into direct current (DC), and the electromechanical devices attached are discussed clearly. On the other hand, the members of the research community in power electronics focus on the developing non-linear electronic models by using diodes, transistors, synchronized switch, etc. (Lefeuvre et al., 2006, 2007; Guan and Liao, 2007). For example, Liu et al. (2009) provided an analytical and graphical analysis equation relating the output power with the efficiency of the rectifier circuit, which shows how important is the step of rectifying and storing the electrical charge. Wickenheiser and Garcia (2010) observed that the full-wave rectifier has a smoothing capacitor to provide a tension approximately constant over the load. A Synchronized Switch Harvesting (SSH) has also been analyzed in the area of energy harvesting with PZT sensors. Also, a Synchronized Switch Harvesting on Inductor (SSHI) has been developed, taking up to 160% efficiency over standard rectifier (Lallart and Guyomar, 2008). Other studies show the possibility of using inductors for switching (Ammar and Basrour, 2006). These techniques of circuit switched consider that the frequency is constant with sinusoidal signal. However, there is a lack of studies concerning circuit switched with electrical noise, where the non-controlled rectifier circuits have advantages.
necessary to use a distributed parameter model so that considers multiple vibration modes (Erturk and Inman, 2008).
The aim of this paper is to evaluate and compare the experimental results and the results provided by a theoretical model of a full-wave diode bridge attached directly to the electromechanical cantilever beam with base excitation to cause transverse vibrations. A very simple and comprehensive description for choosing the capacitance and resistance loads is provided seeking practical application. All numerical tests and results are described and detailed by using the Matlab and the SimPower System toolbox of the Simulink. The experimental setup is driven through the use of a DSpace 1104 data acquisition with Control Desk. In order to show some features, it is provided a number of simulations to illustrate the approaches. At the end, the final remark presents suggestions for further research.
Nomenclature
Ec = energy stored, J C = capacitance, F i = current, A ID = diode current, A Lb = length of the beam, mm Lp1 = length of the PZT1, mm Lp2 = length of the PZT2, mm
rd = internal resistance of the diode, ohms R = resistance, ohms
P = power, W q = electric charge, C tb = thickness of the beam, mm tp = thickness of the PZT, mm v0 = voltage in steady state, V w = width of the beam or PZT, mm
Greek Symbols
= permittivity of PZT, C²/Nm²] = time constant, s
Subscripts
Avg = relative to average AC = relative to alternate current b = relative to beam
DC = relative to direct current L = relative to load p = relative to PZT
RMS = relative to root means square
Non-Parametric Model of Piezoelectric Energy Harvesting Beam
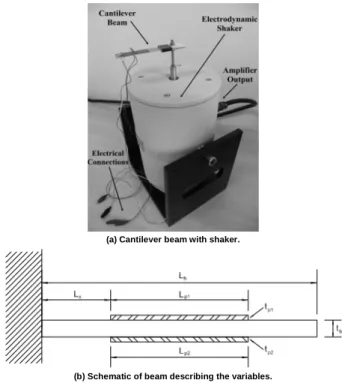
The cantilever beam with bimorph PZT patches used in the present paper is shown in Fig. 1. The geometry and details are also presented in Fig. 1(b) with Lb = 78 mm, Lx = 20 mm, tb = 0.91 mm, Lp1 = 45 mm, Lp2 = 46 mm, tp1 = 0.191 mm and tp2 = 0.191 mm. The width of the beam is 21 mm, the PZT1 15 mm and the PZT2 17 mm. The PZTs used are the model PSI-5H4E manufactured by Piezo Systems. It is important to observe that the ideal placement for the piezoceramics should be attached to the cantilevered end of the electromechanical beam in order to maximize the power output. However, three reasons are used to choice the value of Lx = 20 mm; first of all, this is a beam already existing in the laboratory. Secondly, the attaching of the beam with the shaker is difficult if the PZT is bonded near to the cantilevered end of the electromechanical beam. Finally, the goal in this paper is not relative to maximize power in function of the
geometry and placement of PZT, but to show the best performance for the appropriate choice of topology and components of the resistive and capacitive rectifier circuit used.
(a) Cantilever beam with shaker.
(b) Schematic of beam describing the variables.
Figure 1. Cantilever beam attached to the shaker model TJ 50 TMC and dimensions of beam when one end is clamped.
The goal is only to describe it by using experimental data, a non-parametric model which is representative of the dynamics of the beam. Thus, a non-parametric model, the frequency response function (FRF), is obtained from spectral analysis. In order to determine the FRF of the system, an input chirp signal with frequency ranging from 0 to 2 kHz of lower PZT (actuator) was applied. The response on top PZT (sensor) of the beam connected in open circuit for measurement was recorded. The sampling rate used was 8 kHz and all acquisition was performed by using the DSpace 1104 board controlled by the Control Desk software. Figure 2 presents the result of the experimental FRF calculated by using the Welch method with 3200 samples, 50% of overlapping and rectangular window.
It is worth noting that at 58 Hz the system has a high peak gain, significantly greater than the other frequencies. Experimentally when a sinusoidal frequency with 58 Hz is applied in the shaker as input the level of vibration is high stating and proving this is the first natural frequency of the beam. For monitoring the level of force applied and displacement in the beam, two additional transducers were employed: a load cell, model TF-YD-312 TMC with sensitivity of 3.02 pC/1 N, and an IEPE accelerometer TA-YD-193 TMC with sensitivity of 1.007 mV/ms-2. The measurements performed with this sensor were only qualitative.
Model of Energy Storage Circuit
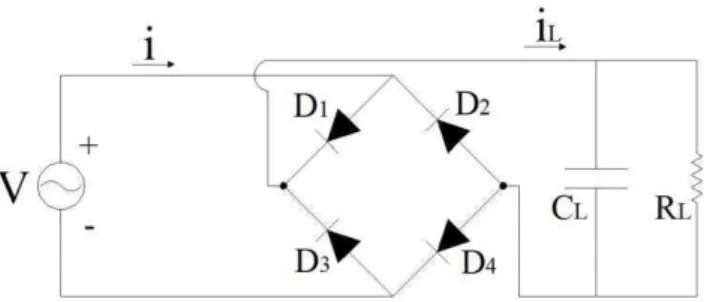
Usually, in real-world application of vibration power harvesting, a rectifier circuit is necessary to convert AC to DC in order to charge a battery or to feed directly an electronic device. A very simple and common non-controlled rectifier circuit is the full-wave rectifier with diode bridge. A schematic diagram is shown in Fig. 3.
Figure 3. Schematic diagram of full-wave bridge rectifier.
The non-controlled rectifier can transform an alternating signal continuously, but if a capacitor in parallel to the load is not employed, the output signal could have a considerable ripple, which may be unacceptable for powering loads with voltage DC. So, the circuit to supply a resistive load uses a capacitive filter which smooths the effect of variation in load. The ripple was defined by the reason of the component AC to DC. The component DC of the signal is illustrated by the following equation:
vavg= vL(t) tf
dt
0
tf
∫
(1)and the component AC is the relation of the signal and the DC level calculated by:
vLAC(t)=vL(t)−vavg (2)
When the ripple is closer to zero (0%), more solid signal indicates a characteristic quality voltage DC. The next equation shows how the ripple is calculated:
ripple
[ ]=
% vrmsAC vavgx100 (3)
vrmsAC=
vLAC
2 (t)
tf dt
0
tf
∫
(4)where vrmsAC are the RMS and average voltage, respectively, and tf
is the final time of the signal. First, the average signal is calculated, and after subtracting from the original signal, taking only the AC
voltage, the RMS value is calculated. This effect can be explained by analyzing the following equation:
τ=RC (5)
where the time constant capacitive τ represents the time which a
RC circuit takes to charge or discharge. The current varies in parallel to RC circuit by:
ir(t)= v0
Re
−τRC
(6)
where v0 is the voltage in steady state. Clearly, it is observed that the greater the capacitance C, the more time is consumed to power the load in the form of electric field. On the other hand, the smaller the R, the more power is consumed and thus less time it takes to discharge the circuit. In summary, the higher the , the better the quality of the rectified signal and better your ripple.
The energy stored is given by:
EC= 1 2CLvL
2 (7)
and the charge:
qCL=CLvL (8)
So, the energy in the capacitor is directly proportional to its capacitanceCL.
The internal transducer capacitance of the PZT without external load is given by:
Cp= εT
wHLpH
tt +ε
T wLLpL
tt
(9)
where tt is the PZT thickness [m], LpH and LpL are the PZT
lengths, wH and wL are the width top and bottom PZT and ε is the permittivity of PZT when the strain is constant [C²/Nm²]. The permittivity in vacuum is = 8.854 × 10⁻¹² [C2/Nm2], K = 3400 given by the PZT manual used for the PZT PSI-5H4E and the relationship = , the value of this capacitance calculated is
Cp=229.64 nF.
Now, the resistor RL is chosen by considering that it does not
significantly affect the output voltage ripple, causing the capacitive load time to be significantly longer than the period of the signal voltage at the terminals of the PZT transducer. If the circuit has low resistance value RL, the constant τ is small, and the discharge of
the RLCL parallel circuit will be faster than the voltage to reach
zero value. Finally, the average power consumed by the load is directly proportional to the square of the average voltage and inversely proportional to resistance and the average active power consumed by the resistor can be calculated this way:
PLavg= vavg
2
RL
(10)
Numerical and Experimental Results
simulation. Subsequently, the procedure for choosing the values of resistance and capacitance used in the rectifier circuit is described. The comparison between the numerical and experimental performance for different levels of vibration and frequency is then presented. The section is concluded with a very simple example to show the applicability and effectiveness of the experimental setup to light a LED.
The curve of the diode 1N5817
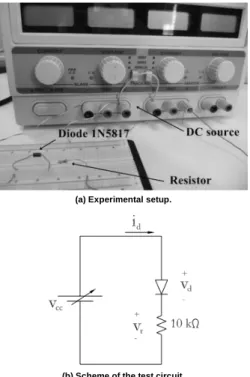
It is well known that the schottky and germanium diodes have forward voltage drop significantly lower than silicon diodes. The 1N5817 schottky diode was chosen after checking many datasheets of components seeking to choose the lowest forward voltage drop, so that the voltage drop was the minimum possible. The full-wave rectifier circuit was simulated by using the Matlab/Simulink since the behavior of the diode can be easily verified with this software. An experimental test was performed to identify the relationship between current and voltage in the 1N5817 schottky diode. Figure 4 illustrates the experimental setup used to determine the current versus voltage curve by using a DC source, a diode and a resistor of 10 kΩ.
The value of 10 kΩ was chosen to the test, because only low currents cross the diode element, thus power harvesting applications in smart structures have small amounts of current (order of mA). The voltage across the resistor was measured with the DSpace 1104 and the current was determined indirectly by the relationship = . If the data acquisition of the voltage of the DC source is performed, the relationship can be easily calculated by = − and the voltage-current curve is obtained. Figure 5 presents the result of the experimental voltage curve of the diode and another one identified by using a polynomial. A representative curve was used to identify the forward voltage drop, = 50 mV, and internal resistance of the diode, = 280 Ω, which represents the slope of the curve after the voltage .
(a) Experimental setup.
(b) Scheme of the test circuit.
Figure 4. Circuit for experimental identification of the current versus voltage curve.
Figure 5. Current versus Voltage curve of the diode 1N5817.
(a) Experimental rectifier circuit implemented on a protoboard.
(b) Scheme of the rectifier circuit implemented in the Simulink.
Figure 6. Full-wave bridge rectifier.
Design of the load and
perform numerical simulations, Fig. 6(b). The frequencies used in the test were set based on Fig. 2, 58 Hz and 437 Hz. The 58 Hz is the first natural frequency with the greatest intensity of vibration in the beam. The natural frequency of 437 Hz is used only to compare the results. Figure 7 presents the assessment of capacitive load in the diode bridge for both frequencies.
(a) 58 Hz.
(b) 437 Hz.
Figure 7. Assessment of capacitive load in the diode bridge.
As one can observe in Fig. 7 for both frequencies the load capacitance of CL = 1 mF takes longer to reach the steady state, but without completing the load. The other capacitances reach the steady state before with almost the same voltage in both. Since both capacitors reach the steady state with the same voltage level, one can use Eq. (7) to choose the capacitance to provide the greater energy stored in the form of electric field. Thus, it is determined that the load capacitor with CL = 1 µF is a right choice for both frequencies of 58 and 437 Hz, even where the voltage is lower. For the frequency of 437 Hz and when the CL = 1µF, the steady voltage amplitude is = 0.4 V and = 80 nJ calculated by Eq. (9). For CL = 1 nF the steady voltage amplitude is = 0.419 V and = 7.6 pJ. Finally, for CL = 1 pF, the steady
amplitude is = 0.42 V and = 0.088 pJ. Thus, the capacitance of CL = 1 µF is a viable choice, even with the low level of voltage amplitude, the level of energy and the current provided is bigger when compared to the other capacitance values tested.
Another important task is to choose an appropriate resistive load to consume the active power. This passive element represents an electronic device and is designed to maintain a certain amount of ripple and voltage level measured at its terminals. It is also necessary to consider that the power consumed is directly proportional to the
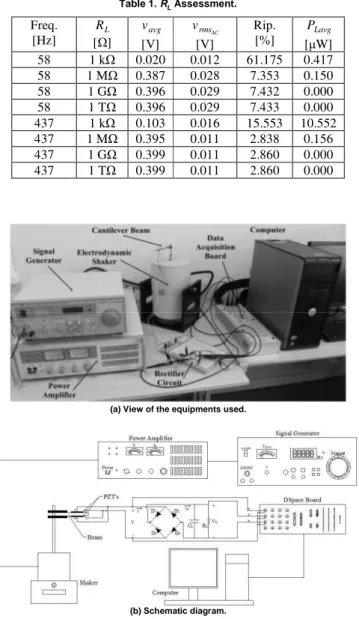
square of the voltage and inversely proportional to resistance. The same voltage input signal was applied to the source, but now the resistor is not an open circuit. Table 1 presents the average values of voltage, RMS voltage of AC ripple and resistance to different values. The frequencies of 58 Hz and 437 Hz were assumed, as well as the same capacitance CL and AC voltage source.
Table 1. RL Assessment.
Freq. [Hz]
RL
[Ω]
vavg
[V]
vrmsAC
[V]
Rip. [%]
PLavg
[µW]
58 1 kΩ 0.020 0.012 61.175 0.417
58 1 MΩ 0.387 0.028 7.353 0.150
58 1 GΩ 0.396 0.029 7.432 0.000
58 1 TΩ 0.396 0.029 7.433 0.000
437 1 kΩ 0.103 0.016 15.553 10.552
437 1 MΩ 0.395 0.011 2.838 0.156
437 1 GΩ 0.399 0.011 2.860 0.000
437 1 TΩ 0.399 0.011 2.860 0.000
(a) View of the equipments used.
(b) Schematic diagram.
Figure 8. Experimental setup.
Analyzing the results in Table 1, it is observed that the higher the resistance value RL, the ripple voltage is lower and the load
voltage is greater. The increase of the voltage load is caused by the increase of RL, because the implementation of CL and RL
ripple vavg and PLavgpower consumed by the load. The values RL = 500 kΩ could be refined to find better parameters, e.g., by simulating a resistance of RL = 500kΩ and observing if the ripple, Vavg and PLavgimprove as a function of the parameter concerned. The same consideration can be performed to choose the CL.
(a) Numerical.
(b) Experimental.
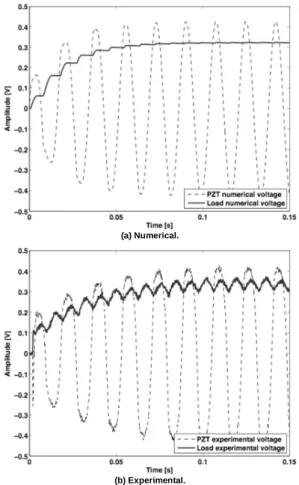
Figure 9. PZT and load voltage for transitory condition with 58 Hz.
Experimental Results
The experimental test of the power harvesting device designed is performed by using a modal shaker TJ 50 TMC, where the cantilever beam is attached, a power amplifier TE 5874A TMC, sweeping and sinusoidal signal generator TE 1311E TMC, DSpace 1104 data acquisition board controlled by Simulink and Control Desk software and a protoboard to attach the circuit designed. Figure 8 shows the complete experimental setup utilized in the tests with a schematic diagram.
The beam has two PZTs coupled, and the ceramics have been connected in parallel and the layers were coupled with the poling direction out-of-phase. The full-wave rectifier circuit was composed of four 1N5817 diodes, resistor, and electrolytic capacitor, as described before. In all tests of this section, the output voltage data in PZT and in the load were recorded with a sampling rate of 8 kHz and with 16001 samples in each file, being measured during two seconds. In order to monitor the level of displacement and force applied in the beam an oscilloscope was employed to measure these parameters.
Figure 9 presents the comparison between the numerical and experimental test. The simulation was performed with Simulink, Fig. 6(b), and by using the peak value of sinusoidal voltage source of 0.43 V, measured experimentally. In the Simulink, the ode23t
(Mod. stiff/Trapezoidal) command is used as solver with variable time step.
Now using the excitation frequency of 437 Hz, the same test was done. The value of force was set by using the gain in the power amplifier to supply the shaker in order to reach a level of 0.47 V in the PZT. The voltage magnitude across the PZT to the frequency of 58 Hz and 437 Hz are different because the highest possible gain has been avoided before the accelerometer signal becomes noisy. Figure 10 presents the comparison between the numerical and experimental test.
(a) Numerical.
(b) Experimental.
Figure 10. PZT and load voltage for transitory condition with 437 Hz.
(b) 437 Hz.
Figure 11. Experimental PZT and load voltage for steady condition.
(a) 58 Hz.
(b) 437 Hz.
Figure 12. Load voltage comparison.
Figures 11(a) and 11(b) indicate the experimental PZT and load voltage for the steady condition of the frequencies of 58 Hz and 437 Hz, respectively.
Finally, a direct comparison between the load voltages obtained experimentally and numerically is shown in Fig. 12 for both frequencies. The level of voltage and the general behavior are well simulated with the mathematical model provided by Simulink. However, it is clear that the experimental ripple is greater. The diode is simulated by static representation, as a resistance in series with a DC voltage source, where the real circuit highlights the dynamic characteristics of the diode, including non-linearity of this component. As the curve shows different points of slope (and thus
resistance), the static modeling loses some information. The ripple is presented as something dynamic that is not to be represented in static form, but the DC voltage level had good representation. So, a better model updating is wished in the next tests. Another point is relative to compare other numerical methods to solve the non-linear equations in the rectifier circuits.
Application
The power harvesting device is tested for a possible application as an indicator of the level of charging in a battery. A Light-Emitting Diode (LED) is installed parallel to a capacitor to indicate when the charge in the capacitor reaches the adequate value of voltage. Figure 13 shows the experimental setup used.
Figure 13. Power harvesting device to light an LED.
(a) Resonance Frequency Comparison.
(b) Simple Frequency Comparison.
J. of the Braz. Soc. of Mech. Sci. & Eng. Copyright 2012 by ABCM Special Issue 2012, Vol. XXXIV / 385 If the LED is on, the capacitor voltage reaches a minimum
level expected and, consequently, the stored charge can be calculated by Eq. (8). Two sets of test were realized to lighting the LED. For both tests, the load is = 3300 , is the LED and a sampling rate of 2 kHz is used. These tests were recorded with a sampling rate of 2 kHz and with 200001 samples per file, being measured by one hundred seconds.
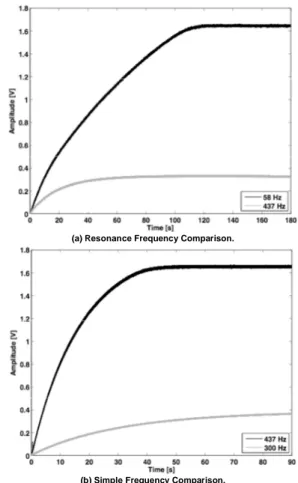
The aim of the first analysis is to compare the time of loading and the voltage level on the capacitive load when the excitation signal has the frequency equal to the first natural frequency of 58 Hz and to the natural frequency of 437 Hz. The gain in the power amplifier to supply the modal shaker is maintained constant in both cases. Figure 14(a) shows the voltage across the LED (and capacitor) for different frequency values, but keeping the fixed applied force. The displacement in the clamped of the beam for 58 Hz was higher than the frequency of 437 Hz, and the LED was on for about 120 seconds. For the frequency of 437 Hz, after a wait of 6 minutes the LED is still not lit.
The second analysis performed the same comparison, but by considering a resonance frequency of 437 Hz and any one frequency of 300 Hz. Figure 14(b) presents the results of the load voltage for both frequencies, where the same level of force was applied corresponding to approximately three times the first analysis. For this value of force at 437 Hz, the LED is on for about 50 seconds. Clearly, the first resonance frequency is better to charge the load. Now, for the frequency of 300 Hz, after a wait of 6 minutes the LED is not lit.
Final Remarks
Vibration power harvesting represents a huge potential for commercial applications in different areas, as presented in recent researches, mainly in networks for structural health monitoring (SHM). In this sense, this paper illustrated the applicability and some aspects for a fast and simple design of a device for practical application. It was shown through several experimental tests that the higher the load resistance, the greater the voltage magnitude. However, as the higher the resistive load, the lower the power consumed by the load, thus the performance for a practical application that requires a level of considerable power will be difficult. The greater the capacitance of the load , the more time is required to charge the capacitor. However, the ripple decreases and is shorter, causing a faster discharge. Another important point is to choose an adequate value of excitation frequency, mainly in the first natural frequencies where the level of vibration amplitude can be bigger. Usually, the mechanical beam design is based on the information about the real-world mechanical source, e.g. a machine or a structural frame. Further research is being developed by the authors to reach a mathematical model of the mechanical vibration of the beam with multiple modes attached to the non-controlled rectifier circuits in order to provide the information needed for this design.
Acknowledgements
The authors would like to thank the National Council for Scientific and Technological Development (CNPq/Brazil), Fundação Araucária de Desenvolvimento Científico e Tecnológico do Paraná and SETI-PR for the financial support provided. D. Motter and F.A. Dias are thankful for their scholarships from Parque
Tecnológico Itaipu (PTI/Brazil). J.V. Lavarda is thankful for his scholarship from PIBIC/CNPq. The authors also acknowledge the helpful suggestions of the reviewers and the associate editor.
A preliminary version of this paper was presented at COBEM 2011 (Natal, RN).
References
Ammar, Y. and Basrour, S., 2006, “Non-linear techniques for increasing harvesting energy from piezoelectric and electromagnetic micro-power-generators”, In DTIP of MEMS & MOEMS.
Anton, S.R. and Sodano, H.A., 2007, “A review of power harvesting using piezoelectric materials (2003-2006)”, Smart Materials and Structures, Vol. 16, No. 3, pp. doi: 10.1088/0964– 1726/16/3/R01.
De Marqui Jr, C., Erturk, A. and Inman, D.J., 2009, “An electromechanical finite element model for piezoelectric energy harvester plates”, Journal of Sound and Vibration, Vol. 327, pp. 9-25.
Erturk, A. and Inman, D.J., 2008, “Issues in mathematical modeling of piezoelectric energy harvesters”, Smart Materials and Structures, Vol. 17, p. 065016.
Guan, M.J. and Liao, W.H., 2007, “On the efficiencies of piezoelectric energy harvesting circuits towards storage device voltages”, Smart Materials and Structures, Vol. 16, pp. 498-505.
Guigon, R., Chaillout, J.J., Jager, T. and Despesse, G., 2008a, “Harvesting raindrop energy: experimental study”, Smart Materials and Structures, Vol. 17, p. 015039 (6pp).
Guigon, R., Chaillout, J.J., Jager, T. and Despesse, G., 2008b, “Harvesting raindrop energy: theory”, Smart Materials and Structures, Vol. 17, p. 015038 (8pp).
IDTechEx, 2010, “Energy harvesting and storage for electronic devices 2010-2020”, Technical report, IDTechEx Ltd., http://www.mmdnewswire. com/ press-release-distribution-8733.html
Lallart, M. and Guyomar, D., 2008, “An optimized self-powered switching circuit for non-linear energy harvesting with low voltage output”,
Smart Materials and Structures, Vol. 17, p. 035030 (8pp).
Lefeuvre, E., Audigier, D., Richard, C. and Guyomar, D., 2007, “Buck-boost converter for sensorless power optimization of piezoelectric energy harvester”, IEEE Transactions on Power Electronics, Vol. 22, No. 5, pp. 2018-2025.
Lefeuvre, E., Badel, A., Richard, C., Petit, L. and Guyomar, D., 2006, “A comparison between several vibration-powered piezoelectric generators for standalone systems”, Sensors and Actuators A, Vol. 120, pp. 405-406.
Liao, Y. and Sodano, H.A., 2008, “Model of a single mode energy harvester and properties for optimal power generation”, Smart Materials and Structures, Vol. 17, p. 065026.
Liao, Y. and Sodano, H.A., 2009, “Optimal parameters and power characteristics of piezoelectric energy harvesters with an RC circuit”, Smart Materials and Structures, Vol. 18, p. 045011.
Liu, Y., Tian, G., Wang, Y., Lin, J., Zhang, Q. and Hofmann, H.F., 2009. “Active piezoelectric energy harvesting: General principle and experimental demonstration”, Journal of Intelligent Material Systems and Structures, Vol. 20, pp. 575-586.
Pereyma, M., 2007, “Overview of the modern state of the vibration energy harvesting devices”, In Internation Conference on Perspective Technologies and Methods in MEMS Design (MEMSTECH 2007). 10.1109/MEMSTECH.2007.4283437, pp. 107-112.
Sodano, H.A., Inman, D.J. and Park, G., 2004a, “Estimation of electric charge output for piezoelectric energy harvesting”, Strain, Vol. 40, pp. 49-58.
Sodano, H.A., Park, G. and Inman, D.J., 2004b, “A review of power harvesting using piezoelectric materials”, The Shock and Vibration Digest, Vol. 36, No. 3, pp. 197-205.
Starner, T. and Paradiso, J.A., 2004, “Human generated power for mobile electronics”. In Low Power Electronics Design.