Licença
Rev Bras
Cineantropom
Hum
DOI: http://dx.doi.org/10.5007/1980-0037.2016v18n5p577
original article
Prevalence and factors associated with
leisure-time physical activity: survey repeated in
university students
Prevalência e fatores associados à prática de atividades
físicas no lazer: inquérito repetido em estudantes
universitários
Sueyla Ferreira da Silva dos Santos1
Ismael Forte Freitas Junior2
Ana Maria Alvarenga3
Silvio Aparecido Fonseca3
Jair Sindra Virtuoso Junior4
Thiago Ferreira de Sousa4
Abstract – he practice of leisure physical activity represents a behavior that must be monitored in diferent population groups. he objectives of this study were i) to compare the prevalence of leisure-time physical activity in university students along the survey years in three separate years; ii) to analyze the factors associated with practice of leisure-time physical activity in each survey. hree surveys in a college institution in northeastern Brazil in 2010, 2012 and 2014 were carried out. he dependent variable was practice of leisure-time physical activity. Exploratory variables were sociodemographic factors and link with the university. he prevalence was compared using the chi-square test for linear trend and association for Prevalence Ratio. Participation was of 1,084, 1,085 and 1,041 college students in 2010, 2012 and 2014, respectively. he prevalence of leisure-time physical activity was approximately 50% in the three surveys. Women were less active in leisure time on the three surveys. In each survey, associations were diferent in relation the courses, and Chemistry – teacher training, Computer Science, Pedagogy – teacher training and Linguistics (no specialization) students showed lower levels of leisure-time physical activity and Biomedicine, Geography – Bachelor, Physical Education – teacher training and Geography – teacher training students were more active in leisure time. It was concluded that there was a stabilization of the prevalence of active leisure over time and that women showed lower prevalence of leisure-time physical activity in the three surveys.
Key words: Cross-sectional studies; Longitudinal studies; Recreational activities; Students.
Resumo – A prática de atividades físicas no lazer representa um comportamento que auxilia na obtenção de potenciais beneicios para a saúde. Os objetivos deste estudo foram i) comparar as prevalências de universitários ativos no lazer entre três inquéritos transvesais; ii) analisar os fatores associados à prática de atividade física no lazer, em cada inquérito. Foram realizados três inquéritos nos anos de 2010, 2012 e 2014. O desfecho deste estudo foram os ativos no lazer (≥1 dia por semana). As variáveis exploratórias foram as sociodemográicas e de vínculo com a universidade. As prevalências entre os inquéritos foram comparadas pelo teste qui-quadrado para tendência e a associação foi estimada pelas Razões de Prevalências. A participação foi de 1.084, 1.085 e 1.041 universitários nos anos de 2010, 2012 e 2014, respectivamente. As pre-valências de ativos no lazer foram de aproximadamente 50% nos três inquéritos. As mulheres foram menos ativas no lazer nos três inquéritos. Os universitários vinculados aos cursos da Biomedicina, Geograia – bacharelado, Educação Física – licenciatura e Geograia – licenciatura foram associados com maiores razões de prevalências de prática de atividades físicas no lazer. Os universitários com menores razões de prevalências de prática de atividades físicas no lazer foram provenientes dos cursos de Química – licenciatura, Ciência da computação, Pedagogia e Letras (sem habilitação). Conclui-se que houve a estabilização da prevalência de universitários ativos no lazer ao longo do período de análise e que as mulheres apresentaram menores prevalências de prática de atividades físicas no lazer nos três inquéritos.
1 Federal University of Amazonas. Institute of Social Sciences, Educa-tion and Animal Science. Parintins, AM. Brazil
2 Sao Paulo State University. Gra-duate Program in Human Kinetics. Faculty of Science and Technology. Presidente Prudente, São Paulo, SP. Brazil
3 State University of Santa Cruz. Ilhéus, BA. Brazil
4 Federal University of Triângulo Mineiro. Uberaba, MG. Brazil
Received: September 23, 2015
INTRODUCTION
he entry of young individuals into university is a time of adjustment of lifestyles, social engagement, and greater possibility of negative behaviors such as low levels of physical activity, low consumption of fruits and veg-etables, and consumption of alcoholic beverages1. Such behavior acquired
at this stage of life can be diicult to be changed2,3.
he lower levels of physical activities are susceptible to exposure to the university environment4,5. In a study with university students from
23 countries of diferent socioeconomic levels and culture, the prevalence of leisure-time physical activity (LTPA) ranged from 77% in northern countries of Western Europe and United States to 56% in developing countries6, corroborating a Brazilian study, whose prevalence of physically
active students was 57.1% 7 and Croatian university students of 71.1%8.
Among college students, men are more adept to leisure-time physical activity1,9 and in all domains10,11. When comparing the level of physical
activity among undergraduate degrees, studies seem to indicate that Physi-cal Education students5,12 are more active than students of other courses.
Health surveys with university students conirm the fundamental role of the university in ofering measures to encourage the adoption of an active and healthy lifestyle13. he improvement of facilities in universities related
to the use of leisure time is pointed by students as key to improving the level of physical activity due to the long time of permanence in the institution, which in some cases this environment is an extension of their homes14.
Given the above, the monitoring of the prevalence of active leisure-time university students and characteristics associated with this behavior may relect institutional policies to ofered programs focusing on the practice of LTPA. herefore, the aims of this research conducted with university students of a public higher education institution were to compare the prevalence of active leisure-time university students in three surveys and assess sociodemographic factors of link with the university associated with LTPA in each survey.
METHODOLOGICAL PROCEDURES
his study is derived from MONISA research (Monitoring of Health Indicators and Quality of Life of University Students) held in a university of the state of Bahia in years 2010, 2012 and 2014. he methodological detailing of this study was described by Sousa et al15.
population in courses, study periods and years of entering university. he detailing of the sampling procedures is presented in Box 1. Finally, in each stratum, university students were randomly selected with the help of the registration list in alphabetical order.
Box 1. Sampling criteria adopted in the MONISA study
Critérios de Amostragem 2010 2012 2014
Number of courses 30 34* 33+
Years of university entrance 2010 2012 2014
2009 2011 2013
2008 2010 2012
2007 and earlier 2009 and earlier 2011 and earlier
Study period Day (morning and afternoon) and night
* Inclusion of four new courses; + Junction of Linguistics courses with specialization in Spanish (HE) and Linguistics with specialization in English (HI), existing in 2012, to Linguistics with no specialization (SH).
Data collection in the three surveys was conducted in the period from September to November by a team previously trained in the months of July and August. Questionnaire application sites were the university facilities, being held up to three contact attempts on diferent days and times with selected university students, and there was no replacement of those who could not be reached or refused to participate. he Isaq-A questionnaire (Health Indicators and Quality of Life of University Students) was used to obtain information 16.
he dependent variable in this study was LTPA. University students con-sidered active in leisure time (outcome) were those who reported to practice for at least one day in a typical week, at least one of the 17 LTPA options listed in the instrument (soccer, handball, volleyball, basketball, gymnastics, run in open environments, aerobics, cycling, wrestling or martial arts, tennis, treadmill running, treadmill walking, aerobics, suring, swimming, weight training and walking outdoors) or the inclusion of other options of activities not included in the list, in three open options 16, according to classiication
used in other studies on the LTPA of university students 17,18. his
classiica-tion was used due to the lack of agreement in literature of speciic criteria for the leisure domain in surveys with university students 19.
Independent variables were sociodemographic and link with the uni-versity. Sociodemographic variables were sex, age in thirds according to the survey year: 2010 survey: 17-20 years 1st tertile, 21-23 years 2nd tertile
and 24-52 years 3rd tertile; the 2012survey: 17-20 years 1st tertile, 21-23
years 2nd tertile and 24-54 years 3rd tertile; in the 2014survey: 17-20 years
1st tertile, 21-23 years 2nd tertile and 24-57 years 3rd tertile. Marital status
was categorized as unmarried (single, widowed or divorced) and with partner (married or living with a partner).
accord-ing to the year of entry in the institution, and in the 2010 survey: entry in 2010 the 1st year of exposure, entry in 2009 2nd year of exposure, entry
in 2008 3rd year of exposure and entry in 2007 and earlier years 4th year
or more of exposure; the 2012 survey: entry in 2012 1st year of exposure,
entry in 2011 2nd year of exposure, entry in 2010 3rd year of exposure and
entry in 2009 and earlier 4th year of exposure or more; the 2014survey:
entry in 2014 1st year of exposure; entry in 2013 2nd year of exposure,
en-try in 2012 3rd year of exposure and entry in 2011 and earlier 4th year of
exposure or more, and courses were the following: Agronomy, Geography (teacher training – TT) Geography (Bachelor – B), Veterinary Medicine, Administration, Accounting Sciences, Biological Sciences (TT), Biological Sciences (B), Biomedicine, Economic Sciences, Production Engineering, Chemistry (TT), Chemistry (B), Linguistics (HI), Physics (TT) Physics (B), Mathematics (TT) Mathematics (B), Computer Science, Pedagogy (TT), Nursing, Medicine, Physical Education (TT), Legal Sciences, So-cial Sciences, History, Philosophy, Linguistics (HE), Linguistics (SH), Foreign Languages Applied to International Negotiations (LEA), Social Communication, Chemical Engineering, Electrical Engineering, Civil Engineering and Mechanical Engineering.
Data were tabulated in EpiData 3.1 and analyses were performed using SPSS software version 15.0. For analyses, absolute and relative frequen-cies, mean, standard deviation, minimum and maximum were used. he chi-square test for linear trend was used for the comparison between the proportions of those active in leisure time among surveys, according to the independent variables. he association between independent variables and LTPA in each survey was conducted through Prevalence Ratios (RP) in unadjusted and adjusted analyses, by Poisson regression, with adjust-ment for robust variance. In the adjusted analysis, variables with p-value in the Wald test <0.20 in the irst levels (1st level: gender and age, 2nd level:
marital status; 3rd level: study period, years of exposure to university and
course) were used to adjust to lower levels. he signiicance level was 5%.
RESULTS
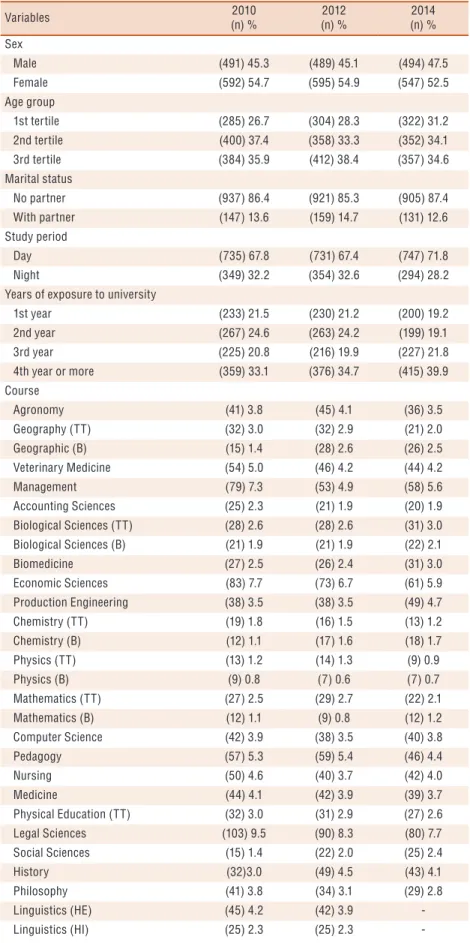
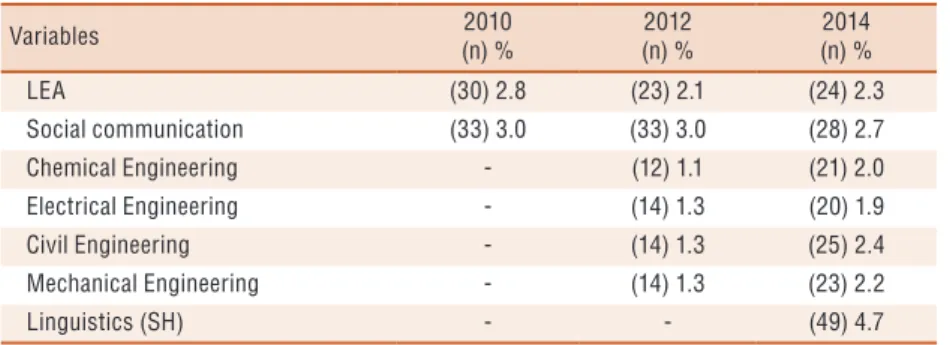
Participated in the 2010, 2012 and 2014 surveys, respectively, 1,084 (mean age of 23.6 years; ± 5.2; 52 years), 1,085 (mean age of 24 years; ± 6; 17-54 years) and 1,041 (mean age of 23.7 years; ± 5.8; 17-57 years) university students. Most were female in the three surveys (2010: 54.7%; 2012: 54.9%; 2014: 52.5%) and unmarried (2010: 86.4%; 2012: 85.3%; 2014: 87.4%). As for the study period, the highest proportion of students were enrolled in the day shift (2010: 67.8%; 2012: 67.4%; 2014: 71.8%) (Table 1).
Table 1. Characterization of the university students according to sociodemographic variables and link with the university. MONISA study.
Variables 2010
(n) %
2012 (n) %
2014 (n) % Sex
Male (491) 45.3 (489) 45.1 (494) 47.5
Female (592) 54.7 (595) 54.9 (547) 52.5
Age group
1st tertile (285) 26.7 (304) 28.3 (322) 31.2
2nd tertile (400) 37.4 (358) 33.3 (352) 34.1
3rd tertile (384) 35.9 (412) 38.4 (357) 34.6
Marital status
No partner (937) 86.4 (921) 85.3 (905) 87.4
With partner (147) 13.6 (159) 14.7 (131) 12.6
Study period
Day (735) 67.8 (731) 67.4 (747) 71.8
Night (349) 32.2 (354) 32.6 (294) 28.2
Years of exposure to university
1st year (233) 21.5 (230) 21.2 (200) 19.2
2nd year (267) 24.6 (263) 24.2 (199) 19.1
3rd year (225) 20.8 (216) 19.9 (227) 21.8
4th year or more (359) 33.1 (376) 34.7 (415) 39.9
Course
Agronomy (41) 3.8 (45) 4.1 (36) 3.5
Geography (TT) (32) 3.0 (32) 2.9 (21) 2.0
Geographic (B) (15) 1.4 (28) 2.6 (26) 2.5
Veterinary Medicine (54) 5.0 (46) 4.2 (44) 4.2
Management (79) 7.3 (53) 4.9 (58) 5.6
Accounting Sciences (25) 2.3 (21) 1.9 (20) 1.9
Biological Sciences (TT) (28) 2.6 (28) 2.6 (31) 3.0
Biological Sciences (B) (21) 1.9 (21) 1.9 (22) 2.1
Biomedicine (27) 2.5 (26) 2.4 (31) 3.0
Economic Sciences (83) 7.7 (73) 6.7 (61) 5.9
Production Engineering (38) 3.5 (38) 3.5 (49) 4.7
Chemistry (TT) (19) 1.8 (16) 1.5 (13) 1.2
Chemistry (B) (12) 1.1 (17) 1.6 (18) 1.7
Physics (TT) (13) 1.2 (14) 1.3 (9) 0.9
Physics (B) (9) 0.8 (7) 0.6 (7) 0.7
Mathematics (TT) (27) 2.5 (29) 2.7 (22) 2.1
Mathematics (B) (12) 1.1 (9) 0.8 (12) 1.2
Computer Science (42) 3.9 (38) 3.5 (40) 3.8
Pedagogy (57) 5.3 (59) 5.4 (46) 4.4
Nursing (50) 4.6 (40) 3.7 (42) 4.0
Medicine (44) 4.1 (42) 3.9 (39) 3.7
Physical Education (TT) (32) 3.0 (31) 2.9 (27) 2.6
Legal Sciences (103) 9.5 (90) 8.3 (80) 7.7
Social Sciences (15) 1.4 (22) 2.0 (25) 2.4
History (32)3.0 (49) 4.5 (43) 4.1
Philosophy (41) 3.8 (34) 3.1 (29) 2.8
Linguistics (HE) (45) 4.2 (42) 3.9
-Linguistics (HI) (25) 2.3 (25) 2.3
Variables 2010 (n) %
2012 (n) %
2014 (n) %
LEA (30) 2.8 (23) 2.1 (24) 2.3
Social communication (33) 3.0 (33) 3.0 (28) 2.7
Chemical Engineering - (12) 1.1 (21) 2.0
Electrical Engineering - (14) 1.3 (20) 1.9
Civil Engineering - (14) 1.3 (25) 2.4
Mechanical Engineering - (14) 1.3 (23) 2.2
Linguistics (SH) - - (49) 4.7
LEA: Foreign Languages applied to international negotiations; TT: teacher training: B: Bachelor; HI: specialization in English; HE: specialization in Spanish; SH: no specialization.
Table 2. Prevalence of practice of leisure-time physical activities in college students, according to sociodemographic variables and link with the university. MONISA study
Variables 2010
(n) %
2012 (n) %
2014
(n) % p
(1.059) 49.1 (1.068) 51.2 (1.027) 51.8 0.22
Sex
Male (315) 65.4 (311) 65.2 (316) 65.0 0.99
Female (204) 35.4 (235) 39.8 (216) 39.9 0.20
Age group
1st tertile (140) 50.2 (149) 49.5 (162) 50.9 0.94
2nd tertile (199) 50.6 (195) 54.6 (184) 52.6 0.55
3rd tertile (175) 47.0 (198) 49.6 (180) 51.1 0.54
Marital status
No partner (459) 50.0 (474) 52.3 (464) 52.0 0.58
With partner (61) 43.3 (72) 46.2 (66) 51.2 0.42
Study period
Day (368) 51.3 (383) 53.0 (381) 51.6 0.80
Night (152) 44.4 (164) 47.5 (151) 52.2 0.15
Years of exposure to university
1st year (113) 46.6 (115) 50.7 (104) 52.5 0.83
2nd year (121) 47.1 (134) 51.3 (94) 47.7 0.58
3rd year (107) 48.0 (106) 49.8 (104) 47.1 0.85
4th year or more (179) 51.0 (192) 52.3 (230) 56.0 0.36
Course
Agronomy (21) 55.3 (21) 48.8 (22) 61.1 0.55
Geography (TT) (17) 56.7 (20) 62.5 (17) 81.0 0.19
Geographic (B) (8) 53.3 (18) 72.0 (8) 32.0 0.02
Veterinary Medicine (24) 44.4 (22) 47.8 (19) 43.2 0.90
Management (36) 46.2 (29) 54.7 (31) 53.4 0.56
Accounting Sciences (14) 56.0 (10) 47.6 (12) 60.0 0.72
Biological Sciences (TT) (13) 46.4 (12) 42.9 (15) 50.0 0.86
Biological Sciences (B) (11) 52.4 (11) 52.4 (8) 36.4 0.47
Biomedicine (19) 73.1 (13) 50.0 (16) 51.6 0.16
Economic Sciences (41) 51.9 (35) 49.3 (33) 55.0 0.81
Production Engineering (24) 63.2 (24) 63.2 (23) 46.9 0.20
Chemistry (TT) (4) 21.1 (5) 31.3 (4) 40.0 0.54
Chemistry (B) (7) 63.6 (8) 47.1 (13) 72.2 0.31
Physics (TT) (10) 76.9 (7) 50.0 (6) 66.7 0.34
Physics (B) (6) 75.0 (2) 28.6 (2) 28.6 0.11
Variables 2010 (n) %
2012 (n) %
2014
(n) % p
Mathematics (TT) (11) 40.7 (11) 39.3 (13) 59.1 0.31
Mathematics (B) (5) 41.7 (6) 66.7 (8) 72.7 0.28
Computer Science (17) 40.5 (20) 52.6 (22) 55.0 0.37
Pedagogy (TT) (14) 24.6 (17) 29.8 (8) 18.2 0.40
Nursing (22) 44.0 (18) 45.0 (21) 50.0 0.83
Medicine (28) 66.7 (26) 61.9 (24) 63.2 0.89
Physical Education (TT) (23) 71.9 (26) 83.9 (22) 81.5 0.47
Legal Sciences (52) 51.5 (46) 53.5 (44) 56.4 0.81
Social Sciences (5) 35.7 (14) 63.6 (12) 48.0 0.25
History (18) 58.1 (25) 52.1 (24) 55.8 0.86
Philosophy (20) 50.0 (15) 44.1 (15) 53.6 0.75
Linguistics (HE) (12) 28.6 (24) 57.1 - 0.17
Linguistics (HI) (7) 29.2 (14) 58.3 - 0.04
LEA (15) 51.7 (12) 52.2 (11) 45.8 0.88
Social communication (16) 48.5 (12) 36.4 (9) 32.1 0.39
Chemical Engineering - (7) 63.6 (13) 61.9 0.92
Electrical Engineering - (8) 57.1 (13) 65.0 0.64
Civil Engineering - (7) 50.0 (14) 56.0 0.72
Mechanical Engineering - (8) 57.1 (18) 78.3 0.17
Linguistics (SH) - - (12) 25.0
-LEA: Foreign Languages applied to international negotiations; TT: teacher training: B: Bachelor; HI: specialization in English; HE: specialization in Spanish; SH: no specialization.
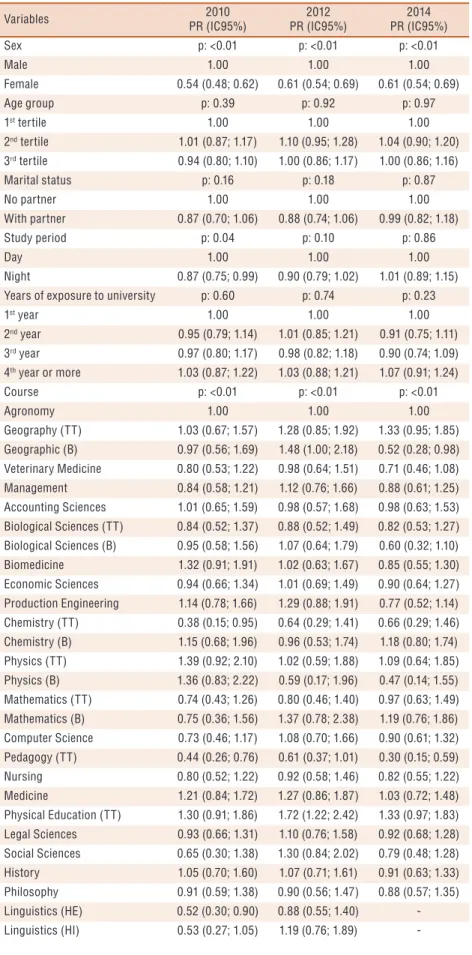
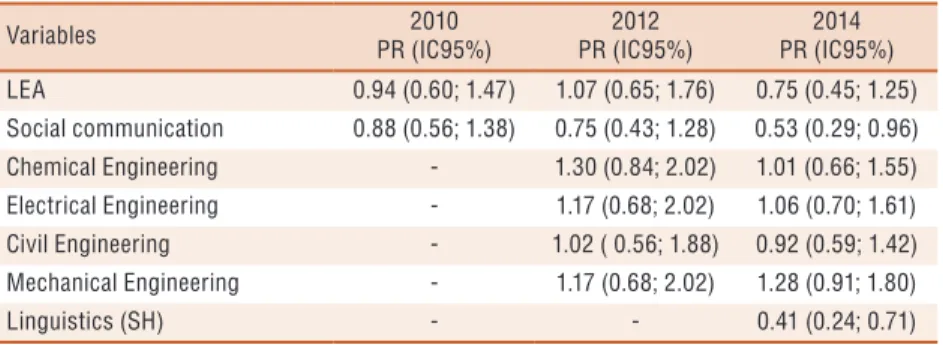
In the unadjusted analysis (Table 3) in the three surveys, the preva-lence of students active in LTPA was lower for women, in addition, in the 2010 survey, college students of the night shift had lower prevalence (PR: 0.87; 95% CI: 0.75-0.99) than their diurnal pairs. Students of Chemistry (TT), Pedagogy (TT) and Linguistics courses (HE) in the 2010 survey had lower LTPA prevalence, with PR values of 0.38 (95% CI: 0.15-0.95), 0.44 (95% CI: 0.26-0.76) and 0.52 (95% CI: 0.30-0.90), respectively; in the 2012 survey, students of the Physical Education (TT) course were more active during leisure (PR: 1.72; 95% CI: 1.22-2.42); and in the 2014 survey, students of Geography (B) (RP: 0.52; 95% CI: 0.28-0.98), Pedagogy (TT) (RP: 0.30; 95% CI: 0.15-0.59), Social Communication (PR: 0.53; 95% CI: 0.29-0.96) and Linguistics courses (SH) (PR: 0.41; 95% CI: 0.24, 0.71) had lower LTPA prevalence.
In the adjusted analyses (Table 4), women had lower LTPA prevalence than men. In the 2010 survey, students of Chemistry (TT) and Computer Science courses were less active during leisure time, and those of Biomedi-cine were approximately 1.5 times more active (95%CI: 1.04-2.09); in the 2012 survey, the Geography (B) and Physical Education (TT) students were more active during leisure time; and in the 2014 survey, Geography (TT) students were more active in leisure time and those of Pedagogy (TT) and Linguistics (SH) were less active during leisure.
Table 3. Unadjusted analysis between sociodemographic variables and link with the university with leisure-time physical activity in college. MONISA study.
Variables 2010
PR (IC95%)
2012 PR (IC95%)
2014 PR (IC95%)
Sex p: <0.01 p: <0.01 p: <0.01
Male 1.00 1.00 1.00
Female 0.54 (0.48; 0.62) 0.61 (0.54; 0.69) 0.61 (0.54; 0.69)
Age group p: 0.39 p: 0.92 p: 0.97
1st tertile 1.00 1.00 1.00
2nd tertile 1.01 (0.87; 1.17) 1.10 (0.95; 1.28) 1.04 (0.90; 1.20)
3rd tertile 0.94 (0.80; 1.10) 1.00 (0.86; 1.17) 1.00 (0.86; 1.16)
Marital status p: 0.16 p: 0.18 p: 0.87
No partner 1.00 1.00 1.00
With partner 0.87 (0.70; 1.06) 0.88 (0.74; 1.06) 0.99 (0.82; 1.18)
Study period p: 0.04 p: 0.10 p: 0.86
Day 1.00 1.00 1.00
Night 0.87 (0.75; 0.99) 0.90 (0.79; 1.02) 1.01 (0.89; 1.15)
Years of exposure to university p: 0.60 p: 0.74 p: 0.23
1st year 1.00 1.00 1.00
2nd year 0.95 (0.79; 1.14) 1.01 (0.85; 1.21) 0.91 (0.75; 1.11)
3rd year 0.97 (0.80; 1.17) 0.98 (0.82; 1.18) 0.90 (0.74; 1.09)
4th year or more 1.03 (0.87; 1.22) 1.03 (0.88; 1.21) 1.07 (0.91; 1.24)
Course p: <0.01 p: <0.01 p: <0.01
Agronomy 1.00 1.00 1.00
Geography (TT) 1.03 (0.67; 1.57) 1.28 (0.85; 1.92) 1.33 (0.95; 1.85)
Geographic (B) 0.97 (0.56; 1.69) 1.48 (1.00; 2.18) 0.52 (0.28; 0.98)
Veterinary Medicine 0.80 (0.53; 1.22) 0.98 (0.64; 1.51) 0.71 (0.46; 1.08)
Management 0.84 (0.58; 1.21) 1.12 (0.76; 1.66) 0.88 (0.61; 1.25)
Accounting Sciences 1.01 (0.65; 1.59) 0.98 (0.57; 1.68) 0.98 (0.63; 1.53)
Biological Sciences (TT) 0.84 (0.52; 1.37) 0.88 (0.52; 1.49) 0.82 (0.53; 1.27)
Biological Sciences (B) 0.95 (0.58; 1.56) 1.07 (0.64; 1.79) 0.60 (0.32; 1.10)
Biomedicine 1.32 (0.91; 1.91) 1.02 (0.63; 1.67) 0.85 (0.55; 1.30)
Economic Sciences 0.94 (0.66; 1.34) 1.01 (0.69; 1.49) 0.90 (0.64; 1.27)
Production Engineering 1.14 (0.78; 1.66) 1.29 (0.88; 1.91) 0.77 (0.52; 1.14)
Chemistry (TT) 0.38 (0.15; 0.95) 0.64 (0.29; 1.41) 0.66 (0.29; 1.46)
Chemistry (B) 1.15 (0.68; 1.96) 0.96 (0.53; 1.74) 1.18 (0.80; 1.74)
Physics (TT) 1.39 (0.92; 2.10) 1.02 (0.59; 1.88) 1.09 (0.64; 1.85)
Physics (B) 1.36 (0.83; 2.22) 0.59 (0.17; 1.96) 0.47 (0.14; 1.55)
Mathematics (TT) 0.74 (0.43; 1.26) 0.80 (0.46; 1.40) 0.97 (0.63; 1.49)
Mathematics (B) 0.75 (0.36; 1.56) 1.37 (0.78; 2.38) 1.19 (0.76; 1.86)
Computer Science 0.73 (0.46; 1.17) 1.08 (0.70; 1.66) 0.90 (0.61; 1.32)
Pedagogy (TT) 0.44 (0.26; 0.76) 0.61 (0.37; 1.01) 0.30 (0.15; 0.59)
Nursing 0.80 (0.52; 1.22) 0.92 (0.58; 1.46) 0.82 (0.55; 1.22)
Medicine 1.21 (0.84; 1.72) 1.27 (0.86; 1.87) 1.03 (0.72; 1.48)
Physical Education (TT) 1.30 (0.91; 1.86) 1.72 (1.22; 2.42) 1.33 (0.97; 1.83)
Legal Sciences 0.93 (0.66; 1.31) 1.10 (0.76; 1.58) 0.92 (0.68; 1.28)
Social Sciences 0.65 (0.30; 1.38) 1.30 (0.84; 2.02) 0.79 (0.48; 1.28)
History 1.05 (0.70; 1.60) 1.07 (0.71; 1.61) 0.91 (0.63; 1.33)
Philosophy 0.91 (0.59; 1.38) 0.90 (0.56; 1.47) 0.88 (0.57; 1.35)
Linguistics (HE) 0.52 (0.30; 0.90) 0.88 (0.55; 1.40)
-Variables 2010 PR (IC95%)
2012 PR (IC95%)
2014 PR (IC95%)
LEA 0.94 (0.60; 1.47) 1.07 (0.65; 1.76) 0.75 (0.45; 1.25)
Social communication 0.88 (0.56; 1.38) 0.75 (0.43; 1.28) 0.53 (0.29; 0.96)
Chemical Engineering - 1.30 (0.84; 2.02) 1.01 (0.66; 1.55)
Electrical Engineering - 1.17 (0.68; 2.02) 1.06 (0.70; 1.61)
Civil Engineering - 1.02 ( 0.56; 1.88) 0.92 (0.59; 1.42)
Mechanical Engineering - 1.17 (0.68; 2.02) 1.28 (0.91; 1.80)
Linguistics (SH) - - 0.41 (0.24; 0.71)
LEA: Foreign Languages applied to international negotiations; TT: teacher training: B: Bachelor; HI: specialization in English; HE: specialization in Spanish; SH: no specialization
Table 4. Adjusted analysis between sociodemographic variables and link with the university with leisure-time physical activity in college. MONISA study.
Variables 2010
PR (IC95%) p
2012
PR (IC95%) p
2014
PR (IC95%) p
Sex <0.01 <0.01 <0.01
Male 1.00 1.00 1.00
Female 0.54 (0.47; 0.61) 0.61 (0.54; 0.69) 0.61 (0.54; 0.69)
Age group 0.20 0.79 0.73
1st tertile 1.00 1.00 1.00
2nd tertile 0.99 (0.86; 1.15) 1.13 (0.98; 1.30) 1.03 (0.89; 1.19)
3rd tertile 0.91 (0.78; 1.06) 0.99 (0.86; 1.15)
Marital status 0.39 0.16 0.68
No partner 1.00 1.00 1.00
With partner 0.92 (0.75; 1.12) 0.88 (0.74; 1.05) 0.97 (0.81; 1.15)
Study period 0.06 0.12 0.88
Day 1.00 1.00 1.00
Night 0.84 (0.70; 1.01) 0.86 (0.71; 1.04) 0.98 (0.81; 1.20)
Years of exposure to university 0.99 0.62 0.23
1st year 1.00 1.00 1.00
2nd year 0.99 (0.83; 1.17) 1.02 (0.86; 1.21) 0.95 (0.79; 1.15)
3rd year 0.92 (0.77; 1.11) 1.03 (0.85; 1.23) 0.93 (0.77; 1.13)
4th year or more 1.01 (0.85; 1.19) 1.04 (0.88; 1.23) 1.08 (0.92; 1.26)
Course <0.01 0.049 <0.01
Agronomy 1.00 1.00 1.00
Geography (TT) 1.18 (0.78; 1.79) 1.40 (0.90; 2.18) 1.40 (1.04; 1.90)
Geographic (B) 0.97 (0.58; 1.63) 1.61 (1.08; 2.40) 0.62 (0.34; 1.15)
Veterinary Medicine 0.81 (0.55; 1.18) 1.09 (0.72; 1.66) 0.85 (0.56; 1.29)
Management 0.91 (0.64; 1.30) 1.24 (0.84; 1.84) 0.94 (0.68; 1.31)
Accounting Sciences 1.15 (0.74; 1.78) 1.09 (0.63; 1.88) 1.01 (0.68; 1.50)
Biological Sciences (TT) 1.12 (0.68; 1.84) 1.04 (0.64; 1.71) 0.90 (0.59; 1.38)
Biological Sciences (B) 0.90 (0.55; 1.46) 1.24 (0.76; 2.02) 0.70 (0.39; 1.25)
Biomedicine 1.47 (1.04; 2.09) 1.05 (0.66; 1.67) 0.98 (0.64; 1.52)
Economic Sciences 1.02 (0.73; 1.42) 1.16 (0.79; 1.71) 0.96 (0.69; 1.34)
Production Engineering 1.01 (0.72; 1.42) 1.24 (0.85; 1.80) 0.77 (0.53; 1.13)
Chemistry (TT) 0.29 (0.10; 0.80) 0.72 (0.33; 1.55) 0.73 (0.37; 1.44)
Chemistry (B) 1.20 (0.76; 1.90) 0.99 (0.54; 1.82) 1.35 (0.93; 1.97)
Physics (TT) 1.27 (0.82; 1.97) 1.08 (0.54; 1.98) 1.05 (0.63; 1.75)
Physics (B) 1.02 (0.63; 1.66) 0.47 (0.14; 1.56) 0.42 (0.13; 1.37)
Mathematics (TT) 0.84 (0.49; 1.45) 0.98 (0.56; 1.73) 0.95 (0.62; 1.44)
… continue
DISCUSSION
In the three surveys, about 50% of students were classiied as active in leisure time, but with no statistical diference. However, in the analysis of percentage delta, students of Geography (B) course decreased the practice in 2014 and those of Linguistics (HI) increased from one survey to another. Among the factors associated with LTPA practice, it is emphasized that women had lower chances of adoption of this behavior, as shown in the three surveys; in 2010, students of Chemistry (TT) and Computer Science courses had lower LTPA prevalence, but those of Biomedicine were more active in leisure time; in the 2012 survey, students of Geography (B) and Physical Education (TT) courses were more active during leisure time; in the 2014 survey, students of Geography (TT) course were more active in leisure time and students of Pedagogy and Linguistics (SH) were less active during leisure time.
he prevalence of active students in leisure time remained similar among surveys, and this stabilization was also evidenced in surveys con-ducted in Brazilian capitals through the VIGITEL system 20. he
propor-tions of active students in leisure time in this study were lower than found in cross-sectional surveys with Physical Education students from the same institution (76.9%) and 17 irst-year students at the university (57.1%) of Pelotas, RS 7. in a study conducted in Mauritius, three out of ive university
students reached the recommended level of LTPA 9. In could be concluded
Variables 2010
PR (IC95%) p
2012
PR (IC95%) p
2014
PR (IC95%) p
Mathematics (B) 0.75 (0.38; 1.51) 1.32 (0.73; 2.40) 1.16 (0.75; 1.81)
Computer Science 0.62 (0.39; 0.98) 0.92 (0.60; 1.40) 0.83 (0.58; 1.21)
Pedagogy (TT) 0.61 (0.36; 1.04) 0.83 (0.50; 1.37) 0.39 (0.20; 0.76)
Nursing 1.00 (0.66; 1.51) 1.02 (0.65; 1.61) 1.06 (0.71; 1.57)
Medicine 1.17 (0.83; 1.64) 1.20 (0.82; 1.75) 1.04 (0.74; 1.46)
Physical Education (TT) 1.34 (0.98; 1.83) 1.62 (1.16; 2.25) 1.41 (1.05; 1.90)
Legal Sciences 0.95 (0.68; 1.32) 1.16 (0.80; 1.67) 1.00 (0.73; 1.37)
Social Sciences 0.74 (0.34; 1.61) 1.60 (0.95; 2.69) 0.92 (0.57; 1.48)
History 1.09 (0.73; 1.63) 1.22 (0.81; 1.83) 0.88 (0.62; 1.26)
Philosophy 1.06 (0.69; 1.62) 0.99 (0.61; 1.61) 0.94 (0.62; 1.41)
Linguistics (HE) 0.74 (0.42; 1.31) 1.21 (0.75; 1.94)
-Linguistics (HI) 0.64 (0.33; 1.23) 1.28 (0.80; 2.04)
-LEA 1.02 (0.65; 1.59) 1.03 (0.62; 1.71) 0.81 (0.50; 1.32)
Social communication 1.05 (0.68; 1.62) 0.85 (0.50; 1.44) 0.59 (0.33; 1.06)
Chemical Engineering - 1.25 (0.76; 2.08) 1.11 (0.73; 1.69)
Electrical Engineering - 1.05 (0.64; 1.72) 1.03 (0.68; 1.57)
Civil Engineering - 0.87 (0.48; 1.56) 0.94 (0.62; 1.44)
Mechanical Engineering - 1.08 (0.62; 1.89) 1.21 (0.88; 1.67)
Linguistics (SH) - - 0.50 (0.29; 0.87)
LEA: Foreign Languages applied to international negotiations; TT: teacher training: B: Bachelor; HI: specialization in English; HE: specialization in Spanish; SH: no specialization; 2010 survey: adjusted for sex, age group, study period and course; 2012 survey: adjusted for sex, marital status, study period and course; 2014 survey: adjusted for sex and course.
that even in diferent proportions, the practice of LTPA is a behavior that has been adopted by part of students, especially for representing a popula-tion group composed of young people.
Women were less active during leisure time than men, similar to results found in other studies 7,9,21,22. he type of activities performed in childhood
can be a factor that justiies this behavior in adulthood 23. he preference of
boys for higher energy expenditure activities and greater opportunities to develop games with movements that favor the development of pre-sports motor skills may explain this divergence 24.
In a national study on the preferences of LTPA in university students, women sought more often physical activities such as walking, take the dog for a walk and men activities related to games and recreation 25. his
behavioral diference is based on the social roles established to sports for the genera, as reported by female students, in which parents considered the sport as not adequate 9.
In this research, it was observed in the 2010 survey that there was no association between study period and LTPA practice, after controlling for sex, age group and course. On the other hand, Fontes and Viana 4 observed
that students in the night period were more likely to show low levels of physical activity, regardless of sex and age, and Quadros et al. 26, in a study
with students of the Federal University of Santa Catarina, SC, regardless of sociodemographic variables (sex, parental education and economic conditions). Sociodemographic characteristics and course requirements may limit the possibilities of LTPA practice; however, other barriers such as distance to the place of practice, lack of facilities, lack of money and security conditions can maximize this occurrence 27.
Regarding undergraduate courses, it was shown that there was no consensus of courses associated with LTPA practice in surveys. In other studies, university students of health-related courses had higher prevalence of LTPA practice 7, and it is noteworthy that students of the Physical
Education course showed greater involvement with LTPA when compared to those of other courses 5,7. he results obtained in this study corroborate
those from a survey conducted at a university in northeastern Brazil, which showed higher levels of physical activity in all domains (leisure, displacement, home activities and work) in students of Health and Hu-man Sciences, Linguistics courses, and the lower levels among students of Social Sciences courses 4.
he involvement of students for longer and more frequently in rec-reational activities, especially in the company of family is associated with greater satisfaction with life 28. In this context, it is understandable to
airm the relevance of the proposal of permanent policies focusing on healthy lifestyles of university students because there is lack of quality environments and university policies to encourage physical activity and recreation programs 29.
exclusion of students who participated in two or more surveys, and this overlapping among surveys was approximately 7% between 2010 and 2012 and between 2012 and 2014, and about 3% between 2010 and 2014. his lower frequency of repetition of subjects among surveys did not represent a bias in the comparisons of proportions due to the time between sur-veys (two years), which allows changing the status of students between diferent independent variables such as age and years of exposure to the university, as well as the possibility of adopting LTPA practice behavior. In addition, the use of a questionnaire to survey behavioral information is recognized as a limitation due to the overestimation of positive health behaviors. However, the agreement levels of the question on LTPA of the instrument are suitable for use in research with university students 16.
Finally, it is important to highlight the uniqueness aspect of this study, for monitoring for ive years (three surveys) the lifestyle of many students in the same higher education institution.
CONCLUSION
In all surveys, the prevalence of LTPA was observed in approximately half of the students, demonstrating behavioral signs of stabilization. he prevalence of LTPA was lower in women. Students of Chemistry (TT), Pedagogy (TT) and Linguistics courses (SH) were less active during leisure. On the other hand, those of Geography (B), Physical Education (TT) and Biomedicine courses were more active during leisure.
he monitoring of LTPA practice can contribute to the understanding of this behavior in university students and to the promotion of programs or projects aimed at encouraging the adoption of this behavior. LTPA practice plays an important role for achieving health beneits and due to this protective role, actions should be carried out with a focus on health in this population group.
REFERENCES
1. Sousa TF, José HPM, Barbosa AR. Condutas negativas à saúde em estudantes universitários brasileiros. Ciênc Saúde Coletiva 2013;18(12):3563-75.
2. Kim SYS, Kwiterovich PO. Childhood prevention of adults chronic diseases: ra-tionale and strategies. In: Cheung, LWY, Richmond JB. Child health, nutrition, and physical activi ty. Champaign, IL: Human Kinetics; 1995.
3. Alves JGB, Montenegro FMU, Oliveira FA, Alves RV. Prática de esportes durante a adolescência e atividade física de lazer na vida adulta. Rev Bras Med Esporte 2005;11(5):291-4.
4. Fontes ACD, Vianna RPT. Prevalência e fatores associados ao baixo nível de atividade física entre estudantes universitários de uma universidade pública da região Nordeste - Brasil. Rev Bras Epidemiol 2009;12(1):20-9.
5. Silva GSF, Bergamaschine R, Rosa M, Melo C, Miranda R, Filho MB. Avaliação do nível de atividade física de estudan tes de graduação das áreas saúde/biológica. Rev Bras Med Esporte 2007;13(1):39-42.
7. Mielke GI, Ramis TR, Campos E, Habeyche, Oliz MM, Germano M, et al. Ativi-dade física e fatores associados em universitários do primeiro ano da UniversiAtivi-dade Federal de Pelotas. Rev Bras Ativ Fís Saúde 2010;15(1):57-64.
8. Pedišić Ž, Greblo Z, Phongsavan P, Milton K, Bauman AE. Are Total, Intensity-and Domain-Speciic Physical Activity Levels Associated with Life Satisfaction among University Students? PLoS ONE 2015;10(2):1-21.
9. Chan Sun M, Azmutally KB. Leisure-time physical activity among university students in Mauritius. Am J Health Research 2013;1(1):1-8.
10. Fagarasa SP, Radub LE, Vanvuc G. he Level of Physical Activity of University Students. Procedia Soc Behav Sci 2015;197(1):1454-7.
11. Lapa TY. Physical Activity Levels and Psychological Well-Being: A Case Study of University Students. Procedia Soc Behav Sci 2015;186(1):739-43.
12. Marcondelli P, Costa THM, Schmitz BAS. Nível de ativi dade física e hábitos alimentares de universitários do 3ºao 5ºsemestres da área da saúde. Rev Nutr 2008;21(1):39-47.
13. Oliveira CS, Gordia AP, Quadros TMB, Campos W. Atividade Física de universi-tários brasileiros: uma revisão da literatura. Rev Bras Ciên Saúde 2014;12(42):71-7.
14. Eratay E, Aydoğan Y. Study Of he Relationship Between Leisure Time Activities And Assertiveness Levels Of Students Of Abant Izzet Baysal University. Procedia Soc Behav Sci 2015;191(1):2213-8.
15. Sousa TF, Fonseca AS, José HPM, Nahas MV. Estudo MONISA: características e aspectos metodológicos. Rev Bras Epidemiol 2012;5(4):904-7.
16. Sousa TF, Fonseca SA, Mororó JHP, Nahas MV. Validade e reprodutibilidade do questionário Indicadores de Saúde e Qualidade de Vida de Acadêmicos (Isaq-A). Arq Ciênc Esporte 2013;1(1):21-30.
17. Sousa TF, Santos SFS, Pie ACS, Rossato LC. Associação entre indicadores de prática de atividades físicas na adolescência com o nível atual de prática de atividades físicas no lazer em acadêmicos de um curso de Educação Física no Nordeste do Brasil. Pensar Prát 2009;12(3):1-12.
18. Sousa TF, Barbosa AR, Santos SFS, Alvarenga AM, Fonseca SA, Nahas MV. Association between Physical Education program in school and the practice team sports during university. Rev Bras Cineatropom Desempenho Hum 2016;18(2):222-32.
19. Sousa TF. Inatividade física em universitários brasileiros: uma revisão sistemática. Rev Bras Ciênc Saúde (IMES) 2011;9(29):47-55.
20. Hallal PC, KnuthI AG, Reis RS, RombaldiI AJ, Malta DC, Iser BPM et al. Tendências temporais de atividade física no Brasil (2006-2009). Rev Bras Epide-miol 2011;14(Supl.1):53-60.
21. Abolfotouh MA, Bassiouni FA, Mounir GM, Fayyad RCh. Health-related lifestyle and risk behaviours among students living in Alexandria University hostels. East Mediterr Health J 2007;13(2):376-91.
22. Mendes Netto RS, Silva CS, Costa D e Raposo OFF. Nível de atividade física e qualidade de vida de estudantes universitários da área de saúde. Rev Bras Ciên Saúde 2012;10(34):47-54
23. Hallal PC, Victora CG, Azevedo MR, Wells JC. Adolescent physical activity and health: a systematic review. Sports Medicine 2006;36(12):1019-30.
24. Salles-Costa R, Werneck GL, Lopes CS, Faerstein E. Associação entre fatores sociodemográicos e prática de atividade física de lazer no Estudo Pró-Saúde. Cad Saúde Pública 2003;19(4):1095-105.
25. Nunes MFO, Pires JG, Azevedo C, Hutz CS. Satisfação e autonomia nas atividades de lazer entre universitários. Psicol Teor Prát 2014;16(1):91-103.
CORRESPONDING AUTHOR
Sueyla Ferreira da Silva dos Santos Endereço: R. Roberto Símonsen, 300 - Centro de Estudos do Laboratório de Avaliação e Prescrição da Atividade Motora (CELAPAM), Presidente Prudente - SP, 19060-900.
E-mail: [email protected] 27. Sousa TF, Fonseca AS, Barbosa AR. Perceived barriers by university students in
relation the leisure-time physical activity. Rev Bras Cineantropom Desempenho Hum 2013;15(2):164-73.
28. Tercan E. An Examination of Leisure Participation, Family Assessment and Life Satisfaction in University Students. Procedia Soc Behav Sci 2015;186(1):58-63.