Rev Bras
Cineantropom
Hum
DOI: http://dx.doi.org/10.5007/1980-0037.2016v18n5p509
original article
Diseases and chronic health conditions,
multimorbidity and body mass index
in older adults
Doenças e condições crônicas de saúde, multimorbidade
e índice de massa corporal em idosos
João de Souza Leal Neto1
Aline Rodrigues Barbosa2
Vandrize Meneghini1
Abstract – he aim of this study was to analyze the association between diseases and chronic health conditions, multimorbidity and body mass index (BMI) in older adults from southern Brazil. Epidemiological cross-sectional study, with household basis was carried out with 343 older adults aged 60-79 years, selected by probability sampling and all aged 80 years or older (n=134). Hypertension, diabetes, cancer, chronic pulmonary diseases, coronary heart disease, cerebrovascular disease, arthritis, osteoporosis, depression, history of falls and dependency in activities of the daily living were assessed by self-report. Associations between independent variables and BMI (outcome) were tested using simple and multiple linear regression. Participated in the study 270 women (73.2±8.8 years) and 207 men (73.3±9.0 years). After adjustment (age, education, living arrangement, smoking, alcohol consumption, waist circumference, cognitive status and all other dis-ease and chronic health conditions), the associations identiied were: hypertension with higher BMI values (β 3.43; 95%CI: 2.38 to 4.48), for women, and chronic pulmonary disease with lower BMI values (β -2.05; 95%CI: -3.50 to -0.60). here was a linear trend between number of diseases and BMI for both sexes. Conclusion: he results showed an independent association between speciic chronic diseases and BMI. Monitoring of nutritional status in older adults is important to identify extreme BMI values, especially those with more than two diseases and chronic health conditions.
Key words: Aging; Body weight; Chronic diseases.
Resumo – O estudo teve como objetivo analisar a associação entre doenças e condições crônicas de saúde, multimorbidade e índice de massa corporal (IMC) em idosos do sul do Brasil. Estudo epidemiológico transversal, de base domiciliar. Foram entrevistados 477 pessoas, sendo 343 de 60 a 79 anos (amostragem probabilística) e todos aqueles com 80 anos ou mais (n=134). A hipertensão, diabetes, câncer, doença crônica pulmonar, doença coronariana, doença vascular cerebral, artrite, osteoporose, depressão, o histórico de quedas e dependência nas atividades da vida diária foram avaliados por meio de autorrelato. As associações entre as variáveis independentes e o IMC (desfecho) foram testadas por meio de regressão linear simples e múltipla. Participaram da pesquisa 270 mulheres (73,2±8,8 anos) e 207 homens (73,3±9,0 anos). Após ajuste (idade, escolaridade, arranjo familiar, tabagismo, consumo de álcool, circunferência da cintura, estado cognitivo e todas as doenças e condições crônicas de saúde) as associações identiicadas foram:
hipertensão e maiores valores de IMC (β 3,43; IC95%: 2,38 a 4,48), para as mulheres e; doença
crônica pulmonar e menores valores de IMC (β -2,05; IC95%: -3,50 a -0,60). Houve tendência
linear entre o número de doenças e condições crônicas de saúde e o IMC, para ambos os sexos. Os resultados mostraram associação independente entre doenças crônicas especíicas e IMC. O monitoramento do estado nutricional da população idosa é importante para identiicar valores
1 Federal University of Santa Cata-rina. Graduate Program in Physical Education. Florianópolis, SC. Brazil.
2 Federal University of Santa Catarina. Sports Center. Department of Physical Education. Florianópolis, SC. Brazil.
INTRODUCTION
Population aging is the largest demographic phenomenon of the twenty-irst century and one of the main problems of this process is the high preva-lence of chronic noncommunicable diseases, account for most morbidity and mortality burden in Brazil1. In addition to diseases, other persistent
chronic health conditions that require some sort of care impair mobility and autonomy, such as falls and disabilities2, also contribute to increase
spending in the health sector3.
he simultaneity of diseases/symptoms, functional, cognitive and physical limitations, deined as multimorbididity4 is a common condition
in the elderly1,3. Data from the Brazilian National Survey of Household
Sample (PNAD 2008) showed that 5.9% of the population reported hav-ing three or more chronic diseases and the proportion increases with age. Among older adults, 79.1% reported having at least one chronic disease, 15.2% reported restrictions in usual activities and about 12% reported hospitalization history in the last 12 months5.
Along with the presence of diseases and / or other chronic health conditions, vulnerable nutritional status, identiied by body mass index (BMI) is common among the elderly6. Both overweight and underweight
are factors associated with morbidity and mortality in these individuals. hat is, association between all-cause mortality / morbidity occurs in the form of U-shaped curve, with wide base7,8. Generally, associations between
chronic health conditions and BMI are checked for speciic diseases using BMI cutof values used in epidemiological surveillance9 or determined by
roc curve10. he association between BMI and multimorbididity is scarce
in literature11. Moreover, the association of this indicator as a continuous
variable in the context of multimorbididity has not been explored. According to literature (Medline, Scielo, from 2010 to Jan/2015), studies investigating multimorbidity and BMI in the elderly have not been identiied. Only one study conducted in the UK found association between multimorbidities and overweight/obesity in 300,006 adults (≥30 years) seen in the primary health care11.
It is believed that the use of BMI as a continuous variable will enable studying the association between diseases and chronic health conditions throughout BMI distribution with no loss of information due to categoriza-tion12. Given the above, the aim of this study was to analyze the association
between chronic diseases, multimorbidities and body mass index in the elderly of a community in southern Brazil.
METHODOLOGICAL PROCEDURES
living in small rural properties. Older adults accounted for 12.3% of the population13. Access to primary health care was conducted through a basic
health unit and three Family Health Strategy Program (FHS) teams that met the entire population in three distinct areas.
he study population consisted of individuals aged 60 years or older (N = 917) of both sexes, residents in rural and urban areas. he identiication of individuals was made from the FHS records in 2009. For the age group of 60-79 years (n = 783), 343 individuals selected by probabilistic sampling were interviewed (margin of error of 5.0 percentage points, prevalence of 50% for unknown outcome and sample loss of 15%), according to the FHS area. All individuals aged 80 years and over were interviewed.
Sample loss criteria were absence of informant, person not found after at least three visits (every other day) and lack of access to residence due to unfavorable conditions of rural roads.
he research protocol was approved by the Ethics Committee on Hu-man Research of the Federal University of Santa Catarina, under protocol No. 189/09 and with the agreement signed for participation. In the case of participant’s inability to sign the consent form, guardians were asked to sign.
Data were collected on a special form based on the SABE-Survey on Health, Welfare and Aging questionnaire (http://www.fsp.usp.br/sabe/ index.php). SABE survey was conducted in six countries in Latin America and the Caribbean, including Brazil. Interviews were realized at the resi-dence in just one visit. Data were collected by previously trained students (undergraduate and graduate).
Explanatory variables
he presence of chronic disease (yes or no) was identiied by the following question: “Has a doctor or nurse ever told you that you have ...” hyper-tension; diabetes; cancer (excluding minor skin cancers); chronic lung disease; coronary disease; cerebrovascular disease; arthritis, rheumatism, osteoarthritis; osteoporosis or depression.
Information on falls (yes or no) was obtained through the following question: “Have you had any fall in the last 12 months?
Questions related to dependency (yes or no) in basic activities of the daily living (ADLs) investigated the presence or absence of diiculty to cross a room walking; dressing up; taking a bath; feeding; sitting and getting up from the bed and going to the bathroom. Individuals were considered dependent (yes) when they reported diiculty performing one or more tasks.
least one of the questions were classiied according to most answers given to other questions, since this alternative is more related to personal habits than to performance diiculties14. Individuals were considered dependent
(yes) when they presented diiculties to perform one or more tasks.
Dependent variable
Body mass index (BMI = body mass / [height] ²) was calculated from body mass (BM) and height measurements.
In case of impossibility or diiculty to obtain body mass measurement, the equation proposed by Chumlea et al.15 was used, that takes into account
the arm and calf circumference values . Knee height measurement was used to estimate height by means of the equation proposed by Chumlea et al.16.
Measurements were performed in triplicate (excluding body weight) and the average value of each was used. Height and knee height were measured according to Chumlea et al.16 and circumferences were measured
according to standardization of Callaway et al.17
Adjustment variables
he variables used were: age (in years), education (literate or illiterate); living arrangement (lives alone or lives accompanied), smoking (never smoked, former smoker or current smoker), alcohol consumption (> once/ week or < once/week). Cognitive status (normal or abnormal) was veriied by the Mini-Mental State Examination (MMSE), considering the value > 13 points as without probable cognitive deicit18. Waist circumference
(continuous variable) was measured using inelastic tape according to the Callaway et al.17 protocol.
Statistical procedure
Descriptive analysis used: mean, standard deviation (continuous variables) and proportion of individuals (categorical variables), according to each one of them and according to sex. For the assessment of gender diferences in the descriptive variables, conidence interval (95% CI) was used.
In assessing the association between chronic diseases and BMI, multiple linear regression (crude and adjusted) with respective conidence intervals (95% CI) was used. hree regression models for association of chronic diseases and BMI were considered: 1) adjusted for age, living ar-rangement and education; 2) age, education, living arar-rangement, smoking, alcohol consumption, waist circumference and cognitive state; 3) adjusted for all the above variables and all diseases and chronic health conditions (IADLs, ADLs and falls).
For trend analysis between mean BMI values and number of chronic diseases (multimorbididity), multiple linear regression adjusted for age, education, living arrangement, smoking and cognitive status was used.
RESULTS
Study participants were 270 women (56.6%) and 207 men (43.4%). he age ranged from 60 to 100 years (73 ± 8.9 years). he average age of women was 73.2 ± 8.8 years and men 73.3 ± 9.0 years.
According to Table 1, compared to women, men showed higher fre-quency of individuals who lived with other people, alcohol consumers and smokers. In relation to chronic conditions, women showed higher incidence of hypertension, diabetes, arthritis / rheumatism / arthritis, depression, osteoporosis, history of falls and dependency in ADLs and IADLs.
Table 1. Sample distribution according to sex and characteristics investigated. Antonio
Carlos-SC (2010-2011).
Male (n=207) Female (n=270) % (95% CI) % (95% CI) Education
Literate 76.7 (72.5-80.9) 87.0 (84.1-89.9)
Illiterate 23.3 (19.1-27.5) 13.0 (10.1-15.9) Living arrangement
Lives alone 5.6 (3.3-7.9) 18.8 (15.4-22.2)
Lives accompanied 94.4 (92.1-96.7) 81.2 (77.8-84.6) Smoking
Never smoked 39.3 (34.5-44.1) 92.7 (90.5-94.9) Ex-smoker / smoker 60.7 (55.9-65.5) 7.3 (5.1-9.5) Alcohol consumption
< Once a week 67.4 (62.8-72.0) 96.4 (94.8-98.0) > Once a week 32.6 (28.0-37.2) 3.6 (2.0-5.2) Abnormal cognitive state 6.6 (4.1-9.1) 11.9 (9.1-14.7) Hypertension 58.8 (53.9-63.7) 80.3 (76.9-83.7)
Diabetes 12.1 (8.9-15.3) 25.2 (21.5-28.9)
Cancer 7.0 (4.5-9.5) 4.1 (2.4-5.8)
Chronic lung disease 11.6 (8.4-14.8) 10.6 (7.9-13.3) Coronary heart disease 25.8 (20.0-31.6) 28.4 (24.5-32.3) Cerebrovascular disease 7.6 (5.0-10.2) 7.7 (5.4-10.0) Arthritis / rheumatism / arthrosis 21.7 (17.6-25.8) 40.1 (35.9-44.3) Depression 26.5 (22.1-30.9) 36.6 (32.4-40.8)
Osteoporosis 4.0 (0.0-10.9 31.3 (27.2-35.4)
Falls in the last year 15.8 (12.2-19.4) 31.4 (27.4-35.4)
ADLs 21.9 (17.8-26.0) 29.9 (26.0-33.8)
IADLs 33.4 (28.7-38.1) 51.6 (47.3-55.9)
CI: confidence interval; ADLs: basic activities of the daily living; IADLs: instrumental activities of the daily living.
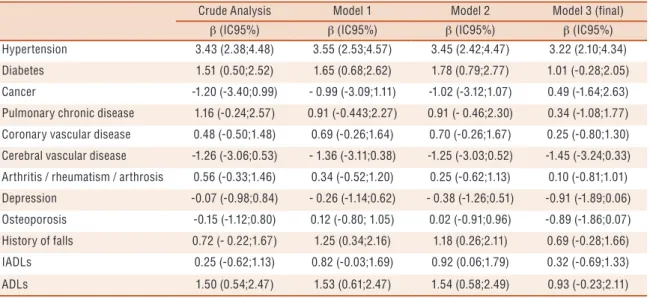
Tables 2 and 3 show the results of associations between chronic conditions and body mass index for women and men, respectively. In simple analyses, for women, BMI was 3.43 kg / m2 higher for those with hypertension (β 3.43; 95%
CI 2.38 to 4.48; p≤0,001) and at least 1.5 kg / m2 higher for those with diabetes
living arrangement, education, smoking, waist circumference, cognitive status and alcohol consumption), BMI was at least 1.18 kg / m2 lower for women with
history of falls. Hypertension, diabetes and dependency in ADLs remained associated with BMI with few diferences in magnitude. In the inal model adjusted for all diseases and chronic conditions, only hypertension (β 3.22; 95% CI 2.10 to 4.34; p≤0.001) remained positively associated with BMI (Table 2).
Table 2. Simple and multiple linear regression analysis to test association between each chronic disease and BMI in women. Antônio Carlos, Santa Catarina (2010-2011).
Crude Analysis Model 1 Model 2 Model 3 (final)
β (IC95%) β (IC95%) β (IC95%) β (IC95%) Hypertension 3.43 (2.38;4.48) 3.55 (2.53;4.57) 3.45 (2.42;4.47) 3.22 (2.10;4.34) Diabetes 1.51 (0.50;2.52) 1.65 (0.68;2.62) 1.78 (0.79;2.77) 1.01 (-0.28;2.05)
Cancer -1.20 (-3.40;0.99) - 0.99 (-3.09;1.11) -1.02 (-3.12;1.07) 0.49 (-1.64;2.63) Pulmonary chronic disease 1.16 (-0.24;2.57) 0.91 (-0.443;2.27) 0.91 (- 0.46;2.30) 0.34 (-1.08;1.77) Coronary vascular disease 0.48 (-0.50;1.48) 0.69 (-0.26;1.64) 0.70 (-0.26;1.67) 0.25 (-0.80;1.30) Cerebral vascular disease -1.26 (-3.06;0.53) - 1.36 (-3.11;0.38) -1.25 (-3.03;0.52) -1.45 (-3.24;0.33)
Arthritis / rheumatism / arthrosis 0.56 (-0.33;1.46) 0.34 (-0.52;1.20) 0.25 (-0.62;1.13) 0.10 (-0.81;1.01) Depression -0.07 (-0.98;0.84) - 0.26 (-1.14;0.62) - 0.38 (-1.26;0.51) -0.91 (-1.89;0.06) Osteoporosis -0.15 (-1.12;0.80) 0.12 (-0.80; 1.05) 0.02 (-0.91;0.96) -0.89 (-1.86;0.07)
History of falls 0.72 (- 0.22;1.67) 1.25 (0.34;2.16) 1.18 (0.26;2.11) 0.69 (-0.28;1.66) IADLs 0.25 (-0.62;1.13) 0.82 (-0.03;1.69) 0.92 (0.06;1.79) 0.32 (-0.69;1.33)
ADLs 1.50 (0.54;2.47) 1.53 (0.61;2.47) 1.54 (0.58;2.49) 0.93 (-0.23;2.11)
CI: confidence interval; ADLs: basic activities of the daily living; IADLs: instrumental activities of the daily living. Model 1: age, living arrangement and education; Model 2: age, education, living arrangement, smoking, alcohol consumption, waist circumference and cognitive status; Model 3 (final): Adjusted for all of the above variables and all diseases and chronic health conditions.
In men, hypertension (β 2.27; 95% CI 1.35 to 3.19; p≤0.001) and diabetes (β 2.82; 95% CI 1.38 to 4.28; p≤0.001) were also associated with BMI, the irst in lower and the second in higher magnitude than for women. BMI was 2.05 kg / m2 lower for men with report of chronic lung
disease (β -2.05, 95% CI -3.50 to -0.60; p≤0.001) and 1.57 kg / m2 lower
for those with history of falls in the last year (β -1.57, 95% CI -2.85 to -0.29; p≤0.016). In the adjusted analyses, associations of BMI with high blood pressure, diabetes and chronic lung disease were kept up to the ad-justment in model 2 (age, education, living arrangement, smoking, waist circumference, cognitive status and alcohol consumption). In the inal model adjusted for other chronic conditions, only chronic lung disease remained inversely associated with BMI. BMI values were 42% lower in men reporting chronic lung disease (β - 1.71, 95% CI -2.41 to -1.01; p≤0.001) when compared to data from the crude analysis.
Table 3. Simple and multiple linear regression analysis to test association between each chronic disease and BMI in men. Antônio Carlos, Santa Catarina (2010-2011).
Crude Analysis Model 1 Model 2 Model 3 (final)
β (95% CI) β (95% CI) β (95% CI) β (95% CI) Hypertension 2.27 (1.35;3.19) 2.34 (1.47;3.22) 1.80 (0.92;2.69) 0.15 (-0.28;0.58)
Diabetes 2.82 (1.38;4.28) 2.30 (0.91;3.70) 1.64 (0.24;3.04) -0.29 (-0.98;0.40) Cancer -0.50 (-2.42;1.41) -0.67 (-2.54;1.20) -1.66 (-3.48;0.16) 0.10 (-0.82;0.84) Pulmonary chronic disease - 2.05(-3.50;-0.60) -1.20 (-2.61;0.22) -1.99 (-3.38;0.60) -1.71 (-2.41;-1.01) Coronary vascular disease 0.71 (-0.35;1.79) 1.28 (0.26;2.30) 0.77 (-0.24;1.79) -0.47 (-0.97;0.03)
Cerebral vascular disease - 0.35 (-2.20;1.48) 0.01 (-1.73;1.75) - 1.06 (-2.77;0.66) -0.74 (-1.58;0.09) Arthritis / rheumatism / arthrosis - 0.10 (-1.22;1.01) - 0.01 (-1.08;1.05) 0.06 (-0.97;1.10) 0.17 (-0.32; 0.67) Depression 0.29 (-0.80;1.40) 0.08 (-0.96;1.13) - 0.40 (1.42;0.62) 0.09 (-0.38;0.56) Osteoporosis - 2.04 (-4.36;0.28) -2.17 (-4.37;0.02) -1.52 (-3.69;0.65) -0.53 (-1.60;0.53)
History of falls - 1.57(-2.85;-0.29) -0.62 (-1.89;0.65) - 0.36 (-1.59;0.87) 0.39 (-0.20;0.97) IADLs - 0.14 (-1.16;0.87) 0.30 (-0.69;1.28) -0.28 (-0.73;0.17) -0.14 (-0.61;0.33)
ADLs 1.02 (-0.16;2.20) 1.15 (0.03;2.28) 0.50 (- 0.61;1.60) -0.53 (-1.08;0.02)
CI: confidence interval; ADLs: basic activities of the daily living; IADLs: instrumental activities of the daily living. Model 1: age, living arrangement and education arrangement. Model 2: age, education, living arrangement, smoking, alcohol consumption, waist circumference and cognitive status. Model 3 (final): Adjusted for all of the above variables and all diseases and chronic health conditions.
Figure 1. Trend analysis graph of BMI and number of diseases and disorders in men and women from a community in southern Brazil
DISCUSSION
he results showed diferences between men and women in the estimated prevalence of diseases and chronic health conditions. Similarly, diseases and chronic health conditions associated with BMI difered between sexes. In women, hypertension was independently associated with higher BMI and chronic lung disease was associated with lower BMI values for men. In addition, the number of diseases and chronic health conditions showed a signiicant linear trend with BMI for men and women.
Gender diferences in health conditions have been previously identiied in epidemiological studies with older adults6,9,10,14. Women in this study had
Association between hypertension and higher BMI for women is consistent with previous studies9,20,21. However, unlike the present study,
this association has been identiied by categorized BMI using diferent cutofs to classify overweight9,20. It is noteworthy that studies20,21 did not
make adjustments for other diseases or chronic health conditions or just adjustment for diabetes9, a frequent comorbidity of hypertension.
Although the mechanisms involved in the association between hyper-tension and overweight are not yet fully understood, some physiological changes and body dysfunctions that occur in overweight individuals have implications in this relationship. In these individuals, there is greater ac-tivation of the sympathetic nervous system and in the renin-angiotensin-aldosterone system, in addition to the renal dysfunction, insulin resistance and leptin, and reduced action of natriuretic peptides22.
In women, hormonal changes after menopause play an important role in body weight gain and presence of hypertension. he efects of estrogens on smooth endothelial and vascular cells serve to prevent and protect against vasoconstriction, and in menopause, with decreased levels of this hormone, the efect is lost, resulting in higher blood pressure values22. Overweight is
common condition in women aged 60 years and over6,9 and although weight
gain cannot be attributed to menopause, hormonal changes are associated with increased body fat and increased fat in the abdominal region23.
he results showed an association between chronic lung disease and lower BMI values for men. his association is consistent with studies that ind association of this disease and low weight without adjustment for other diseases24.
Older men are more likely to develop chronic obstructive pulmonary disease (COPD) due to exposure to risk factors, including the frequent consumption of tobacco24. Reduced body weight is common in subjects
with COPD mainly due to loss muscle mass, but reduction in body fat is less signiicant25. in addition, the proinlammatory status of individuals
with COPD increases energy expenditure, which favors weight loss24.
Individuals with COPD require 20% energy supplementation in relation to basal values26, in addition to high levels of catecholamines that induce
hypermetabolism, increasing energy expenditure and muscle catabolism. he results of the trend analysis between number of diseases and chronic health conditions and BMI indicated a linearity relationship be-tween high number of diseases and high BMI in both sexes, regardless of adjustment variables. he mean BMI values of women with one or more diseases and men with 3 or more diseases were higher than those adopted in Brazil by the Food and Nutrition Surveillance System27.
here are only few studies scientiic literature analyzing the relation-ship between multimorbidity and BMI. he only study found (Medline and Scielo) examined this association in 300,006 adults aged 30 or over11.
each BMI category. Regardless of cutof points used to classify overweight and obesity, there is an association between multimorbidity and excess body fat in the elderly.
It is noteworthy that although some studies have pointed to the con-tribution of overweight in chronic diseases6,9,10, in older adults this efect
seems attenuated8. he literature points to the obesity paradox, showing that
higher BMI has a protective efect on individuals with chronic diseases8,
including COPD25, hypertension and comorbidity conditions8.
Possible explanations involve physiological and behavioral factors. Overweight individuals can receive better medical treatment or respond better to therapeutic procedures depending on the type of chronic condi-tion29. Individuals with higher BMI values have higher lean mass and body
fat, as well as greater cardioprotective efect of leptin and adiponectin30,
which are insulin resistance-related hormones.
he present study has limitations that should be mentioned. he irst refers to the cross-sectional design, where subjects were analyzed at a given time and cannot establish a causal relationship. Second, the information was collected in a self-reported way and omissions may have occurred. However, the presence of chronic diseases was conirmed by the use of medicines and information from health workers. hird, it was not possible to investigate the severity of diseases and this may be a more important factor than their number. he use of a representative sample of the elderly population, the training of interviewers, the use of direct body weight and height measurement and the fact of being the irst Brazilian study to investigate the association between chronic diseases, multimorbididity and BMI in older adults are study strengths.
CONCLUSION
his research using BMI as a continuous variable allowed identifying as-sociation with hypertension and chronic pulmonary disease in women and men, respectively. hese associations were independent of age, education, living arrangement, smoking, alcohol consumption, waist circumference, cognitive state and all diseases and chronic health conditions. BMI also showed linear trend with number of diseases and chronic health condi-tions. he monitoring of the nutritional status of older adults is important to identify extreme BMI, especially in those with more than two diseases and chronic health conditions.
Given the diferences between men and women in the health conditions observed, it is important to identify speciic needs for each group. he im-plementation of targeted public policies to each group seems to be essential.
Acknowledgments
Education Personnel for the Master’s scholarship to Leal Neto JS and Meneghini V (Graduate Program in Physical Education - Sports Center - UFSC / Florianópolis).
REFERÊNCIAS
1. Schmidt MI, Duncan BB, Azevedo e Silva G, Menezes AM, Monteiro CA, Barreto SM. Chronic noncommunicable diseases in Brazil: burden and current challenges. Lancet 2011;377(9781):1949-61.
2. Organização Mundial da Saúde/OMS. Cuidados inovadores para condições crôni-cas: componentes estruturais de ação: relatório mundial: Brasília; 2003; Available from: http://whqlibdoc.who.int/hq/2002/WHO_NMC_CCH_02.01_por.pdf [2013 dez 16].
3. Barnett K, Mercer SW, Norbury M, Watt G, Wyke S, Guthrie B. Epidemiology of multimorbidity and implications for health care, research, and medical education: a cross-sectional study. Lancet 2012;380(9836):37-43.
4. Marengoni A, Angleman S, Melis R, Mangialasche F, Karp A, Garmen A, et al. Aging with multimorbidity: a systematic review of the literature. Ageing Res Rev 2011;10(4):430-9.
5. Instituto Brasileiro de Geograia e Estatística/IBGE. Pesquisa Nacional por Amostra de Domicílios – um panorama da Saúde no Brasil: acesso e utilização dos serviços, condições de saúde e fatores de risco e proteção à saúde (PNAD 2008): Rio de Janeiro. 2010; Available from: http://www.ibge.gov.br/home/estatistica/ populacao/panorama_saude_brasil_2003_2008/ [2013 dez 16].
6. Fares D, Barbosa AR, Borgatto AF, Coqueiro RS, Fernandes MH. Fatores as-sociados ao estado nutricional de idosos de duas regiões do Brasil. Rev Assoc Med Bras 2012; 58(4):434-41.
7. Prospective Studies Collaboration, Whitlock G, Lewington S, Sherliker P, Clarke R, Emberson J. et al. Body-mass index and cause-specific mortal-ity in 900 000 adults: collaborative analyses of 57 prospective studies. Lancet 2009;373(9669):1083-96.
8. Dixon JB, Egger GJ, Finkelstein EA, Kral JG, Lambert GW. ‘Obesity paradox’ misunderstands the biology of optimal weight throughout the life cycle. Int J Obes 2015; 39(1):82-4.
9. Munaretti DB, Barbosa AR, Marucci MFN, Lebrão ML. Hipertensão arterial referida e indicadores antropométricos de gordura em idosos. Rev Assoc Med Bras 2011;57(1):25-30.
10. Coqueiro RS, Santos GAF, Borges LJ, Sousa TF, Fernandes MH, Barbosa AR. Anthropometric indicators of obesity and hyperglycaemia in Brazilian older people. J Diabetes Nurs 2013;17(9):351-5.
11. Booth HP, Prevost AT, Gulliford MC. Impact of body mass index on prevalence of multimorbidity in primary care: cohort study. Fam Pract 2014;31(1):38-43.
12. Fonseca MJM, Andreozzi VL, Faerstein E, Chor D, Carvalho MS. Alternatives in modeling of body mass index as a continuous response variable and relevance of residual analysis. Cad Saúde Pública 2008;24(2):473-8.
13. Instituto Brasileiro de Geograia e Estatística/IBGE. Censo 2010 – Cidades. Rio de Janeiro. 2010; Available from: http://www.cidades.ibge.gov.br/xtras/home. php [2013 dez 16].
14. Santos JL, Lebrão ML, Duarte YA, Lima FD. Functional performance of the elderly in instrumental activities of daily living: an analysis in the municipality of São Paulo, Brazil. Cad Saúde Pública 2008;24(4):879-86.
15. Chumlea WC, Guo S, Roche AF, Steinbaugh ML. Prediction of body weight for the nonambulatory elderly from anthropometry. J Am Diet Assoc 1988;88(5):564-8.
CORRESPONDING AUTHOR
Aline Rodrigues Barbosa. Departamento de Educação Física, Centro de Desportos, Universidade Federal de Santa Catarina. Campus Reitor João David Ferreira Lima, Florianópolis - Santa Catarina – Brasil, CEP: 88040-900. E-mail: [email protected]
17. Callaway WC, Chumlea WC, Bouchard C, Himes JH, Lohman TG, Martin AD, et al., Circumferences. In: Lohman TG, Roche AF, Martorell R, editors. Anthropometric Standardization Reference Manual. Champaign: Human Kinet-ics; 1988. p. 39-54.
18. Bertolucci PHF, Mathias SC, Brucki SMD, Campacci SR, Juliano Y. Proposta de padronização do Mini-Exame do Estado Mental (MEM): estudo piloto cooperativo (FMUSP/EPM). Arq Neuropsiquiatr 1994;52(1):1-7.
19. Pinheiro RS, Viacava F, Travassos C, Brito AS. Gênero, morbidade, acesso e utilização de serviços de saúde no Brasil. Ciênc Saúde Coletiva 2002;7(4):687-707.
20. Lloyd-Sherlock P, Beard J, Minicuci N, Shah E, Chatterji.S. Hypertension among older adults in low- and middle-income countries: prevalence, awareness and control. Int J Epidemiol 2014;43(1):116-28.
21. Leal Neto JS, Coqueiro RS, Freitas RS, Fernandes MH, Oliveira DS, Barbosa AR. Anthropometric indicators of obesity as screening tools for high blood pressure in the elderly. Int J Nurs Pract 2013;19(4):360-7.
22. Jarvie JL, Foody JM. Recognizing and improving health care disparities in the pre-vention of cardiovascular disease in women. Curr Cardiol Rep 2010;12(6):488-96.
23. Davis SR, Castelo-Branco C, Chedraui P, Lumsden MA, Nappi RE, Shah D, et al. Understanding weight gain at menopause. Climacteric 2012;15(5):419-29.
24. Zhou Y, Wang D, Liu S, Lu J, Zheng J, Zhong N, et al. he association between BMI and COPD: the results of two population-based studies in Guangzhou, China. COPD 2013;10(5):567-72.
25. Cao C, Wang R, Wang J, Bunjhoo H, Xu Y, Xiong W. Body mass index and mortality in chronic obstructive pulmonary disease: a meta-analysis. PLoS One 2012;7(8):e43892.
26. Silva CS, Silva Junior CT, Silva PS, Cardoso RBB, Behrsin RF, Cardoso GP. Abordagem nutricional em pacientes com doença pulmonar obstrutiva crônica. Pulmão RJ 2010; 19(1-2):40-4.
27. Brasil. Ministério da Saúde. SISVAN. Protocolos do Sistema de Vigilância Alimen-tar e Nutricional - SISVAN na assistência à saúde: Brasília. 2008; Available from: http://189.28.128.100/nutricao/docs/geral/protocolo_sisvan.pdf [2014 nov 13].
28. World Health Organization. Global database on body mass index: an interactive surveillance tool for monitoring nutrition transition. World Health Organization: Geneva. 2012; Available from: http://apps.who.int/bmi/ [2015 nov 10].
29. Schenkeveld L, Magro M, Oemrawsingh RM, Lenzen M, de Jaegere P, van Geuns RJ, et al. he inluence of optimal medical treatment on the “obesity paradox,” body mass index and long-term mortality in patients treated with percutaneous coronary intervention: a prospective cohort study. BMJ Open 2012;9(2):e000535.