MIMICKING ABILITIES OF EXCHANGE-TRADED FUNDS
João Tiago Cabeçana
Project submitted as partial requirement for the conferral of
Master of Science in Finance
Supervisor:
Professor Sofia Brito Ramos, Assistant professor, ISCTE Business School, Finance
Department
Spine
-MI
MI
CK
ING
ABI
LI
T
IE
S
OF
EXCH
ANGE
-TRA
DED
FUNDS
J
o
ã
o
Ti
a
g
o
C
a
beç
a
n
a
I
Resumo
Este estudo analisa a capacidade dos Exchange-Traded Funds (ETFs) em replicar três dos mais
conhecidos índices accionistas: FTSE 100, DJ Eurostoxx 50 e S&P 500.
Os resultados mostram que os ETFs que replicam proporcionalmente os índices acima descritos
apresentam valores relativos ao alfa positivos, embora dificilmente estes sejam estatisticamente
significativos, enquanto os ETFs que replicam de forma alavancada e inversa os mesmos índices
accionistas apresentam alfas negativos, embora não estatisticamente significativos. Os ETFs que
replicam o S&P 500 fazem-no de forma mais precisa do que os ETFs que replicam o Eurostoxx
50 ou o FTSE 100. Os ETFs que replicam proporcionalmente o Eurostoxx 50 parecem
evidenciar maior dificuldade em replicar o índice de referência. Os betas apresentam uma
dispersão elevada, sobretudo para os ETFs que replicam o FTSE 100 e o Eurostoxx 50, o que
implica que os valores de Tracking Error sejam igualmente dispersos.
Os ETFs que replicam proporcionalmente o FTSE 100 tendem a negociar a prémio enquanto os
ETFs que replicam proporcionalmente o Eurostoxx 50 tendem a negociar a desconto. Os ETFs
que replicam de forma alavancada e inversa um índice tendem a negociar a prémio. Os Betas e
os Tracking Errors não são consistentes ao longo do tempo.
No final do estudo, é comparada a capacidade demonstrada pelos ETFs em replicar um
determinado índice com a capacidade demonstrada por Fundos de Investimento tradicionais em
replicar o mesmo índice. Conclui-se que, em geral, os ETFs tendem a replicar melhor um
determinado índice do que os Fundos de Investimento tradicionais.
Palavras-Chave: Exchange-Traded Funds, Capacidade de replicar índices, Tracking Error,
Fundos de Investimento
II
Abstract
This work analyses the mimicking abilities of Exchange-Traded Funds (ETFs) that track three
well- known stock market Indexes: the FTSE 100, DJ Eurostoxx 50 and the S&P 500.
The results show that equity index ETFs present positive alphas, although hardly s.s., while
leveraged and inverse ETFs present negative alphas although not statistically significant. ETFs
that track the S&P 500 index, do it more precisely than ETFs that track Eurostoxx 50 and FTSE
100 index. The equity index ETFs that track the Eurostoxx 50 seems to be the worst into track
their benchmark. Betas present a large dispersion mainly for FTSE 100 and Eurostoxx 50 ETFs’
which implies that tracking errors are also larger for these ETFs.
Equity index ETFs that track the performance of the FTSE 100 index tend to be traded at a
premium and equity index ETFs that track the performance of Eurostoxx 50 index at a discount.
Leveraged and inverse ETFs tend to be traded at a premium. Beta and tracking errors are not
consistent over time.
On the final of the paper I compare the tracking abilities of ETFs with indexed mutual funds. I
find that, on general, ETFs tend to track better the benchmark than Traditional mutual funds.
III
Acknowledgment
I express my acknowledgment to everyone that helps me in the elaboration of this master thesis.
To professor and supervisor Sofia Brito Ramos for the support that gave me during the design of
this study.
To my fathers and my girlfriend for the patience and comprehension demonstrated during the last
couple of months, I express, sincerely, my grateful.
To João Lampreia, head of Research department at Banco de Investimento Global (Banco BiG),
bank where I am currently working for, for the support and flexibility that he always demonstrate
since my first day in his department, which was essential to the design of this master thesis.
IV
Index of Figures
Figure I - Evolution of ETFs’ AUM between 1993 and the 3Q10, grouped by classes ... XI
Figure II - Evolution of AUM and number of ETFs since 1993 until 3Q10 ... XII
Figure III - Evolution of the alpha of equity index ETFs that track the FTSE 100 ... XXVIII
Figure IV - Evolution of the alpha of equity index ETFs that track the Eurostoxx 50 ... XXVIII
Figure V - Evolution of the alpha of equity index ETFs that track the S&P 500 ...XXIX
Figure VI - Evolution of the beta of equity index ETFs that track the FTSE 100 ...XXIX
Figure VII - Evolution of the beta of equity index ETFs that track the Eurostoxx 50 ... XXX
Figure VIII - Evolution of the beta of equity index ETFs that track the S&P 500 ... XXX
Figure IX - Evolution of the TE of equity index ETFs that track the FTSE 100 ...XXXI
Figure X - Evolution of the TE of equity index ETFs that track the Eurostoxx 50 ...XXXI
Figure XI - Evolution of the TE of equity index ETFs that track the S&P 500 ... XXXII
Figure XII - Distribution of Alpha and Beta values for Mutual Funds that have the Eurostoxx 50
as the benchmark ... XXXIV
Figure XIII - Distribution of Alpha and Beta values for Mutual Funds that have the FTSE 100
as the benchmark ... XXXV
Figure XIV - Distribution of Alpha and Beta values for Mutual Funds that have the S&P 500 as
the benchmark ... XXXVI
Figure XV - Distribution of tracking errors for Mutual Funds that have the Eurostoxx 50 as the
benchmark ... XXXVI
Figure XVI - Distribution of tracking errors for Mutual Funds that have the FTSE 100 as the
benchmark
... XXXVII
Figure XVII - Distribution of tracking errors for Mutual Funds that have the S&P 500 as the
V
Index of Tables
Table I - Data Description of equity index ETFs ... XVII
Table II - Data Description of leveraged and inverse ETFs ... XVIII
Table III - Tracking ability of equity index ETFs ... XX
Table IV - Tracking ability of leveraged and inverse ETFs ... XXI
Table V - Tracking ability of leveraged and inverse ETFs (cont.) ... XXI
Table VI - Tracking Errors and Semi-Tracking Errors of equity index ETFs ... XXIII
Table VII - Tracking Errors and Semi-Tracking Errors of leveraged and inverse ETFs ...XXIV
Table VIII - Premium/Discount analysis on equity index ETFs ...XXVI
Table IX - Premium/Discount analysis on leveraged and inverse ETFs ... XXVII
VI
Index of Annex
Annex I - Summary Statistics of equity index ETFs ...XLII
Annex II - Summary Statistics of equity index ETFs (based on NAV) ... XLIV
Annex III - Summary Statistics of leveraged and inverse ETFs ... XLV
Annex IV - Summary Statistics of Mutual Funds that track the Eurostoxx 50 ... XLVI
Annex V - Summary Statistics of Mutual Funds that track the FTSE 100 ... XLVIII
Annex VI - Summary Statistics of Mutual Funds that track the S&P 500 ... XLIV
Annex VII - Data Description of Mutual Funds that track the Eurostoxx 50 ... LIII
Annex VIII - Data Description of Mutual Funds that track the FTSE 100 ... LV
Annex IX - Data Description of Mutual Funds that track the S&P 500 ... LVI
Annex X - Tracking ability of Mutual Funds that track the Eurostoxx 50 ... LX
Annex XI - Tracking ability of Mutual Funds that track the FTSE 100 ...LXII
Annex XII - Tracking ability of Mutual Funds that track the S&P 500 ... LXIII
Annex XIII - Tracking Errors of Mutual Funds that the Eurostoxx 50 ... LXVIII
Annex XIV - Tracking Errors of Mutual Funds that the FTSE 100 ... LXIX
Annex XV - Tracking Errors of Mutual Funds that the S&P 500 ... LXX
VII
Index
I.
Introduction ... X
II. Literature Review ... XIII
III. Data ... XV
IV. Empirical Results ... XIX
(i)
Tracking Abilities ... XIX
(ii)
Tracking Errors ... XXII
(iii)
Premium/discount analysis ... XXV
(iv)
Time Consistency of Tracking abilities ... XXVII
(v)
Main conclusions ... XXXII
(vi)
Comparison with Mutual Funds ... XXXIII
VIII
Sumário Executivo
Desde o seu aparecimento, os Exchange-Traded Funds cativaram não só os investidores, pela
forma como criaram um novo veículo de investimento que possibilita, de forma simples,
diversificar um portefólio, mas também a classe académica, que cedo começou a explorar esta
nova forma de investimento, suas características, vantagens e eficiência. No primeiro ponto deste
estudo, procurou-se descrever a evolução que este produto financeiro tem experimentado ao
longo dos últimos anos.
No segundo ponto, e no seguimento do interesse gerado em torno dos Exchange-Traded Funds,
habitualmente designados ETFs, este estudo pretendeu investigar a capacidade evidenciada pelos
ETFs em replicar três dos mais conhecidos índices accionistas: FTSE 100, Eurostoxx 50 e S&P
500. No estudo foram incluidos não só ETFs que replicam na mesma proporção o seu benchmark
mas também os que replicam de forma alavancada e inversa a performance de um índice. Assim,
procurou-se avaliar a magnitude do alfa e do beta para cada um dos ETFs em análise, através de
uma regressão linear onde a variável depende é o ETF em estudo e a variável explicativa é o seu
benchmark. De seguida, estudou-se igualmente o desvio médio do retorno de cada ETF
relativamente ao retorno do seu benchmark, através do cálculo do Tracking Error. Seguindo os
estudos anteriormente realizados por Ackert e Tian (2000), Elton et al (2002) e Lin e Chou
(2006), procurou-se adicionalmente analisar se os ETFs negoceiam a prémio ou a desconto
relativamente ao seu Net Asset Value (NAV). Por fim, estudou-se a consistência dos alfas, betas
e Tracking Error ao longo do tempo.
O último ponto do estudo centrou-se numa abordagem comparativa, onde se procurou relacionar
a capacidade dos ETFs em replicar o seu benchmark com a capacidade dos Fundos de
Investimento tradicionais em replicar o mesmo benchmark, sendo que para tal foram igualmente
aplicados os processos relativos às regressões lineares e Tracking Error.
Os resultados mostraram que os ETFs que replicam proporcionalmente os índices anteriormente
descritos apresentam valores relativos ao alfa positivos, embora tendencialmente não sejam
estatisticamente significativos, enquanto os ETFs que replicam de forma alavancada e inversa os
mesmos índices accionistas apresentam alfas negativos, igualmente não estatisticamente
IX
significativos. Adicionalmente, foi possível observar que os ETFs que replicam o índice S&P
500, fazem-no, geralmente, de forma mais precisa do que os ETFs que replicam o índice
Eurostoxx 50 ou o FTSE 100. Os ETFs que replicam proporcionalmente o Eurostoxx 50 parecem
evidenciar maior dificuldade em replicar o índice de referência. Os betas apresentam uma
dispersão elevada, sobretudo para os ETFs que replicam o índice FTSE 100 e o índice Eurostoxx
50, o que implica que os valores de Tracking Error sejam igualmente dispersos.
Os Betas e os Tracking Errors não se apresentam consistentes ao longo do tempo, demonstrando
mesmo, em alguns casos, desvios consideráveis. Os ETFs que replicam proporcionalmente o
índice FTSE 100 tendem a negociar a prémio enquanto os ETFs que replicam proporcionalmente
o índice Eurostoxx 50 tendem a negociar a desconto. Os ETFs que replicam de forma alavancada
e inversa um índice tendem a negociar a prémio.
Relativamente ao último ponto, concluiu-se que, em geral, os ETFs tendem a replicar melhor um
determinado índice do que os Fundos de Investimento tradicionais.
X
I.
Introduction
Holding the market portfolio is one of milestones of the modern finance theory. The attempts to
trade large portfolios in a single transaction started in late 1970s and early 1980s with a program
trading that was able to trade often a portfolio with 500 stocks like the S&P 500 index, with a
single order placed at a major brokerage firm. The Exchange-Traded Funds’ (ETFs) history starts
in 1989 with Index Participation Shares (IPS), a proxy for the S&P 500 traded on the American
Stock Exchange (AMEX) and Philadelphia Stock Exchange (FSE). More similar to futures
contracts than the current form ETFs, the new financial instrument draw the attention of market
participants. It was settled on cash and tracked the benchmark index very closely. The increasing
popularity of the new financial vehicle threatened futures trading, pressing the U.S. Securities
and Exchange Commission (SEC), which approved the product before, to force the AMEX and
the FSE to stop the sales of the product in the US Market.
1
A few months later, a similar product, the Toronto Index Participation Shares (TIPS), was
launched on the Toronto Stock Exchange (TSE). The TIPS were a warehouse receipt-based
instrument designed to track the TSE 35 and TSE 100. TIPS traded actively and attracted a
substantial cash-flow from Canadian and international investors. The success of those financial
products, led the AMEX to try again, and develop a product that could satisfy SEC regulation in
the US market.
In 1992, the AMEX request the first authorized stand-alone index based Exchange-Traded Fund
(ETF). That petition was approved and in January 1993 appeared the S&P Depository Receipts
Trust Series 1, known as SPDR. SPDR tracks the performance of the S&P 500 index and became
the first commercial successful ETF. Later on, other ETFs have been launched to track other
well-known US indexes such as the Nasdaq and Dow Jones Industrial Average.
1
Wiandt, J., and McClachy, W., 2002, Exchange Traded Funds: An Insider's Guide to Buying the Market. Index
Funds.
XI
After the success of ETFs in the US market, the 2000’s are marked by the introduction of ETFs
in Europe and Asia (iShares launched, on April 2000, the first ETF to track the performance of
the Eurostoxx 50).
2
The industry of ETFs has experimented a significant growth, the data from the 3Q10 shows that
there are 2379 ETFs, representing USD 1181.3 bn, from 129 providers on 45 exchanges around
the world. The growing importance of ETFs is expressed by the numbers of the first 9 months of
2010, where the Assets Under Management (AUM) increased by 14%, the number of ETFs by
22.3% and the ETF’s average trading volumes by 14.7%. Besides the innovations introduced by
ETF’s industry, this new financial product started to capture market share to the traditional
mutual funds, which in the first 7 months of 2010 registered a decrease on net sales value by
USD 221 bn, while net sales of ETFs increased by USD 81,6 bn.
3
Figure I
Evolution of ETFs’ AUM between 1993 and the 3Q10, grouped by classes
Source: BlackRock
2
Barclays, Stockbrokers
3ETF Landscape, Industry Highlights, End 3Q 2010, BlackRock
$-$200,00 $400,00 $600,00 $800,00 $1.000,00 $1.200,00
ETFs Growth (by type)
XII
Figure II
Evolution of AUM and number of ETFs since 1993 until 3Q10
Source: BlackRock
On figures I and II, we can observe the exponential growth of ETF, in terms of both number and
AUM. We can also see the growth of other classes of ETFs like Fixed Income and Commodity
ETFs.
The most significant innovation that ETFs brought to us was the possibility of an investor to
have access to a pool of securities with only a single vehicle, identical to traditional mutual
funds, with the advantage of trading like shares that can be bought and sold throughout the
trading session on a securities exchange through a broker-dealer. If in early days ETFs were
traded mostly by institutional investors for use in sophisticated trading strategies like hedging,
today the demand for ETFs by non-institutional investors is quite significant, which was helped
by the growing ability of individuals to access financial information or advise, that gave them the
ability to invest in products about which they might not have been previously aware.
This work will evaluate the mimicking abilities of ETFs, i.e., the capacity of a specific ETF into
track the performance of its benchmark. The focus on equity index ETFs was motivated by the
history of ETFs, where ETFs were created with the goal of coping a certain market index.
Nowadays there is a wide range of styles (besides market index ETFs we have Commodity,
Fixed-Income and Currency ETFs) but equity index ETFs also present advantages like longer
history and more liquidity.
0 500 1000 1500 2000 2500 $-$200,00 $400,00 $600,00 $800,00 $1.000,00 $1.200,00 $1.400,00
ETFs Growth
XIII
Differently from previous works, I study also leveraged and inverse ETFs besides equity index
ETFs, due to the significant importance that this specific financial product has assumed over the
last years.
On a second part, I cross the previous results with the liquidity of the last 6 month of trading, the
values of the fees and the tracking error result for each ETF. This additional analysis try to
understand if exist a relation among those parameters and the tracking capacity of the ETFs.
The last objective will be compare the result of the ETFs analysis’ with traditional mutual funds,
too see if a much recent investment vehicle like ETFs is so efficient as the traditional mutual
funds into track the benchmark’s performance.
II.
Literature Review
The first academic studies on ETFs appeared in the end of the 90’s motivated by the high degree
of acceptance of the product among investors. The researchers began studying not only the ETF
as a specific investment vehicle but also began comparing them with traditional mutual funds.
Gastineau (2001) discusses some of the advantages and innovations brought by ETFs, the low
expense ratios of ETFs and how ETFs manage to avoid significant capital gains contributions.
Dellva (2001) describes how the redemption processes provide the ETFs with significant tax
efficiencies and finds that tax deferred, long-term retirement investors have little or no advantage
from using ETFs as opposed to traditional mutual funds. Fuhr (2001) points out that ETFs’
characteristics make them a viable alternative to trading futures for investors looking to increase
or reduce their exposure to countries, sectors, industries, and styles. ETFs allow investors the
flexibility to use them for numerous applications, which can be appealing to both individual and
institutional investors.
Dellva (2001) applies a cost comparison among the primary trackers of S&P 500 Index, SPDRs
and Barclays’ iShares S&P from the bundle of ETFs and the Vanguard index mutual fund. The
results shows that transaction costs limit ETF attractiveness for small investors. The in-kind
creation and redemption process of ETFs provide significant tax efficiencies. Finally, the study
XIV
finds little or no ETF advantage for the tax deferred, long-term retirement investor. Poterba and
Shoven (2002) compare the pre-tax and after-tax returns on the largest ETF, the SPDR trust and
Vanguard Index 500, which both track the S&P 500 Index, concluding that these funds
substantially present the same performance, and in a more precise view, the after-tax and the
pre-tax returns on the fund were slightly greater than those on the ETF. Gastineau (2004) suggests
that the pre-tax performance of benchmark index ETFs is usually lagging than the index mutual
funds which use the same indexes. He justifies that low return with the lack of aggressiveness for
a portion of ETFs managers and with the process of ETFs creation and redemption that restricts
managers’ ability to follow accurately, immediately and inexpensively the adjustments of the
tracking indexes. Also Miffre (2004) list some advantages of ETFs over the traditional mutual
funds. More recently, Svetina and Wahal (2008) found that the majority of ETFs that track
indexes do not have a corresponding index mutual fund and when they have a real competitor
mutual fund they usually deliver a slightly better performance.
The performance of ETFs and how well they track the benchmark was also an issue of interest
among the academic research. Frino and Gallagher (2001) pointed the inevitability of tracking
error in index fund performance due to market frictions. The authors highlight the difficulties
faced by index funds and showed that S&P 500 index funds, on average, outperformed active
funds after expenses over the sample period. Elton et al (2002), document that the SPDR
underperforms both its underlying index and conventional S&P 500 index funds. Rompotis
(2005) examines the performance of 16 ETFs and index funds in pairs tracking the same index,
and reports that they substantially produce similar returns and tracking errors. Gallaghar and
Segara (2005) investigate the ability of the Index ETF into track the performance of the
Australian Stock Exchange, showing that ETFs track efficiently the underlying benchmark
before costs, have lower tracking errors than index managed funds and difference between
trading price and NAV is small and not occur with frequency. Milonas and Rompotis (2006)
examine the performance and the trading characteristics of a sample of 36 Swiss ETFs. They find
that Swiss ETFs underperform their benchmark indexes while having investors exposed to
greater risk.
XV
Another issue investigated is whether ETFs are traded at premium or discount, i.e., ETFs trading
price relative to their NAV. Ackert and Tian (2008) examined pricing in the market for SPDR’s,
showing that they do not trade at economically significant discounts, unlike closed-end mutual
funds. The same conclusion is not also applicable to MidCap SPDRs that report a larger
economically significant discount. Delcoure and Zhong (2007) concluded that iShares ETFs
trade at economically significant premiums even controlling the transaction costs and time-zone
measurement errors. However, they showed after that the deviations of most iShares’ price and
NAV are not persistent and tend to zero within two days. Also Jares and Lavin (2004), show that
the non overlapping of ETFs that trade on US exchanges but provide exposure to foreign
markets, in this case iShares ETFs that are exposed to Japan and Honk-Kong markets, increase
the existence of discrepancy among price and NAV. Elton et al (2002) studied the deviation of
trading price from NAV, proving that this difference is negligible due to the ability of investors
to create or delete Spiders at the end of every trading day.
III.
Data
This paper focuses on equity index ETFs that track three major stock market indexes: S&P500,
EUROSTOXX 50 and FTSE 100. From Datastream, I identified several ETFs that track those
indexes. I chose both equity index ETFs as well as leveraged and inverse ETFs, where the latter
also mimic an equity index but have a multiplier like -1 or 2.
To avoid currency issues, I chose ETFs that are quoted on the same currency as the benchmark.
The Bloomberg’s ticker of the ETF identifies the ETF and the exchange where it is traded. This
means that the same ETF can be traded in different exchanges. Therefore, I eliminated ETFs that
are repeated, i.e., that are quoted on different markets (stock exchanges) by choosing the same
market as the benchmark index, with the exception of ETFs that track the Eurostoxx 50, which
are a special case. Thus, ETFs that track FTSE 100 index have LN on Bloomberg’s ticker, that
correspond to a product that trade on London Stock Exchange and the ETFs that track S&P 500
have always US designation, which represent ETFs that are traded on the US market. For ETFs
XVI
capitalization from different European indexes, we have ETFs that are traded on different stock
exchanges like FP and NA, which means that the ETF is traded on Euronext Paris and on
Euronext Amsterdam, GY which means that the ETF is traded on Deutsche Börse (Xetra) and
SM which means that the ETF is traded on Madrid Stock Exchange.
From Lipper, I selected index mutual funds whose benchmark was also the selected stock market
indexes: S&P500, EUROSTOXX 50 and FTSE 100.
Daily prices and net asset values of the ETFs and mutual funds were taken from Bloomberg as
well as additional information such as currency, inception date and fees.
One problem that I faced on the construction of the database was the different lifetime of ETFs
(some are very recent), which led to a different number of observation among the ETFs.
The final sample has 20 indexing ETFs and 16 Leveraged ETFs. More specifically, the final
database includes 5 equity index ETFs and 3 leveraged and inverse that track the performance of
FTSE 100, 13 equity index ETFs and 6 leveraged and inverse ETFs that track the performance of
Eurostoxx 50 and 2 equity index ETFs and 7 leveraged and inverse ETFs that track the
performance of S&P 500.
4
Notice that the sample size in other studies has varied from one fund
to twenty. For instance, Poterba and Shoven (2002) and Elton et al (2002) focus on one ETF
(SPDR) while Jares and Lavin (2004) examine two funds (iShares Japan and Hong Kong funds)
or even Delcoure and Zhong (2007) study 20 international ETFs traded on US exchanges.
By company, we can find the biggest ETFs’ providers as BlackRock through the iShares, State
Street Global Advisors through SPDR, Deutsche Bank through db x-trackers and Lyxor Asset
Management through Lyxor ETFs.
XVII
Table I
Data Description of equity index ETFs
Name Issuer Ticker
Bloomberg Benchmark Currency
Inception date Obs. Expense Ratio Average Vol. 6MTH Current Market Cap.
HSBC FTSE 100 ETF HSBC ETFs HUKX LN FTSE 100 GBp 25-08-2009 342 n.a. 37749,4 138095400 ISHARES FTSE 100 iShares ISF LN FTSE 100 GBp 27-04-2000 2699 n.a. 6462963,0 3595096000 MULTI UNITS LUXEMBOURG LYXOR
ETF FTSE 100 Multiunits LYUK LN FTSE 100 GBp 06-11-2009 289 n.a. 4253,6 16693870 SOURCE MARKETS (LON) FTSE 100
SOURCE SourceMarkets S100 LN FTSE 100 GBp 07-09-2009 260 n.a. 43739,7 54072370 LYXOR ETF FTSE 100 Lyxor AM L100 LN FTSE 100 GBp 15-05-2007 920 0,3 542513,6 358142500 HSBC.EURO STOXX 50 HSBC ETFs 50E FP Eurostoxx 50 EUR n.a. 275 n.a. 30407,3 72112300 BBVA DJ STOXX EURO 50 BBVA BBVAE SM Eurostoxx 50 EUR 30-10-2006 1081 0,15 38202,9 179039900 CS ETF EURO STOXX 50 db x-trackers SXRT GY Eurostoxx 50 EUR 10-03-2010 210 0,2 98774,2 127131000 UBS ETF DJ EURO STOXX 50 UBS E50EUA GY Eurostoxx 50 EUR 19-03-2002 2290 0,36 8953,2 359303400 ISHARES DJ (FRA) EUROSTOXX 50 iShares EUN2 GY Eurostoxx 50 EUR 03-04-2000 2793 0,15 454334,3 2767590000 AMUNDI ETF DJ.ESX.50 Amundi IS C50 FP Eurostoxx 50 EUR 23-09-2008 576 n.a. 76503,1 663993000 LYXOR DJ EUROSTOXX (FRA) 50 Lyxor AM LYSX GY Eurostoxx 50 EUR 29-11-2002 2107 n.a. 61735,7 5192584000 DBX ESTX50 1C db x-trackers XSC FP Eurostoxx 50 EUR 27-05-2009 413 0,15 27151,4 719769700 ISHARES DJEURSTOX50 iShares GXE FP Eurostoxx 50 EUR 26-09-2001 2604 n.a. 50959,4 3541516000 ISHARES EURO STX50 iShares EUEA NA Eurostoxx 50 EUR 03-04-2000 2596 0,35 153438,8 2770005000 ISHARES DJ ES50 A iShares IEUA NA Eurostoxx 50 EUR 23-03-2010 202 0,35 10638,7 128975000 LYXOR ETF ES 50 Lyxor AM MSE FP Eurostoxx 50 EUR 21-03-2001 2549 n.a. 1484808,0 5197098000 UBSETF BB E STOXX50 UBS FRE FP Eurostoxx 50 EUR 29-01-2003 2064 0,16 0,2 378010700 SPDR S&P 500 ETF TST. SPDR ETFs SPY US S&P 500 USD 22-01-1993 4515 0,0945 170809904,0 89772330000 ISHARES S&P 500 iShares IVV US S&P 500 USD 19-05-2000 2670 0,09 3007015,0 26728270000
On table I, on the first column we have the name of the equity index ETFs, on the second the
issuer and on the third column the Bloomberg’s Ticker. The fourth column represents the
benchmark. We see that the final sample has 5 equity index ETFs that track the FTSE 100, 13
that track the Eurostoxx 50 and 2 that track the S&P 500. On column five we can confirm that all
equity index ETFs traded in the same currency as the benchmark. Regarding the inception date
we can see that equity index ETFs that track S&P 500 have the oldest inception date, which it is
not a surprise considering the history of the ETFs. The next column presents the number of
observations that, as we can see, varies considerably among the equity index ETFs. Despite the
efforts, it was not possible to collect expenses ratios for all ETFs due to the lack of information
regarding fees. It is also presented the average trading volume in the last 6 months and the
current capitalization of the equity index ETFs. These two last features confirm that SPDR, also
known as the Spyder, is the largest ETF in the world. An interesting point is the more
XVIII
discrepancy observed among the average volume of the last 6 month that occurs on equity index
ETFs with less competitors, equity index ETFs that track S&P 500 and FTSE 100, which is
justified by the concentration of the demand for ETFs.
Table II
Data Description of leveraged and inverse ETFs
Name Issuer Style Ticker
Bloomberg Benchmark Currency
Inception date Obs. Expense Ratio Average Vol.6MTH Current Market Cap.
ETFX FTSE 100 SUP SHRT ST 2X ETFx Indexes 2x short SUK2 LN FTSE 100 GBp 15-06-2009 388 n.a. 39191,5 45342410 DB X-TRACKERS FTSE 100 SH
DA
db
x-trackers short XUKS LN FTSE 100 GBp 17-06-2008 643 0,5 162110,2 70269020 ETFX FTSE 100 LEVERAGED 2X ETFx Indexes 2x long LUK2 LN FTSE 100 GBp 15-06-2009 388 n.a. 11648,8 15232420 AMUNDI ETF LEV E50 Amundi IS 2x long C5L FP Eurostoxx 50 EUR 29-06-2009 388 n.a. 1578,4 13148690 EASYETF EU ST 50 DB SH-CAP Easy ETF -
BNP Paribas 2x short EZD FP Eurostoxx 50 EUR 25-02-2009 473 n.a. 10650,9 18009670 ETFX DJ EURO STOXX 50 LEV
2X ETFx Indexes 2x long LEU2 GY Eurostoxx 50 EUR 18-08-2009 351 0,4 9155,7 14603090 ETFX DJ EURO ST 50 DBL SH 2X ETFx Indexes 2x short SEU2 GY Eurostoxx 50 EUR 18-08-2009 351 0,6 17533,3 21822270 DB X-TRACKERS EU STXX 50
SHR
db
x-trackers short XSSX GY Eurostoxx 50 EUR 15-06-2007 908 0,4 322487,1 362324400 LYXOR ETF XBEAR STXX 50 Lyxor AM 2x short BXX FP Eurostoxx 50 EUR 04-04-2007 956 n.a. 132419,3 124708500
RYDEX 2X S&P 500 ETF RydexShares
ETFs 2x long RSU US S&P 500 USD 07-11-2007 792 0,71 62056,0 84822750 RYDEX INVERSE 2X S&P 500
ETF
RydexShares
ETFs 2x short RSW US S&P 500 USD 07-11-2007 792 0,71 71688,7 57136000 PROSHARES ULTRASHORT
S&P500 ProShares 2x short SDS US S&P 500 USD 13-07-2006 1125 0,91 28260000,0 2341238000 PROSHARES SHORT S&P500 ProShares short SH US S&P 500 USD 21-06-2006 1140 0,95 2444338,3 1721099000 PROSH ULTRAPRO SHORT S&P
500 ProShares 3x short SPXU US S&P 500 USD 25-06-2009 383 0,95 5837329,0 314265000 PROSHARES ULTRA S&P500 ProShares 2x long SSO US S&P 500 USD 21-06-2006 1140 0,95 13457015,0 1733209000 PROSHARES ULTRAPRO S&P
500 ProShares 3x long UPRO US S&P 500 USD 25-06-2009 383 0,95 2530194,0 251192000
Table II shows the sample characteristics of leveraged and inverse ETFs, starting by the name
and the issuer. The style is described on column (3). Basically, some funds track the index in the
same direction (long) others in the opposite (short), where the level of leverage is given by the
multiplier. The range of multipliers goes from 1 to 3. Three ETFs track the FTSE 100, six the
Eurostoxx 50 and seven the S&P 500. We have more leveraged and inverse ETFs that track the
S&P 500 that equity index ETFs that track the same index, which is justified by the more
competitiveness among the providers on leveraged and inverse ETFs, which is not seen on equity
index ETFs due to the position that SPDR assumes in the market. Leveraged and inverse ETFs
were launched more recently, the oldest is from July 2006, which led to a smaller number of
observations when comparing with equity index ETFs. Fees are larger for leveraged and inverse
ETFs, which is reasonable considering the complexity of tracking leveraged and inversely the
XIX
performance of an index. Finally, I highlight that the leveraged and inverse ETFs that track the
performance of the S&P 500 index have, in average, a much significant volume than the other
leveraged and inverse ETFs due to the larger demand for S&P 500 related products.
IV.
Empirical Results
(i) Tracking Abilities
In this section, I start by evaluate the capacity of the ETFs into track the performance of the
benchmark index. For that, I first compute the daily returns of the ETFs by applying the
following equation (I):
(I)
Where, R
t
refers to the percentage return of ETF on day t, Price
t
refers to the trading price of
ETF on day t and Price
t-1
refers to the trading price of ETF on day t-1.
Then, I use the following regression (Equation II):
(II)
Where
, is the daily return of ETF i on day t and
refers to the percentage return
of Benchmark on day t. The alpha, α, is the constant of the model and Beta, β, represents the
capacity of the ETF into track the performance of the benchmark as they propose itself to do.
I start by analyze the equity index ETFs. Our expectation is that, since they copy the benchmark,
and
=0, as well as the R
2
be high. Therefore, these two hypotheses will be tested.
On Table III, we can see the results of the time-series regression for each equity index ETF. The
alpha assumes a small positive value for commonplace equity index ETFs and it is only
statistically significant with 95% confidence level for one ETF. Regarding the beta, it tends to be
close to 1 in the majority of the cases, however, on CS ETF EURO STOXX 50 and UBSETF BB
E STOXX 50 the beta is abnormally low. The R
2
shows that almost all equity index ETFs in this
XX
only HSBC FTSE 100 ETF on FTSE 100 benchmark index and SPDR S&P 500 ETF TST on
S&P 500 benchmark index do not reject the null hypothesis, showing that the beta of those ETFs
are equal to one. However, three ETFs reject the null hypothesis on Eurostoxx 50 benchmark
index, HSBC EURO STOXX 50, ISHARES DJ (FRA) EUROSTOXX 50 and ISHARES DJ
ES50.
Table III
Tracking ability of equity index ETFs
Name Ticker
Bloomberg Benchmark Currency
Inception date Obs.
Alpha
*100 p-value Beta p-value R
2 Teste F
Beta=1 p-value
HSBC FTSE 100 ETF HUKX LN FTSE 100 GBp 25-08-2009 342 0,012 0,007 1,003 0,000 0,995 0,34 0,540 ISHARES FTSE 100 ISF LN FTSE 100 GBp 27-04-2000 2699 0,013 0,314 0,914 0,000 0,768 10,31 0,001 MULTI UNITS LUXEMBOURG LYXOR ETF FTSE 100 LYUK LN FTSE 100 GBp 06-11-2009 289 0,022 0,429 0,853 0,000 0,810 8,61 0,004 SOURCE MARKETS (LON) FTSE 100 SOURCE S100 LN FTSE 100 GBp 07-09-2009 260 0,020 0,332 0,907 0,000 0,900 5,42 0,021 LYXOR ETF FTSE 100 L100 LN FTSE 100 GBp 15-05-2007 920 0,015 0,567 0,917 0,000 0,796 11,23 0,001
HSBC.EURO STOXX 50 50E FP Eurostoxx 50 EUR n.a. 275 0,014 0,202 0,9962 0,000 0,986 0,20 0,659 BBVA DJ STOXX EURO
50 BBVAE SM Eurostoxx 50 EUR 30-10-2006 1081 0,01 0,550 0,9652 0,000 0,907 10,13 0,002 CS ETF EURO STOXX
50 SXRT GY Eurostoxx 50 EUR 10-03-2010 210 0,011 0,892 0,4581 0,000 0,272 22,41 0,000 UBS ETF DJ EURO
STOXX 50 E50EUA GY Eurostoxx 50 EUR 19-03-2002 2290 0,01 0,609 0,7989 0,000 0,633 64,11 0,000 ISHARES DJ (FRA)
EUROSTOXX 50 EUN2 GY Eurostoxx 50 EUR 03-04-2000 2793 0,01 0,309 0,9855 0,000 0,908 2,39 0,123 AMUNDI ETF
DJ.ESX.50 C50 FP Eurostoxx 50 EUR 23-09-2008 576 0,029 0,615 0,7360 0,000 0,496 13,58 0,000 LYXOR DJ
EUROSTOXX (FRA) 50 LYSX GY Eurostoxx 50 EUR 29-11-2002 2107 0,014 0,419 0,8742 0,000 0,735 45,36 0,000 DBX ESTX50 1C XSC FP Eurostoxx 50 EUR 27-05-2009 413 0,013 0,509 0,9529 0,000 0,924 4,35 0,038 ISHARES
DJEURSTOX50 GXE FP Eurostoxx 50 EUR 26-09-2001 2604 0,004 0,798 0,8577 0,000 0,705 65,26 0,000 ISHARES EURO STX50 EUEA NA Eurostoxx 50 EUR 03-04-2000 2596 0,009 0,466 0,9261 0,000 0,859 40,25 0,000 ISHARES DJ ES50 A IEUA NA Eurostoxx 50 EUR 23-03-2010 202 0,014 0,155 1,0170 0,000 0,993 3,00 0,085 LYXOR ETF ES 50 MSE FP Eurostoxx 50 EUR 21-03-2001 2549 0,011 0,100 0,9748 0,000 0,958 8,55 0,004 UBSETF BB E
STOXX50 FRE FP Eurostoxx 50 EUR 29-01-2003 2064 0,023 0,423 0,3438 0,000 0,132 391,67 0,000 SPDR S&P 500 ETF
TST. SPY US S&P 500 USD 22-01-1993 4515 0,008 0,067 0,99916 0,000 0,951 0,01 0,909 ISHARES S&P 500 IVV US S&P 500 USD 19-05-2000 2670 0,007 0,097 0,97202 0,000 0,975 28,01 0,000
On table IV, we can see the results of the time-series regression for each leveraged and inverse
equity index ETF.
Contrary to equity index ETFs, the alpha tends to be negative although not statistically
significant. The betas tend to be close to the goal they proposal. However, we can see, by
XXI
analysing the result of the F-Test, that leveraged and inverse ETFs that track the S&P 500, track
worse its benchmark than leveraged and inverse ETFs that track others benchmarks. The F-Test,
on table V, shows that any leveraged and inverse ETF that track the S&P 500 index reject the
null hypothesis, contrary to equity index ETFs. Finally, the R
2
shows that almost all ETFs,
excluding DB X-TRACKERS FTSE 100 SH DA, are fully invested on the benchmark index
constituents, according to the specific strategy of each leveraged and inverse ETF.
Table IV
Tracking ability of leveraged and inverse ETFs
Name Style Ticker
Bloomberg Benchmark Currency
Inception date Obs.
Alpha
*100 p-value Beta p-value R
2
ETFX FTSE 100 SUP SHRT ST 2X 2x short SUK2 LN FTSE 100 GBp 15-06-2009 388 -0,058 0,227 -1,936 0,000 0,826 DB X-TRACKERS FTSE 100 SH DA short XUKS LN FTSE 100 GBp 17-06-2008 643 -0,010 0,841 -0,827 0,000 0,581 ETFX FTSE 100 LEVERAGED 2X 2x long LUK2 LN FTSE 100 GBp 15-06-2009 388 0,027 0,334 2,046 0,000 0,940
AMUNDI ETF LEV E50 2x long C5L FP Eurostoxx 50 EUR 29-06-2009 388 0,021 0,389 2,040 0,000 0,981 EASYETF EU ST 50 DB SH-CAP 2x short EZD FP Eurostoxx 50 EUR 25-02-2009 473 -0,054 0,470 -1,745 0,000 0,757 ETFX DJ EURO STOXX 50 LEV 2X 2x long LEU2 GY Eurostoxx 50 EUR 18-08-2009 351 0,022 0,804 1,724 0,000 0,770 ETFX DJ EURO ST 50 DBL SH 2X 2x short SEU2 GY Eurostoxx 50 EUR 18-08-2009 351 -0,049 0,525 -1,886 0,000 0,815 DB X-TRACKERS EU STXX 50 SHR short XSSX GY Eurostoxx 50 EUR 15-06-2007 908 -0,002 0,907 -0,989 0,000 0,959 LYXOR ETF XBEAR STXX 50 2x short BXX FP Eurostoxx 50 EUR 04-04-2007 956 -0,021 0,361 -1,866 0,000 0,958
RYDEX 2X S&P 500 ETF 2x long RSU US S&P 500 USD 07-11-2007 792 0,002 0,946 1,885 0,000 0,963 RYDEX INVERSE 2X S&P 500 ETF 2x short RSW US S&P 500 USD 07-11-2007 792 -0,019 0,469 -1,896 0,000 0,957 PROSHARES ULTRASHORT
S&P500 2x short SDS US S&P 500 USD 13-07-2006 1125 -0,016 0,369 -1,908 0,000 0,965 PROSHARES SHORT S&P500 short SH US S&P 500 USD 21-06-2006 1140 -0,007 0,608 -0,973 0,000 0,924 PROSH ULTRAPRO SHORT S&P
500 3x short SPXU US S&P 500 USD 25-06-2009 383 -0,034 0,098 -2,930 0,000 0,985 PROSHARES ULTRA S&P500 2x long SSO US S&P 500 USD 21-06-2006 1140 -0,007 0,578 1,894 0,000 0,979 PROSHARES ULTRAPRO S&P 500 3x long UPRO US S&P 500 USD 25-06-2009 383 0,0212 0,210 2,930 0,000 0,990
Table V
Tracking ability of leveraged and inverse ETFs (cont.)
Name Style Benchmark Test F Beta=-2 p-value Test F Beta=-1 p-value Test F Beta=2 p-value Test F Beta=-3 p-value Test F Beta=3 p-value
ETFX FTSE 100 SUP SHRT
ST 2X 2x short FTSE 100 1,90 0,169 DB X-TRACKERS FTSE
100 SH DA short FTSE 100 2,51 0,1136
ETFX FTSE 100
LEVERAGED 2X 2x long FTSE 100 1,97 0,161
AMUNDI ETF LEV E50 2x long Eurostoxx 50 5,92 0,015 EASYETF EU ST 50 DB
SH-CAP 2x short Eurostoxx 50 13,97 0,00 ETFX DJ EURO STOXX 50
XXII
Name Style Benchmark Test F Beta=-2 p-value Test F Beta=-1 p-value Test F Beta=2 p-value Test F Beta=-3 p-value Test F Beta=3 p-value ETFX DJ EURO ST 50 DBL SH 2X 2x short Eurostoxx 50 2,40 0,122 DB X-TRACKERS EU STXX 50 SHR short Eurostoxx 50 0,79 0,3753
LYXOR ETF XBEAR STXX
50 2x short Eurostoxx 50 25,92 0,000
RYDEX 2X S&P 500 ETF 2x long S&P 500 18,41 0,000 RYDEX INVERSE 2X S&P
500 ETF 2x short S&P 500 24,03 0,000 PROSHARES
ULTRASHORT S&P500 2x short S&P 500 47,46 0,000 PROSHARES SHORT
S&P500 short S&P 500 11,18 0,0009 PROSH ULTRAPRO
SHORT S&P 500 3x short S&P 500 10,92 0,001
PROSHARES ULTRA
S&P500 2x long S&P 500 39,87 0,000
PROSHARES ULTRAPRO
S&P 500 3x long S&P 500 17,49 0,000
(ii) Tracking Errors
As, for instance, Frino and Gallagher (2001), Rompotis (2005), and Gallagher and Segara (2005)
did, I compute the tracking error (TE) value for each equity index and leveraged and inverse
ETF. The literature presents several measures to compute the tracking error of the ETFs, which
represents the deviation of the performance of the ETF from the performance of the
corresponding benchmark index.
The first method computes the tracking error by calculating the average of absolute differences
between the returns of ETFs and the corresponding benchmark index (Equation III):
(III)
Where R
ETFt
represents the return of ETF on day t and R
Benchmarkt
represents the return of its
benchmark on the same day t.
The second method to computes the standard deviation of return differences between ETFs and
their benchmark over n days (Equation IV):
(IV)
XXIII
The last method computes the tracking error using the standard error of the regression computed
previously (Equation II).
Finally, and to reinforce the analysis, I also compute the semi tracking error, where the standard
deviation is only computed for the times the ETF does not beat the benchmark (Equation V):
N
R
R
Min
TE
S
N n Benchmarkt ETF
1 2)
0
;
(
(V)
To make easy the interpretation, I annualized all daily tracking errors by using the following
equation (Equation VI):
5
(VI)
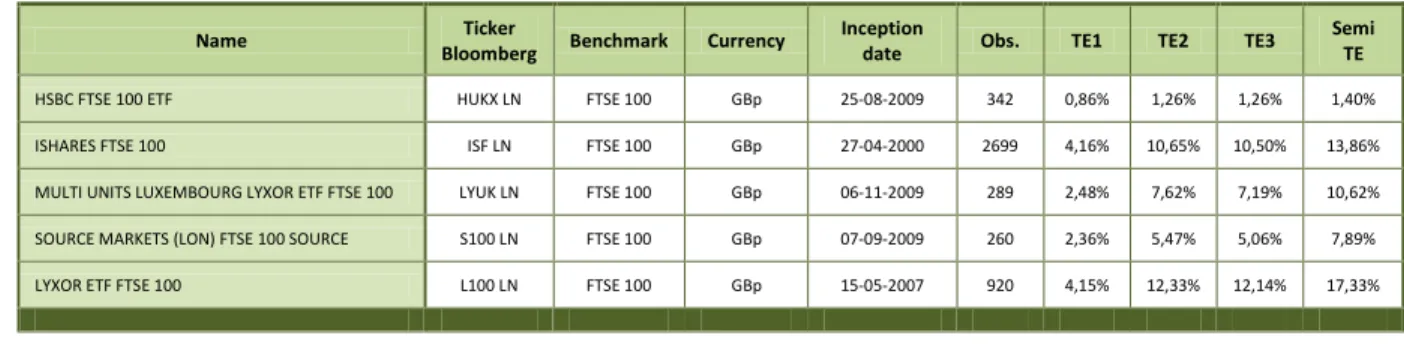
Table VI presents the results of the tracking errors and semi-tracking error, for each equity index
ETF.
We can conclude that, in general, equity index ETFs that track the S&P 500 index, do it more
precisely than equity index ETFs that track Eurostoxx 50 and FTSE 100 index. The equity index
ETFs that mimic the Eurostoxx 50 seems to be the worst into track their benchmark.
Notice that, tracking errors vary considerably. For instance for those who track FTSE 100 it goes
from 1.26% to 12.14%, while for ETFs that track the Eurostoxx 50 vary from 2.15% to 22.03%.
Table VI
Tracking Errors and Semi-Tracking Errors of equity index ETFs
Name Ticker
Bloomberg Benchmark Currency
Inception
date Obs. TE1 TE2 TE3 Semi
TE
HSBC FTSE 100 ETF HUKX LN FTSE 100 GBp 25-08-2009 342 0,86% 1,26% 1,26% 1,40% ISHARES FTSE 100 ISF LN FTSE 100 GBp 27-04-2000 2699 4,16% 10,65% 10,50% 13,86% MULTI UNITS LUXEMBOURG LYXOR ETF FTSE 100 LYUK LN FTSE 100 GBp 06-11-2009 289 2,48% 7,62% 7,19% 10,62% SOURCE MARKETS (LON) FTSE 100 SOURCE S100 LN FTSE 100 GBp 07-09-2009 260 2,36% 5,47% 5,06% 7,89% LYXOR ETF FTSE 100 L100 LN FTSE 100 GBp 15-05-2007 920 4,15% 12,33% 12,14% 17,33%
XXIV
Name Ticker
Bloomberg Benchmark Currency
Inception
date Obs. TE1 TE2 TE3 Semi
TE
HSBC.EURO STOXX 50 50E FP Eurostoxx 50 EUR n.a. 275 1,75% 2,78% 2,78% 3,40% BBVA DJ STOXX EURO 50 BBVAE SM Eurostoxx 50 EUR 30-10-2006 1081 3,43% 8,47% 8,43% 12,02% CS ETF EURO STOXX 50 SXRT GY Eurostoxx 50 EUR 10-03-2010 210 10,54% 22,46% 18,23% 33,88% UBS ETF DJ EURO STOXX 50 E50EUA GY Eurostoxx 50 EUR 19-03-2002 2290 8,96% 16,04% 15,23% 22,82% ISHARES DJ (FRA) EUROSTOXX 50 EUN2 GY Eurostoxx 50 EUR 03-04-2000 2793 4,21% 7,80% 7,80% 11,21% AMUNDI ETF DJ.ESX.50 C50 FP Eurostoxx 50 EUR 23-09-2008 576 8,78% 23,36% 22,03% 33,19% LYXOR DJ EUROSTOXX (FRA) 50 LYSX GY Eurostoxx 50 EUR 29-11-2002 2107 7,63% 12,51% 12,17% 17,25% DBX ESTX50 1C XSC FP Eurostoxx 50 EUR 27-05-2009 413 2,74% 6,36% 6,28% 8,47% ISHARES DJEURSTOX50 GXE FP Eurostoxx 50 EUR 26-09-2001 2604 8,46% 14,39% 13,95% 20,36% ISHARES EURO STX50 EUEA NA Eurostoxx 50 EUR 03-04-2000 2596 5,70% 9,64% 9,46% 13,63% ISHARES DJ ES50 A IEUA NA Eurostoxx 50 EUR 23-03-2010 202 1,38% 2,19% 2,15% 2,52% LYXOR ETF ES 50 MSE FP Eurostoxx 50 EUR 21-03-2001 2549 2,73% 5,22% 5,19% 7,29% UBSETF BB E STOXX50 FRE FP Eurostoxx 50 EUR 29-01-2003 2064 14,09% 25,25% 20,24% 33,84%
SPDR S&P 500 ETF TST. SPY US S&P 500 USD 22-01-1993 4515 2,86% 4,37% 4,39% 5,96% ISHARES S&P 500 IVV US S&P 500 USD 19-05-2000 2670 2,35% 3,44% 3,38% 4,76%
On Table VII, we have the results of the tracking error and semi-tracking error, for each
leveraged and inverse ETF. We can see that the values obtained are generally larger than the
values obtained by the equity index ETFs, which is an expected result due to the complexity of
leveraged and inverse strategies. The conclusions seem to be similar, since the leveraged and
inverse ETFs that track the S&P 500 track better their benchmark.
Table VII
Tracking Errors and Semi-Tracking Errors of leveraged and inverse ETFs
Name Style Ticker
Bloomberg Benchmark Currency
Inception
date Obs. TE 1 TE 2 TE 3 Semi TE
ETFX FTSE 100 SUP SHRT ST 2X 2x short SUK2 LN FTSE 100 GBp 15-06-2009 388 4,23% 15,40% 15,38% 22,49% DB X-TRACKERS FTSE 100 SH DA short XUKS LN FTSE 100 GBp 17-06-2008 644 5,10% 20,18% 19,61% 28,26% ETFX FTSE 100 LEVERAGED 2X 2x long LUK2 LN FTSE 100 GBp 15-06-2009 388 3,28% 8,99% 8,97% 10,01%
AMUNDI ETF LEV E50 2x long C5L FP Eurostoxx 50 EUR 29-06-2009 388 3,92% 6,53% 6,47% 8,30% EASYETF EU ST 50 DB SH-CAP 2x short EZD FP Eurostoxx 50 EUR 25-02-2009 473 10,20% 25,52% 24,73% 33,21% ETFX DJ EURO STOXX 50 LEV 2X 2x long LEU2 GY Eurostoxx 50 EUR 18-08-2009 351 10,86% 22,44% 21,57% 31,90% ETFX DJ EURO ST 50 DBL SH 2X 2x short SEU2 GY Eurostoxx 50 EUR 18-08-2009 351 9,06% 20,70% 20,57% 29,94% DB X-TRACKERS EU STXX 50 SHR short XSSX GY Eurostoxx 50 EUR 15-06-2007 908 3,61% 6,01% 6,01% 8,27% LYXOR ETF XBEAR STXX 50 2x short BXX FP Eurostoxx 50 EUR 04-04-2007 956 6,27% 11,75% 11,12% 16,77%
XXV
Name Style Ticker
Bloomberg Benchmark Currency
Inception
date Obs. TE 1 TE 2 TE 3 Semi TE
RYDEX INVERSE 2X S&P 500 ETF 2x short RSW US S&P 500 USD 07-11-2007 792 5,21% 12,34% 11,95% 19,24% PROSHARES ULTRASHORT S&P500 2x short SDS US S&P 500 USD 13-07-2006 1125 4,56% 9,77% 9,49% 17,04% PROSHARES SHORT S&P500 short SH US S&P 500 USD 21-06-2006 1140 2,26% 7,27% 7,24% 13,71% PROSH ULTRAPRO SHORT S&P 500 3x short SPXU US S&P 500 USD 25-06-2009 383 3,03% 6,56% 6,45% 9,64% PROSHARES ULTRA S&P500 2x long SSO US S&P 500 USD 21-06-2006 1140 4,43% 7,73% 7,24% 11,82% PROSHARES ULTRAPRO S&P 500 3x long UPRO US S&P 500 USD 25-06-2009 383 3,09% 5,43% 5,30% 7,67%
(iii) Premium/discount analysis
Following Ackert and Tian (2000), Elton et al (2002) and Lin and Chou (2006), I try to analyze
if the ETFs’ price traded at a premium or at a discount relatively to their NAV. To compute that,
I use the formula below (Equation VII):
(VII)
Where the α
t
counts for the deviation of the price relatively to the benchmark. If α
t
>0 the ETF
trades at a premium on day t, if α
t
<0 the ETF trades at a discount on day t.
However, in my analysis, I use the average of α
t
for each ETF, by summing N α
t
and dividing the
result by N. See equation VIII.
(VIII)
On table VIII, we can see if the equity index ETF is trading at a premium or a discount, i.e., how
the price of ETF tracks the corresponding NAV. We can conclude that the equity index ETFs
that track the FTSE 100 traded most of the time at a premium, while the equity index ETFs that
have the Eurostoxx 50 as a benchmark traded generally at a discount. For the equity index ETFs
that track the S&P 500, we cannot make a real analysis due to the reduce number of the sample
that we have.
XXVI
Table VIII
Premium/Discount analysis on equity index ETFs
Name Issuer Ticker Bloomberg Benchmark P/D
HSBC FTSE 100 ETF HSBC ETFs HUKX LN FTSE 100 0,57%
ISHARES FTSE 100 iShares ISF LN FTSE 100 0,35%
MULTI UNITS LUXEMBOURG LYXOR ETF FTSE 100 Multiunits LYUK LN FTSE 100 0,02% SOURCE MARKETS (LON) FTSE 100 SOURCE SourceMarkets S100 LN FTSE 100 0,02%
LYXOR ETF FTSE 100 Lyxor AM L100 LN FTSE 100 -0,03%
HSBC.EURO STOXX 50 HSBC ETFs 50E FP Eurostoxx 50 n.a.
BBVA DJ STOXX EURO 50 BBVA BBVAE SM Eurostoxx 50 -0,04%
CS ETF EURO STOXX 50 db x-trackers SXRT GY Eurostoxx 50 0,16%
UBS ETF DJ EURO STOXX 50 UBS E50EUA GY Eurostoxx 50 -0,15%
ISHARES DJ (FRA) EUROSTOXX 50 iShares EUN2 GY Eurostoxx 50 -0,01%
AMUNDI ETF DJ.ESX.50 Amundi IS C50 FP Eurostoxx 50 -0,06%
LYXOR DJ EUROSTOXX (FRA) 50 Lyxor AM LYSX GY Eurostoxx 50 -0,12%
DBX ESTX50 1C db x-trackers XSC FP Eurostoxx 50 -0,01%
ISHARES DJEURSTOX50 iShares GXE FP Eurostoxx 50 -0,03%
ISHARES EURO STX50 iShares EUEA NA Eurostoxx 50 -0,02%
ISHARES DJ ES50 A iShares IEUA NA Eurostoxx 50 -0,05%
LYXOR ETF ES 50 Lyxor AM MSE FP Eurostoxx 50 -0,04%
UBSETF BB E STOXX50 UBS FRE FP Eurostoxx 50 -0,65%
SPDR S&P 500 ETF TST. SPDR ETFs SPY US S&P 500 -0,02%
ISHARES S&P 500 iShares IVV US S&P 500 0,01%
On table IX, I make the same analysis but for leveraged and inverse ETFs. Notice that we have a
lack of data on leveraged and inverse ETFs that track the performance of FTSE 100, while on
leveraged and inverse ETFs that mimic the performance of the Eurostoxx 50 and S&P 500 we
can conclude that, in average, the ETFs traded at a premium.
XXVII
Table IX
Premium/Discount analysis on leveraged and inverse ETFs
Name Style Ticker
Bloomberg Benchmark Currency
Inception
date Obs. P/D
ETFX FTSE 100 SUP SHRT ST 2X 2x short SUK2 LN FTSE 100 GBp 15-06-2009 388 -0,03% DB X-TRACKERS FTSE 100 SH DA short XUKS LN FTSE 100 GBp 17-06-2008 644 1,05% ETFX FTSE 100 LEVERAGED 2X 2x long LUK2 LN FTSE 100 GBp 15-06-2009 388 -0,04%
AMUNDI ETF LEV E50 2x long C5L FP Eurostoxx 50 EUR 29-06-2009 394 0,04% EASYETF EU ST 50 DB SH-CAP 2x short EZD FP Eurostoxx 50 EUR 25-02-2009 482 0,09% ETFX DJ EURO STOXX 50 LEV 2X 2x long LEU2 GY Eurostoxx 50 EUR 18-08-2009 358 0,05% ETFX DJ EURO ST 50 DBL SH 2X 2x short SEU2 GY Eurostoxx 50 EUR 18-08-2009 358 0,08% DB X-TRACKERS EU STXX 50 SHR short XSSX GY Eurostoxx 50 EUR 15-06-2007 926 0,01% LYXOR ETF XBEAR STXX 50 2x short BXX FP Eurostoxx 50 EUR 04-04-2007 977 0,13%
RYDEX 2X S&P 500 ETF 2x long RSU US S&P 500 USD 07-11-2007 822 0,00% RYDEX INVERSE 2X S&P 500 ETF 2x short RSW US S&P 500 USD 07-11-2007 822 0,01% PROSHARES ULTRASHORT S&P500 2x short SDS US S&P 500 USD 13-07-2006 1166 0,01% PROSHARES SHORT S&P500 short SH US S&P 500 USD 21-06-2006 1182 0,02% PROSH ULTRAPRO SHORT S&P 500 3x short SPXU US S&P 500 USD 25-06-2009 396 0,00% PROSHARES ULTRA S&P500 2x long SSO US S&P 500 USD 21-06-2006 1182 -0,04% PROSHARES ULTRAPRO S&P 500 3x long UPRO US S&P 500 USD 25-06-2009 396 -0,05%
(iv) Time Consistency of Tracking abilities
In this section, I try to understand the evolution of the alpha, beta and tracking error for each
equity linear ETF in the time frame in analysis. I compute alpha, beta and the tracking errors
using moving windows of 60 observations. Because I am interesting in the mimicking abilities of
the ETFs I use the NAV of the ETFs in this analysis.
So, on the figures below (Figure III, IV, V, VI, VII and VIII), we can see the value of the alpha
and beta for each ETF, grouped into benchmarks. We can see that the alpha of equity index ETFs
that track the Eurostoxx 50 are, in average, more volatile than the equity index ETFs that track
the FTSE 100 and S&P 500. Addicionally, the evolution of the beta shows again that, equity
index ETFs that track the Eurostoxx 50 have, in average, more difficult into track its benchmark
than the equity index ETFs that track other benchmarks.
XXVIII
Figure III
Evolution of the alpha of equity index ETFs that track the FTSE 100
Figure IV
Evolution of the alpha of equity index ETFs that track the Eurostoxx 50
-0,1 -0,08 -0,06 -0,04 -0,02 0 0,02 0,04 0,06 0,08 0,1
Mai-00 Mai-02 Mai-04 Mai-06 Mai-08 Mai-10
HUKX LN ISF LN LYUK LN S100 LN L100 LN -0,25 -0,2 -0,15 -0,1 -0,05 0 0,05 0,1 0,15 0,2 0,25
Abr-00 Abr-02 Abr-04 Abr-06 Abr-08 Abr-10
50E FP BBVAE SM SXRT GY E50EUA GY EUN2 GY C50 FP LYSX GY XSC FP GXE FP EUEA NA IEUA NA MSE FP FRE FP
XXIX
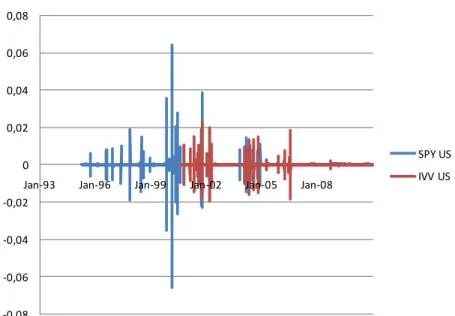
Figure V
Evolution of the alpha of equity index ETFs that track the S&P 500
Figure VI
Evolution of the beta of equity index ETFs that track the FTSE 100
-0,08 -0,06 -0,04 -0,02 0 0,02 0,04 0,06 0,08Jan-93 Jan-96 Jan-99 Jan-02 Jan-05 Jan-08
SPY US IVV US -0,5 0 0,5 1 1,5 2
Abr-00 Abr-02 Abr-04 Abr-06 Abr-08 Abr-10
HUKX LN ISF LN LYUK LN S100 LN L100 LN
XXX
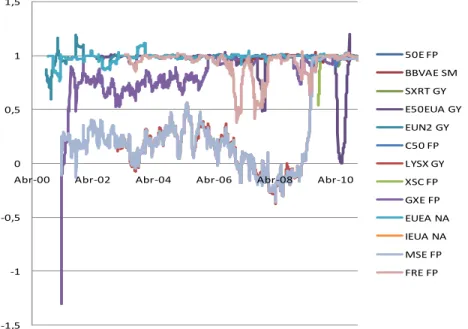
Figure VII
Evolution of the beta of equity index ETFs that track the Eurostoxx 50
Figure VIII
Evolution of the beta of equity index ETFs that track the S&P 500
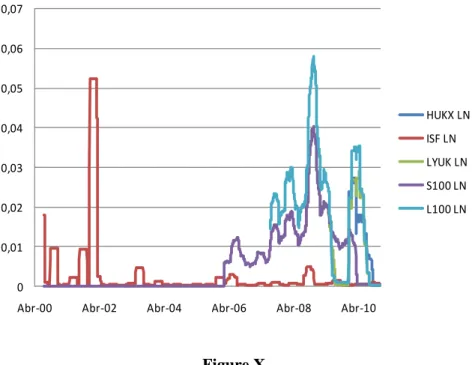
On figures IX, X and XI, we can see the value of the tracking error (computed by the second
method) for each equity index ETF, from the three benchmarks, during the time frame in
analysis. We can see that the tracking errors of ETFs that track the Eurostoxx 50 assume, in
-1,5 -1 -0,5 0 0,5 1 1,5
Abr-00 Abr-02 Abr-04 Abr-06 Abr-08 Abr-10
50E FP BBVAE SM SXRT GY E50EUA GY EUN2 GY C50 FP LYSX GY XSC FP GXE FP EUEA NA IEUA NA MSE FP FRE FP
0,6
0,7
0,8
0,9
1
1,1
1,2
Jan-93
Jan-95
Jan-97
Jan-99
Jan-01
Jan-03
Jan-05
Jan-07
Jan-09
SPY US
IVV US
XXXI
average, a higher value, so, a high divergence with the benchmark. Again, the ETFs that track
the S&P 500 present a higher capacity into track the performance of their benchmark.
Figure IX
Evolution of the TE of equity index ETFs that track the FTSE 100
Figure X
Evolution of the TE of equity index ETFs that track the Eurostoxx 50
0
0,01
0,02
0,03
0,04
0,05
0,06
0,07
Abr-00
Abr-02
Abr-04
Abr-06
Abr-08
Abr-10
HUKX LN
ISF LN
LYUK LN
S100 LN
L100 LN
0 0,02 0,04 0,06 0,08 0,1 0,12 0,14Abr-00 Abr-02 Abr-04 Abr-06 Abr-08 Abr-10
50E FP BBVAE SM SXRT GY E50EUA GY EUN2 GY C50 FP LYSX GY XSC FP GXE FP EUEA NA IEUA NA MSE FP FRE FP
XXXII
Figure XI
Evolution of the TE of equity index ETFs that track the S&P 500
(v) Main conclusions
Equity index ETFs
Linking the information regarding equity index ETFs, we can see that there is no parallelism
between the number of observations, which is obviously related with the inception date, and the
value of the beta for each equity index ETF. So, in this case, it is not true that usually the ETFs
that have oldest inception date are the same that have the larger tracking capacity, i.e., that have
the beta closer to 1. Additionally, the average volume of the last 6 month is not explained by the
beta of the ETF, i.e., the average volume is not explained by the tracking ability of the ETF. The
same conclusion can be applied to the fees, since fees are not explained by the tracking ability of
the ETF. Thus, an ETF with a highest fee is not always the same that has the highest tracking
capacity. Finally, we can see that the relation between beta and tracking error is not linear, the
ETFs with low tracking errors are not always the ETFs that have a beta closer to 1. However, the
ETFs that reject the null hypothesis on the F-Test are usually the same that have a beta closer to
1 and lower TE.
0 0,002 0,004 0,006 0,008 0,01 0,012 0,014 0,016 0,018
Jan-93 Jan-95 Jan-97 Jan-99 Jan-01 Jan-03 Jan-05 Jan-07 Jan-09
SPY US IVV US
XXXIII
In sum, to choose an ETF, the investor should decided what feature he considers to be the most
important one, which feature makes an ETF preferable to the other that track the same index, that
have the same benchmark.
Leveraged and inverse ETFs
In a cross analysis, we can see a relation among the average volume, tracking error and beta on
two ETFs that tracks 2 times the performance of the S&P 500, where the ETF with the highest
average volume is the same with the lowest tracking error and with the beta closer to 2.
However, on the ETFs that track 2x the performance of the Eurostoxx 50, the same conclusion is
not applicable. On ETFs that track 2x the inverse of the S&P 500 index, we can see through the
average volume, tracking error and beta that, again, the ETF with the highest volume, is the same
with the lowest tracking error and beta closer to -2, while on the ETFs that track 2x the inverse of
the Eurostoxx 50 index, we cannot see that relation.
(vi) Comparison with Mutual Funds
Mutual Funds
For mutual funds, after extracting from Lipper a series of mutual funds information, I restricted
the provisional database by filtering some of them. I started by choosing only open-end indexed
mutual funds, and by eliminating ETFs that possibility could be among the information
extracted. Then, I selected only mutual funds that are primary flag and that declare as having as
benchmark the FTSE 100, Eurostoxx 50 and the S&P 500. Finally, and to complete the process, I
chose only mutual funds with an ISIN code, in order to extract the additional data from
Bloomberg. Notice that, in the final I organized mutual funds in three sets, since each set account
for one benchmark index, as I did for ETFs.
On annex IV, V and VI, I present the summary statistics and on annex VII, VIII and IX, I present
the detailed information about the of my final database. We can see that mutual funds, that track
the S&P 500 index, have the largest number of observations and the largest sample (number of
XXXIV
mutual funds). Mutual funds that track the FTSE 100 index present more observations than the
mutual funds that track the Eurostoxx 50 index, while in terms of ETFs’ sample, we have the
opposite. Additionally, by making a simple average of the information about the fees for each
benchmark mutual funds, we can conclude that, the mutual funds that track the performance of
S&P 500 present, in average, the lowest fees, while the mutual funds that track the performance
of Eurostoxx 50 present, in average, the highest fees.
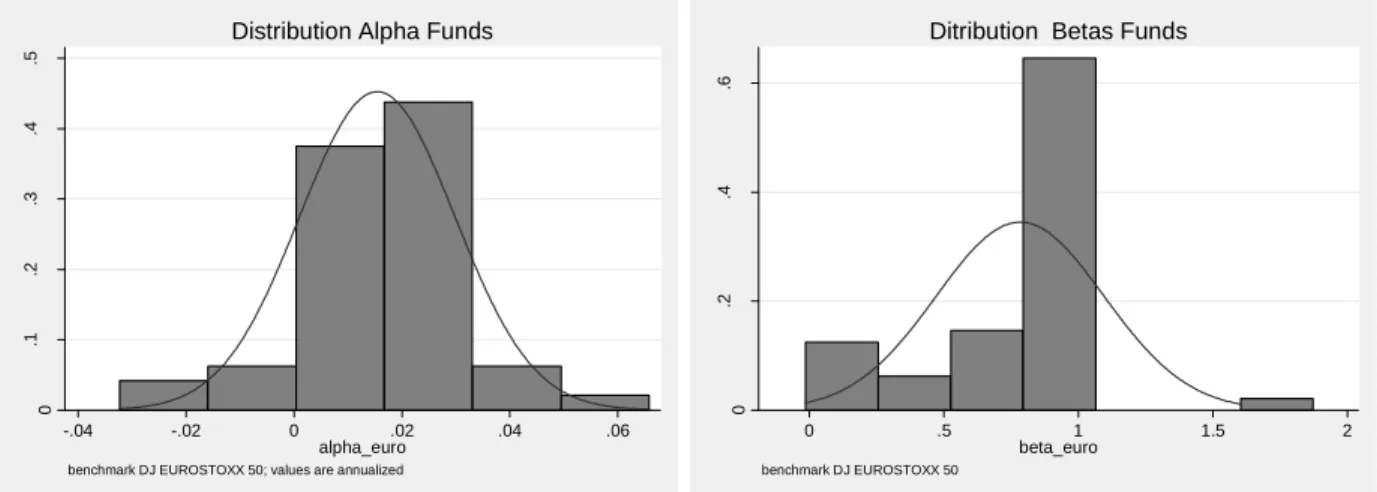
On annex X, we can see the results of the time-series regression for the set of Mutual Fund that
track the performance of the Eurostoxx 50 index. The alpha assumes a small value for
commonplace mutual funds and there is only statistically significant with 95% confidence level
for one mutual fund, ING Direct Fondo Naranja Euro Stoxx 50, FI. The average Beta rounds 0.8,
which shows that, in average, mutual funds have not significant deviations from the benchmark.
Among all the observations, only two Betas are not statistically significant, the Argenta actions
UEM and Euro Indiciel LCF (see also Figure XII).
Figure XII
Distribution of Alpha and Beta values for Mutual Funds that have the Eurostoxx 50 as the benchmark
Annex XI shows the same information as annex X but for mutual funds that track the
performance of FTSE 100. Like in the previous set of mutual funds, the alpha assumes a small
value for the majority of mutual funds and it is not statistically significant. The average beta is
lower than on mutual funds presented on annex X, showing that mutual funds that track the
FTSE 100 index have significant difficult into track its benchmark and, in this case, only one
mutual fund has a beta significant closer to 1, EMIF UK Index Plus B C (Load). Among the set
0 .1 .2 .3 .4 .5 F ra ct io n -.04 -.02 0 .02 .04 .06 alpha_euro
benchmark DJ EUROSTOXX 50; values are annualized
Distribution Alpha Funds
0 .2 .4 .6 F ra ct io n 0 .5 1 1.5 2 beta_euro benchmark DJ EUROSTOXX 50